
 Login Sign Up


| |||||
 |  | ||||

| 12Stocks.com Market Intelligence |
Best S&P 100 Stocks
| In a hurry? S&P 100 Stocks Lists: Performance Trends Table, Stock Charts
Sort S&P 100 stocks: Daily, Weekly, Year-to-Date, Market Cap & Trends. |
| 12Stocks.com S&P 100 Stocks Performances & Trends Daily | |||||||||
|
|  The overall Smart Investing & Trading Score is 58 (0-bearish to 100-bullish) which puts S&P 100 index in short term neutral trend. The Smart Investing & Trading Score from previous trading session is 51 and hence an improvement of trend.
| ||||||||
Here are the Smart Investing & Trading Scores of the most requested S&P 100 stocks at 12Stocks.com (click stock name for detailed review):
|


| 12Stocks.com: Top Performing S&P 100 Index Stocks | ||||||||||||||||||||||||||||||||||||||||||||||||
 The top performing S&P 100 Index stocks year to date are
Now, more recently, over last week, the top performing S&P 100 Index stocks on the move are


|
||||||||||||||||||||||||||||||||||||||||||||||||
| 12Stocks.com: Investing in S&P 100 Index with Stocks | |
|
The following table helps investors and traders sort through current performance and trends (as measured by Smart Investing & Trading Score) of various
stocks in the S&P 100 Index. Quick View: Move mouse or cursor over stock symbol (ticker) to view short-term technical chart and over stock name to view long term chart. Click on  to add stock symbol to your watchlist and to add stock symbol to your watchlist and  to view watchlist. Click on any ticker or stock name for detailed market intelligence report for that stock. to view watchlist. Click on any ticker or stock name for detailed market intelligence report for that stock. |
12Stocks.com Performance of Stocks in S&P 100 Index
| Ticker | Stock Name | Watchlist | Category | Recent Price | Smart Investing & Trading Score | Change % | YTD Change% |
| GE | General Electric |   | Industrials | 162.62 | 80 | 8.28 | 27.42% |
| DHR | Danaher | | Industrials | 253.11 | 100 | 7.21 | 9.41% |
| TMO | Thermo Fisher | | Health Care | 574.59 | 85 | 4.78 | 8.25% |
| GM | General Motors | | Consumer Staples | 45.10 | 95 | 4.37 | 25.56% |
| NFLX | Netflix | | Technology | 577.45 | 43 | 4.12 | 18.60% |
| PM | Philip Morris | | Consumer Staples | 97.66 | 100 | 3.83 | 3.81% |
| NVDA | NVIDIA | | Technology | 823.87 | 48 | 3.61 | 66.36% |
| META | Meta Platforms | | Technology | 495.94 | 48 | 2.95 | 40.09% |
| VZ | Verizon | | Technology | 39.70 | 15 | 2.85 | 5.31% |
| C | Citi | | Financials | 62.67 | 95 | 2.82 | 21.83% |
| AXP | American Express | | Financials | 238.96 | 100 | 2.56 | 27.55% |
| AMD | Advanced Micro | | Technology | 152.23 | 17 | 2.42 | 3.27% |
| UPS | United Parcel | | Transports | 148.87 | 85 | 2.41 | -5.32% |
| BKNG | Booking | | Services & Goods | 3534.03 | 68 | 2.05 | -0.37% |
| LLY | Eli Lilly | | Health Care | 745.69 | 51 | 1.96 | 27.92% |
| PYPL | PayPal | | Financials | 64.43 | 68 | 1.96 | 4.92% |
| MDLZ | Mondelez | | Consumer Staples | 70.76 | 64 | 1.94 | -2.31% |
| AVGO | Broadcom | | Technology | 1248.11 | 51 | 1.93 | 11.81% |
| TSLA | Tesla | | Consumer Staples | 144.63 | 27 | 1.82 | -41.79% |
| MS | Morgan Stanley | | Financials | 93.76 | 100 | 1.81 | 0.55% |
| BAC | Bank of America | | Financials | 38.37 | 100 | 1.70 | 13.96% |
| GS | Goldman Sachs | | Financials | 424.00 | 100 | 1.59 | 9.91% |
| CAT | Caterpillar | | Industrials | 363.25 | 68 | 1.58 | 22.86% |
| MSFT | Microsoft | | Technology | 407.24 | 58 | 1.57 | 8.30% |
| DIS | Walt Disney | | Services & Goods | 113.71 | 68 | 1.54 | 25.94% |
| For chart view version of above stock list: Chart View ➞ 0 - 25 , 25 - 50 , 50 - 75 , 75 - 100 , 100 - 125 | ||
 | Click To Change The Sort Order: By Market Cap or Company Size Performance: Year-to-date, Week and Day |  |
|
Get the most comprehensive stock market coverage daily at 12Stocks.com ➞ Best Stocks Today ➞ Best Stocks Weekly ➞ Best Stocks Year-to-Date ➞ Best Stocks Trends ➞  Best Stocks Today 12Stocks.com Best Nasdaq Stocks ➞ Best S&P 500 Stocks ➞ Best Tech Stocks ➞ Best Biotech Stocks ➞ |
| Detailed Overview of S&P 100 Stocks |
| S&P 100 Technical Overview, Leaders & Laggards, Top S&P 100 ETF Funds & Detailed S&P 100 Stocks List, Charts, Trends & More |
| S&P 100: Technical Analysis, Trends & YTD Performance | |
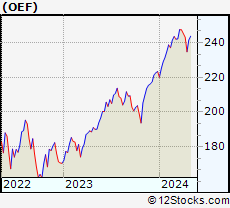
| S&P 100 index as represented by
OEF, an exchange-traded fund [ETF], holds basket of one hundred US (mostly largecap) stocks from across all major sectors of the US stock market. The S&P 100 index (contains stocks like Apple and Exxon) is up by 7.41% and is currently outperforming the overall market by 1.77% year-to-date. Below is a quick view of technical charts and trends: | |
 OEF Weekly Chart |
|
| Long Term Trend: Good | |
| Medium Term Trend: Not Good | |
 OEF Daily Chart |
|
| Short Term Trend: Very Good | |
| Overall Trend Score: 58 | |
| YTD Performance: 7.41% | |
| **Trend Scores & Views Are Only For Educational Purposes And Not For Investing | |
| 12Stocks.com: Investing in S&P 100 Index using Exchange Traded Funds | |
|
The following table shows list of key exchange traded funds (ETF) that
help investors track S&P 100 index. We have also included ETF funds that track S&P 500 index since it is market-cap weighted. The following list also includes leveraged ETF funds that track twice or thrice the daily returns of S&P 100 indices. Short or inverse ETF funds move in the opposite direction to the index they track and are useful during market pullbacks or during bear markets. Quick View: Move mouse or cursor over ETF symbol (ticker) to view short-term technical chart and over ETF name to view long term chart. Click on ticker or stock name for detailed view. Click on to add stock symbol to your watchlist and to view watchlist. |
12Stocks.com List of ETFs that track S&P 100 Index
| Ticker | ETF Name | Watchlist | Recent Price | Smart Investing & Trading Score | Change % | Week % | Year-to-date % |
| SPY | SPDR S&P 500 ETF | | 505.65 | 58 | 1.19 | 2.12 | 6.38% |
| SH | ProShares Short S&P500 | | 12.34 | 42 | -1.20 | -1.99 | -5% |
| SPXS | Direxion Daily S&P 500 Bear 3X ETF | | 9.82 | 32 | -4.75 | -5.21 | -14.98% |
| SDS | ProShares UltraShort S&P500 | | 26.78 | 37 | -2.30 | -4.01 | -10.49% |
| SSO | ProShares Ultra S&P500 | | 72.04 | 63 | 2.43 | 4.24 | 10.71% |
| SPXU | ProShares UltraPro Short S&P500 | | 35.99 | 42 | -3.62 | -6.1 | -16.3% |
| UPRO | ProShares UltraPro S&P500 | | 62.93 | 58 | 3.59 | 6.37 | 14.96% |
| SPXL | Direxion Daily S&P500 Bull 3X ETF | | 118.62 | 58 | 2.75 | 5.39 | 14.07% |
| VOO | Vanguard 500 ETF | | 463.37 | 58 | 1.70 | 1.82 | 6.08% |
| OEF | iShares S&P 100 | | 239.95 | 58 | 1.33 | 2.25 | 7.41% |
| 12Stocks.com: Charts, Trends, Fundamental Data and Performances of S&P 100 Stocks | |
|
We now take in-depth look at all S&P 100 stocks including charts, multi-period performances and overall trends (as measured by Smart Investing & Trading Score). One can sort S&P 100 stocks (click link to choose) by Daily, Weekly and by Year-to-Date performances. Also, one can sort by size of the company or by market capitalization. |
| Select Your Default Chart Type: | |||||
| |||||
| Click on stock symbol or name for detailed view. Click on to add stock symbol to your watchlist and to view watchlist. Quick View: Move mouse or cursor over "Daily" to quickly view daily technical stock chart and over "Weekly" to view weekly technical stock chart. | |||||

 | GE General Electric Company |
| Sector: Industrials | |
| SubSector: Diversified Machinery | |
| MarketCap: 64710.6 Millions | |
| Recent Price: 162.62 Smart Investing & Trading Score: 80 | |
| Day Percent Change: 8.28% Day Change: 12.43 | |
| Week Change: 9.83% Year-to-date Change: 27.4% | |
| GE Links: Profile News Message Board | |
| Charts:- Daily , Weekly | |
| Add GE to Watchlist: View: Get Complete GE Trend Analysis ➞ | |
 | DHR Danaher Corporation |
| Sector: Industrials | |
| SubSector: Diversified Machinery | |
| MarketCap: 93210.3 Millions | |
| Recent Price: 253.11 Smart Investing & Trading Score: 100 | |
| Day Percent Change: 7.21% Day Change: 17.03 | |
| Week Change: 7.47% Year-to-date Change: 9.4% | |
| DHR Links: Profile News Message Board | |
| Charts:- Daily , Weekly | |
| Add DHR to Watchlist: View: Get Complete DHR Trend Analysis ➞ | |
 | TMO Thermo Fisher Scientific Inc. |
| Sector: Health Care | |
| SubSector: Medical Laboratories & Research | |
| MarketCap: 112999 Millions | |
| Recent Price: 574.59 Smart Investing & Trading Score: 85 | |
| Day Percent Change: 4.78% Day Change: 26.21 | |
| Week Change: 5.47% Year-to-date Change: 8.3% | |
| TMO Links: Profile News Message Board | |
| Charts:- Daily , Weekly | |
| Add TMO to Watchlist: View: Get Complete TMO Trend Analysis ➞ | |
 | GM General Motors Company |
| Sector: Consumer Staples | |
| SubSector: Auto Manufacturers - Major | |
| MarketCap: 29252.4 Millions | |
| Recent Price: 45.10 Smart Investing & Trading Score: 95 | |
| Day Percent Change: 4.37% Day Change: 1.89 | |
| Week Change: 6.44% Year-to-date Change: 25.6% | |
| GM Links: Profile News Message Board | |
| Charts:- Daily , Weekly | |
| Add GM to Watchlist: View: Get Complete GM Trend Analysis ➞ | |
 | NFLX Netflix, Inc. |
| Sector: Technology | |
| SubSector: CATV Systems | |
| MarketCap: 162108 Millions | |
| Recent Price: 577.45 Smart Investing & Trading Score: 43 | |
| Day Percent Change: 4.12% Day Change: 22.85 | |
| Week Change: 4.04% Year-to-date Change: 18.6% | |
| NFLX Links: Profile News Message Board | |
| Charts:- Daily , Weekly | |
| Add NFLX to Watchlist: View: Get Complete NFLX Trend Analysis ➞ | |
 | PM Philip Morris International Inc. |
| Sector: Consumer Staples | |
| SubSector: Cigarettes | |
| MarketCap: 105035 Millions | |
| Recent Price: 97.66 Smart Investing & Trading Score: 100 | |
| Day Percent Change: 3.83% Day Change: 3.60 | |
| Week Change: 4.15% Year-to-date Change: 3.8% | |
| PM Links: Profile News Message Board | |
| Charts:- Daily , Weekly | |
| Add PM to Watchlist: View: Get Complete PM Trend Analysis ➞ | |
 | NVDA NVIDIA Corporation |
| Sector: Technology | |
| SubSector: Semiconductor - Specialized | |
| MarketCap: 143476 Millions | |
| Recent Price: 823.87 Smart Investing & Trading Score: 48 | |
| Day Percent Change: 3.61% Day Change: 28.69 | |
| Week Change: 8.12% Year-to-date Change: 66.4% | |
| NVDA Links: Profile News Message Board | |
| Charts:- Daily , Weekly | |
| Add NVDA to Watchlist: View: Get Complete NVDA Trend Analysis ➞ | |
 | META Meta Platforms, Inc. |
| Sector: Technology | |
| SubSector: Internet Content & Information | |
| MarketCap: 732990 Millions | |
| Recent Price: 495.94 Smart Investing & Trading Score: 48 | |
| Day Percent Change: 2.95% Day Change: 14.21 | |
| Week Change: 3.09% Year-to-date Change: 40.1% | |
| META Links: Profile News Message Board | |
| Charts:- Daily , Weekly | |
| Add META to Watchlist: View: Get Complete META Trend Analysis ➞ | |
 | VZ Verizon Communications Inc. |
| Sector: Technology | |
| SubSector: Telecom Services - Domestic | |
| MarketCap: 229427 Millions | |
| Recent Price: 39.70 Smart Investing & Trading Score: 15 | |
| Day Percent Change: 2.85% Day Change: 1.10 | |
| Week Change: -1.95% Year-to-date Change: 5.3% | |
| VZ Links: Profile News Message Board | |
| Charts:- Daily , Weekly | |
| Add VZ to Watchlist: View: Get Complete VZ Trend Analysis ➞ | |
 | C Citigroup Inc. |
| Sector: Financials | |
| SubSector: Money Center Banks | |
| MarketCap: 94128 Millions | |
| Recent Price: 62.67 Smart Investing & Trading Score: 95 | |
| Day Percent Change: 2.82% Day Change: 1.72 | |
| Week Change: 5.97% Year-to-date Change: 21.8% | |
| C Links: Profile News Message Board | |
| Charts:- Daily , Weekly | |
| Add C to Watchlist: View: Get Complete C Trend Analysis ➞ | |
 | AXP American Express Company |
| Sector: Financials | |
| SubSector: Credit Services | |
| MarketCap: 68388 Millions | |
| Recent Price: 238.96 Smart Investing & Trading Score: 100 | |
| Day Percent Change: 2.56% Day Change: 5.96 | |
| Week Change: 3.43% Year-to-date Change: 27.6% | |
| AXP Links: Profile News Message Board | |
| Charts:- Daily , Weekly | |
| Add AXP to Watchlist: View: Get Complete AXP Trend Analysis ➞ | |
 | AMD Advanced Micro Devices, Inc. |
| Sector: Technology | |
| SubSector: Semiconductor - Broad Line | |
| MarketCap: 54275.1 Millions | |
| Recent Price: 152.23 Smart Investing & Trading Score: 17 | |
| Day Percent Change: 2.42% Day Change: 3.59 | |
| Week Change: 3.81% Year-to-date Change: 3.3% | |
| AMD Links: Profile News Message Board | |
| Charts:- Daily , Weekly | |
| Add AMD to Watchlist: View: Get Complete AMD Trend Analysis ➞ | |
 | UPS United Parcel Service, Inc. |
| Sector: Transports | |
| SubSector: Air Delivery & Freight Services | |
| MarketCap: 81928.9 Millions | |
| Recent Price: 148.87 Smart Investing & Trading Score: 85 | |
| Day Percent Change: 2.41% Day Change: 3.51 | |
| Week Change: 4.27% Year-to-date Change: -5.3% | |
| UPS Links: Profile News Message Board | |
| Charts:- Daily , Weekly | |
| Add UPS to Watchlist: View: Get Complete UPS Trend Analysis ➞ | |
 | BKNG Booking Holdings Inc. |
| Sector: Services & Goods | |
| SubSector: Business Services | |
| MarketCap: 54467.9 Millions | |
| Recent Price: 3534.03 Smart Investing & Trading Score: 68 | |
| Day Percent Change: 2.05% Day Change: 71.03 | |
| Week Change: 3.49% Year-to-date Change: -0.4% | |
| BKNG Links: Profile News Message Board | |
| Charts:- Daily , Weekly | |
| Add BKNG to Watchlist: View: Get Complete BKNG Trend Analysis ➞ | |
 | LLY Eli Lilly and Company |
| Sector: Health Care | |
| SubSector: Drug Manufacturers - Major | |
| MarketCap: 130066 Millions | |
| Recent Price: 745.69 Smart Investing & Trading Score: 51 | |
| Day Percent Change: 1.96% Day Change: 14.36 | |
| Week Change: 2.67% Year-to-date Change: 27.9% | |
| LLY Links: Profile News Message Board | |
| Charts:- Daily , Weekly | |
| Add LLY to Watchlist: View: Get Complete LLY Trend Analysis ➞ | |
 | PYPL PayPal Holdings, Inc. |
| Sector: Financials | |
| SubSector: Credit Services | |
| MarketCap: 108949 Millions | |
| Recent Price: 64.43 Smart Investing & Trading Score: 68 | |
| Day Percent Change: 1.96% Day Change: 1.24 | |
| Week Change: 3.4% Year-to-date Change: 4.9% | |
| PYPL Links: Profile News Message Board | |
| Charts:- Daily , Weekly | |
| Add PYPL to Watchlist: View: Get Complete PYPL Trend Analysis ➞ | |
 | MDLZ Mondelez International, Inc. |
| Sector: Consumer Staples | |
| SubSector: Confectioners | |
| MarketCap: 68385.8 Millions | |
| Recent Price: 70.76 Smart Investing & Trading Score: 64 | |
| Day Percent Change: 1.94% Day Change: 1.35 | |
| Week Change: 3.89% Year-to-date Change: -2.3% | |
| MDLZ Links: Profile News Message Board | |
| Charts:- Daily , Weekly | |
| Add MDLZ to Watchlist: View: Get Complete MDLZ Trend Analysis ➞ | |
 | AVGO Broadcom Inc. |
| Sector: Technology | |
| SubSector: Semiconductor - Broad Line | |
| MarketCap: 86329.1 Millions | |
| Recent Price: 1248.11 Smart Investing & Trading Score: 51 | |
| Day Percent Change: 1.93% Day Change: 23.65 | |
| Week Change: 3.6% Year-to-date Change: 11.8% | |
| AVGO Links: Profile News Message Board | |
| Charts:- Daily , Weekly | |
| Add AVGO to Watchlist: View: Get Complete AVGO Trend Analysis ➞ | |
 | TSLA Tesla, Inc. |
| Sector: Consumer Staples | |
| SubSector: Auto Manufacturers - Major | |
| MarketCap: 89058.8 Millions | |
| Recent Price: 144.63 Smart Investing & Trading Score: 27 | |
| Day Percent Change: 1.82% Day Change: 2.58 | |
| Week Change: -1.65% Year-to-date Change: -41.8% | |
| TSLA Links: Profile News Message Board | |
| Charts:- Daily , Weekly | |
| Add TSLA to Watchlist: View: Get Complete TSLA Trend Analysis ➞ | |
 | MS Morgan Stanley |
| Sector: Financials | |
| SubSector: Investment Brokerage - National | |
| MarketCap: 55876.7 Millions | |
| Recent Price: 93.76 Smart Investing & Trading Score: 100 | |
| Day Percent Change: 1.81% Day Change: 1.67 | |
| Week Change: 3.42% Year-to-date Change: 0.6% | |
| MS Links: Profile News Message Board | |
| Charts:- Daily , Weekly | |
| Add MS to Watchlist: View: Get Complete MS Trend Analysis ➞ | |
 | BAC Bank of America Corporation |
| Sector: Financials | |
| SubSector: Money Center Banks | |
| MarketCap: 189690 Millions | |
| Recent Price: 38.37 Smart Investing & Trading Score: 100 | |
| Day Percent Change: 1.70% Day Change: 0.64 | |
| Week Change: 3.79% Year-to-date Change: 14.0% | |
| BAC Links: Profile News Message Board | |
| Charts:- Daily , Weekly | |
| Add BAC to Watchlist: View: Get Complete BAC Trend Analysis ➞ | |
 | GS The Goldman Sachs Group, Inc. |
| Sector: Financials | |
| SubSector: Investment Brokerage - National | |
| MarketCap: 54579.3 Millions | |
| Recent Price: 424.00 Smart Investing & Trading Score: 100 | |
| Day Percent Change: 1.59% Day Change: 6.65 | |
| Week Change: 4.95% Year-to-date Change: 9.9% | |
| GS Links: Profile News Message Board | |
| Charts:- Daily , Weekly | |
| Add GS to Watchlist: View: Get Complete GS Trend Analysis ➞ | |
 | CAT Caterpillar Inc. |
| Sector: Industrials | |
| SubSector: Farm & Construction Machinery | |
| MarketCap: 58636 Millions | |
| Recent Price: 363.25 Smart Investing & Trading Score: 68 | |
| Day Percent Change: 1.58% Day Change: 5.64 | |
| Week Change: 2.42% Year-to-date Change: 22.9% | |
| CAT Links: Profile News Message Board | |
| Charts:- Daily , Weekly | |
| Add CAT to Watchlist: View: Get Complete CAT Trend Analysis ➞ | |
 | MSFT Microsoft Corporation |
| Sector: Technology | |
| SubSector: Business Software & Services | |
| MarketCap: 1154150 Millions | |
| Recent Price: 407.24 Smart Investing & Trading Score: 58 | |
| Day Percent Change: 1.57% Day Change: 6.28 | |
| Week Change: 2.03% Year-to-date Change: 8.3% | |
| MSFT Links: Profile News Message Board | |
| Charts:- Daily , Weekly | |
| Add MSFT to Watchlist: View: Get Complete MSFT Trend Analysis ➞ | |
 | DIS The Walt Disney Company |
| Sector: Services & Goods | |
| SubSector: Entertainment - Diversified | |
| MarketCap: 178396 Millions | |
| Recent Price: 113.71 Smart Investing & Trading Score: 68 | |
| Day Percent Change: 1.54% Day Change: 1.72 | |
| Week Change: 0.98% Year-to-date Change: 25.9% | |
| DIS Links: Profile News Message Board | |
| Charts:- Daily , Weekly | |
| Add DIS to Watchlist: View: Get Complete DIS Trend Analysis ➞ | |
| For tabular summary view of above stock list: Summary View ➞ 0 - 25 , 25 - 50 , 50 - 75 , 75 - 100 , 100 - 125 | ||
| Click To Change The Sort Order: By Market Cap or Company Size Performance: Year-to-date, Week and Day | |
| Select Chart Type: | ||
|
Best Stocks Today 12Stocks.com |
� 2024 12Stocks.com Terms & Conditions Privacy Contact Us
All Information Provided Only For Education And Not To Be Used For Investing or Trading. See Terms & Conditions


One More Thing ... Get Best Stocks Delivered Daily!
Never Ever Miss A Move With Our Top Ten Stocks Lists
Find Best Stocks In Any Market - Bull or Bear Market
Take A Peek At Our Top Ten Stocks Lists: Daily, Weekly, Year-to-Date & Top Trends
Find Best Stocks In Any Market - Bull or Bear Market
Take A Peek At Our Top Ten Stocks Lists: Daily, Weekly, Year-to-Date & Top Trends
S&P 100 Stocks With Best Up Trends [0-bearish to 100-bullish]: Danaher [100], Philip Morris[100], American Express[100], Morgan Stanley[100], Bank of America[100], Goldman Sachs[100], NextEra Energy[100], Charles Schwab[100], Altria [100], Procter & Gamble[100], Bank of New York[100]
Best S&P 100 Stocks Year-to-Date:
NVIDIA [66.36%], Meta Platforms[40.09%], Eli Lilly[27.92%], American Express[27.55%], General Electric[27.42%], Walt Disney[25.94%], General Motors[25.56%], Wells Fargo[23.81%], Caterpillar [22.86%], Citi [21.83%], Exxon Mobil[21.05%] Best S&P 100 Stocks This Week:
General Electric[9.83%], NVIDIA [8.12%], Danaher [7.47%], Ford Motor[6.59%], General Motors[6.44%], Citi [5.97%], Thermo Fisher[5.47%], Goldman Sachs[4.95%], United Parcel[4.27%], Philip Morris[4.15%], Netflix [4.04%] Best S&P 100 Stocks Daily:
General Electric[8.28%], Danaher [7.21%], Thermo Fisher[4.78%], General Motors[4.37%], Netflix [4.12%], Philip Morris[3.83%], NVIDIA [3.61%], Meta Platforms[2.95%], Verizon [2.85%], Citi [2.82%], American Express[2.56%]