
 Login Sign Up


| |||||
 |  | ||||

| 12Stocks.com Market Intelligence |
Best S&P 100 Stocks
| In a hurry? S&P 100 Stocks Lists: Performance Trends Table, Stock Charts
Sort S&P 100 stocks: Daily, Weekly, Year-to-Date, Market Cap & Trends. |
| 12Stocks.com S&P 100 Stocks Performances & Trends Daily | |||||||||
|
|  The overall Smart Investing & Trading Score is 44 (0-bearish to 100-bullish) which puts S&P 100 index in short term neutral trend. The Smart Investing & Trading Score from previous trading session is 58 and hence a deterioration of trend.
| ||||||||
Here are the Smart Investing & Trading Scores of the most requested S&P 100 stocks at 12Stocks.com (click stock name for detailed review):
|


| 12Stocks.com: Top Performing S&P 100 Index Stocks | ||||||||||||||||||||||||||||||||||||||||||||||||
 The top performing S&P 100 Index stocks year to date are
Now, more recently, over last week, the top performing S&P 100 Index stocks on the move are


|
||||||||||||||||||||||||||||||||||||||||||||||||
| 12Stocks.com: Investing in S&P 100 Index with Stocks | |
|
The following table helps investors and traders sort through current performance and trends (as measured by Smart Investing & Trading Score) of various
stocks in the S&P 100 Index. Quick View: Move mouse or cursor over stock symbol (ticker) to view short-term technical chart and over stock name to view long term chart. Click on  to add stock symbol to your watchlist and to add stock symbol to your watchlist and  to view watchlist. Click on any ticker or stock name for detailed market intelligence report for that stock. to view watchlist. Click on any ticker or stock name for detailed market intelligence report for that stock. |
12Stocks.com Performance of Stocks in S&P 100 Index
| Ticker | Stock Name | Watchlist | Category | Recent Price | Smart Investing & Trading Score | Change % | YTD Change% |
| UNP | Union Pacific |   | Transports | 243.55 | 70 | 4.99 | -0.84% |
| TSLA | Tesla | | Consumer Staples | 170.18 | 57 | 4.97 | -31.51% |
| NVDA | NVIDIA | | Technology | 826.32 | 56 | 3.71 | 66.86% |
| AVGO | Broadcom | | Technology | 1294.42 | 58 | 2.99 | 15.96% |
| MRK | Merck | | Health Care | 130.72 | 100 | 2.93 | 19.90% |
| INTC | Intel | | Technology | 35.11 | 42 | 1.77 | -30.13% |
| NFLX | Netflix | | Technology | 564.80 | 38 | 1.74 | 16.00% |
| BA | Boeing | | Industrials | 166.81 | 20 | 1.51 | -36.00% |
| MO | Altria | | Consumer Staples | 43.54 | 100 | 1.44 | 7.93% |
| UNH | UnitedHealth | | Health Care | 493.86 | 52 | 1.35 | -6.19% |
| GD | General Dynamics | | Industrials | 284.90 | 36 | 1.35 | 9.72% |
| AMD | Advanced Micro | | Technology | 153.76 | 32 | 1.33 | 4.31% |
| GE | General Electric | | Industrials | 161.26 | 80 | 1.30 | 26.35% |
| LMT | Lockheed Martin | | Industrials | 464.78 | 93 | 1.23 | 2.55% |
| GM | General Motors | | Consumer Staples | 45.62 | 100 | 1.20 | 27.00% |
| CVX | Chevron | | Energy | 165.28 | 100 | 1.05 | 10.81% |
| F | Ford Motor | | Consumer Staples | 13.04 | 61 | 0.69 | 6.97% |
| COP | ConocoPhillips | | Energy | 130.11 | 61 | 0.64 | 12.10% |
| SO | Southern | | Utilities | 74.37 | 100 | 0.62 | 6.06% |
| WMT | Walmart | | Services & Goods | 60.21 | 63 | 0.57 | 14.58% |
| UPS | United Parcel | | Transports | 147.39 | 85 | 0.53 | -6.26% |
| AAPL | Apple | | Technology | 169.89 | 50 | 0.51 | -11.76% |
| NEE | NextEra Energy | | Utilities | 66.90 | 100 | 0.51 | 10.14% |
| CL | Colgate-Palmolive | | Consumer Staples | 89.29 | 90 | 0.47 | 12.02% |
| KO | Coca-Cola | | Consumer Staples | 61.74 | 100 | 0.31 | 4.77% |
| For chart view version of above stock list: Chart View ➞ 0 - 25 , 25 - 50 , 50 - 75 , 75 - 100 , 100 - 125 | ||
 | Click To Change The Sort Order: By Market Cap or Company Size Performance: Year-to-date, Week and Day |  |
|
Get the most comprehensive stock market coverage daily at 12Stocks.com ➞ Best Stocks Today ➞ Best Stocks Weekly ➞ Best Stocks Year-to-Date ➞ Best Stocks Trends ➞  Best Stocks Today 12Stocks.com Best Nasdaq Stocks ➞ Best S&P 500 Stocks ➞ Best Tech Stocks ➞ Best Biotech Stocks ➞ |
| Detailed Overview of S&P 100 Stocks |
| S&P 100 Technical Overview, Leaders & Laggards, Top S&P 100 ETF Funds & Detailed S&P 100 Stocks List, Charts, Trends & More |
| S&P 100: Technical Analysis, Trends & YTD Performance | |
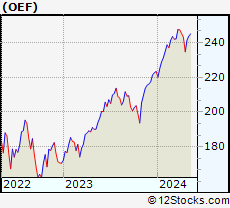
| S&P 100 index as represented by
OEF, an exchange-traded fund [ETF], holds basket of one hundred US (mostly largecap) stocks from across all major sectors of the US stock market. The S&P 100 index (contains stocks like Apple and Exxon) is up by 6.69% and is currently outperforming the overall market by 1.53% year-to-date. Below is a quick view of technical charts and trends: | |
 OEF Weekly Chart |
|
| Long Term Trend: Good | |
| Medium Term Trend: Not Good | |
 OEF Daily Chart |
|
| Short Term Trend: Very Good | |
| Overall Trend Score: 44 | |
| YTD Performance: 6.69% | |
| **Trend Scores & Views Are Only For Educational Purposes And Not For Investing | |
| 12Stocks.com: Investing in S&P 100 Index using Exchange Traded Funds | |
|
The following table shows list of key exchange traded funds (ETF) that
help investors track S&P 100 index. We have also included ETF funds that track S&P 500 index since it is market-cap weighted. The following list also includes leveraged ETF funds that track twice or thrice the daily returns of S&P 100 indices. Short or inverse ETF funds move in the opposite direction to the index they track and are useful during market pullbacks or during bear markets. Quick View: Move mouse or cursor over ETF symbol (ticker) to view short-term technical chart and over ETF name to view long term chart. Click on ticker or stock name for detailed view. Click on to add stock symbol to your watchlist and to view watchlist. |
12Stocks.com List of ETFs that track S&P 100 Index
| Ticker | ETF Name | Watchlist | Recent Price | Smart Investing & Trading Score | Change % | Week % | Year-to-date % |
| SPY | SPDR S&P 500 ETF | | 503.49 | 44 | -0.38 | 1.68 | 5.93% |
| SPXS | Direxion Daily S&P 500 Bear 3X ETF | | 9.88 | 32 | 1.33 | -4.63 | -14.46% |
| SH | ProShares Short S&P500 | | 12.39 | 57 | 0.49 | -1.59 | -4.62% |
| SDS | ProShares UltraShort S&P500 | | 27.04 | 49 | 0.90 | -3.08 | -9.63% |
| SPXU | ProShares UltraPro Short S&P500 | | 36.52 | 49 | 1.33 | -4.72 | -15.07% |
| UPRO | ProShares UltraPro S&P500 | | 62.03 | 51 | -1.35 | 4.85 | 13.32% |
| SPXL | Direxion Daily S&P500 Bull 3X ETF | | 117.84 | 56 | -1.27 | 4.7 | 13.32% |
| VOO | Vanguard 500 ETF | | 462.58 | 56 | -0.41 | 1.64 | 5.9% |
| SSO | ProShares Ultra S&P500 | | 71.32 | 51 | -0.88 | 3.2 | 9.61% |
| OEF | iShares S&P 100 | | 238.34 | 44 | -0.60 | 1.56 | 6.69% |
| 12Stocks.com: Charts, Trends, Fundamental Data and Performances of S&P 100 Stocks | |
|
We now take in-depth look at all S&P 100 stocks including charts, multi-period performances and overall trends (as measured by Smart Investing & Trading Score). One can sort S&P 100 stocks (click link to choose) by Daily, Weekly and by Year-to-Date performances. Also, one can sort by size of the company or by market capitalization. |
| Select Your Default Chart Type: | |||||
| |||||
| Click on stock symbol or name for detailed view. Click on to add stock symbol to your watchlist and to view watchlist. Quick View: Move mouse or cursor over "Daily" to quickly view daily technical stock chart and over "Weekly" to view weekly technical stock chart. | |||||

 | UNP Union Pacific Corporation |
| Sector: Transports | |
| SubSector: Railroads | |
| MarketCap: 87198.1 Millions | |
| Recent Price: 243.55 Smart Investing & Trading Score: 70 | |
| Day Percent Change: 4.99% Day Change: 11.57 | |
| Week Change: 4.94% Year-to-date Change: -0.8% | |
| UNP Links: Profile News Message Board | |
| Charts:- Daily , Weekly | |
| Add UNP to Watchlist: View: Get Complete UNP Trend Analysis ➞ | |
 | TSLA Tesla, Inc. |
| Sector: Consumer Staples | |
| SubSector: Auto Manufacturers - Major | |
| MarketCap: 89058.8 Millions | |
| Recent Price: 170.18 Smart Investing & Trading Score: 57 | |
| Day Percent Change: 4.97% Day Change: 8.05 | |
| Week Change: 15.73% Year-to-date Change: -31.5% | |
| TSLA Links: Profile News Message Board | |
| Charts:- Daily , Weekly | |
| Add TSLA to Watchlist: View: Get Complete TSLA Trend Analysis ➞ | |
 | NVDA NVIDIA Corporation |
| Sector: Technology | |
| SubSector: Semiconductor - Specialized | |
| MarketCap: 143476 Millions | |
| Recent Price: 826.32 Smart Investing & Trading Score: 56 | |
| Day Percent Change: 3.71% Day Change: 29.55 | |
| Week Change: 8.44% Year-to-date Change: 66.9% | |
| NVDA Links: Profile News Message Board | |
| Charts:- Daily , Weekly | |
| Add NVDA to Watchlist: View: Get Complete NVDA Trend Analysis ➞ | |
 | AVGO Broadcom Inc. |
| Sector: Technology | |
| SubSector: Semiconductor - Broad Line | |
| MarketCap: 86329.1 Millions | |
| Recent Price: 1294.42 Smart Investing & Trading Score: 58 | |
| Day Percent Change: 2.99% Day Change: 37.60 | |
| Week Change: 7.45% Year-to-date Change: 16.0% | |
| AVGO Links: Profile News Message Board | |
| Charts:- Daily , Weekly | |
| Add AVGO to Watchlist: View: Get Complete AVGO Trend Analysis ➞ | |
 | MRK Merck & Co., Inc. |
| Sector: Health Care | |
| SubSector: Drug Manufacturers - Major | |
| MarketCap: 192657 Millions | |
| Recent Price: 130.72 Smart Investing & Trading Score: 100 | |
| Day Percent Change: 2.93% Day Change: 3.72 | |
| Week Change: 3.93% Year-to-date Change: 19.9% | |
| MRK Links: Profile News Message Board | |
| Charts:- Daily , Weekly | |
| Add MRK to Watchlist: View: Get Complete MRK Trend Analysis ➞ | |
 | INTC Intel Corporation |
| Sector: Technology | |
| SubSector: Semiconductor - Broad Line | |
| MarketCap: 222357 Millions | |
| Recent Price: 35.11 Smart Investing & Trading Score: 42 | |
| Day Percent Change: 1.77% Day Change: 0.61 | |
| Week Change: 2.66% Year-to-date Change: -30.1% | |
| INTC Links: Profile News Message Board | |
| Charts:- Daily , Weekly | |
| Add INTC to Watchlist: View: Get Complete INTC Trend Analysis ➞ | |
 | NFLX Netflix, Inc. |
| Sector: Technology | |
| SubSector: CATV Systems | |
| MarketCap: 162108 Millions | |
| Recent Price: 564.80 Smart Investing & Trading Score: 38 | |
| Day Percent Change: 1.74% Day Change: 9.68 | |
| Week Change: 1.76% Year-to-date Change: 16.0% | |
| NFLX Links: Profile News Message Board | |
| Charts:- Daily , Weekly | |
| Add NFLX to Watchlist: View: Get Complete NFLX Trend Analysis ➞ | |
 | BA The Boeing Company |
| Sector: Industrials | |
| SubSector: Aerospace/Defense Products & Services | |
| MarketCap: 65336.4 Millions | |
| Recent Price: 166.81 Smart Investing & Trading Score: 20 | |
| Day Percent Change: 1.51% Day Change: 2.48 | |
| Week Change: -1.77% Year-to-date Change: -36.0% | |
| BA Links: Profile News Message Board | |
| Charts:- Daily , Weekly | |
| Add BA to Watchlist: View: Get Complete BA Trend Analysis ➞ | |
 | MO Altria Group, Inc. |
| Sector: Consumer Staples | |
| SubSector: Cigarettes | |
| MarketCap: 70806.3 Millions | |
| Recent Price: 43.54 Smart Investing & Trading Score: 100 | |
| Day Percent Change: 1.44% Day Change: 0.62 | |
| Week Change: 3.44% Year-to-date Change: 7.9% | |
| MO Links: Profile News Message Board | |
| Charts:- Daily , Weekly | |
| Add MO to Watchlist: View: Get Complete MO Trend Analysis ➞ | |
 | UNH UnitedHealth Group Incorporated |
| Sector: Health Care | |
| SubSector: Health Care Plans | |
| MarketCap: 217384 Millions | |
| Recent Price: 493.86 Smart Investing & Trading Score: 52 | |
| Day Percent Change: 1.35% Day Change: 6.56 | |
| Week Change: -1.45% Year-to-date Change: -6.2% | |
| UNH Links: Profile News Message Board | |
| Charts:- Daily , Weekly | |
| Add UNH to Watchlist: View: Get Complete UNH Trend Analysis ➞ | |
 | GD General Dynamics Corporation |
| Sector: Industrials | |
| SubSector: Aerospace/Defense Products & Services | |
| MarketCap: 37063.8 Millions | |
| Recent Price: 284.90 Smart Investing & Trading Score: 36 | |
| Day Percent Change: 1.35% Day Change: 3.79 | |
| Week Change: -1.29% Year-to-date Change: 9.7% | |
| GD Links: Profile News Message Board | |
| Charts:- Daily , Weekly | |
| Add GD to Watchlist: View: Get Complete GD Trend Analysis ➞ | |
 | AMD Advanced Micro Devices, Inc. |
| Sector: Technology | |
| SubSector: Semiconductor - Broad Line | |
| MarketCap: 54275.1 Millions | |
| Recent Price: 153.76 Smart Investing & Trading Score: 32 | |
| Day Percent Change: 1.33% Day Change: 2.02 | |
| Week Change: 4.86% Year-to-date Change: 4.3% | |
| AMD Links: Profile News Message Board | |
| Charts:- Daily , Weekly | |
| Add AMD to Watchlist: View: Get Complete AMD Trend Analysis ➞ | |
 | GE General Electric Company |
| Sector: Industrials | |
| SubSector: Diversified Machinery | |
| MarketCap: 64710.6 Millions | |
| Recent Price: 161.26 Smart Investing & Trading Score: 80 | |
| Day Percent Change: 1.30% Day Change: 2.07 | |
| Week Change: 8.92% Year-to-date Change: 26.4% | |
| GE Links: Profile News Message Board | |
| Charts:- Daily , Weekly | |
| Add GE to Watchlist: View: Get Complete GE Trend Analysis ➞ | |
 | LMT Lockheed Martin Corporation |
| Sector: Industrials | |
| SubSector: Aerospace/Defense Products & Services | |
| MarketCap: 94116.4 Millions | |
| Recent Price: 464.78 Smart Investing & Trading Score: 93 | |
| Day Percent Change: 1.23% Day Change: 5.64 | |
| Week Change: 0.2% Year-to-date Change: 2.6% | |
| LMT Links: Profile News Message Board | |
| Charts:- Daily , Weekly | |
| Add LMT to Watchlist: View: Get Complete LMT Trend Analysis ➞ | |
 | GM General Motors Company |
| Sector: Consumer Staples | |
| SubSector: Auto Manufacturers - Major | |
| MarketCap: 29252.4 Millions | |
| Recent Price: 45.62 Smart Investing & Trading Score: 100 | |
| Day Percent Change: 1.20% Day Change: 0.54 | |
| Week Change: 7.67% Year-to-date Change: 27.0% | |
| GM Links: Profile News Message Board | |
| Charts:- Daily , Weekly | |
| Add GM to Watchlist: View: Get Complete GM Trend Analysis ➞ | |
 | CVX Chevron Corporation |
| Sector: Energy | |
| SubSector: Major Integrated Oil & Gas | |
| MarketCap: 121521 Millions | |
| Recent Price: 165.28 Smart Investing & Trading Score: 100 | |
| Day Percent Change: 1.05% Day Change: 1.71 | |
| Week Change: 3.3% Year-to-date Change: 10.8% | |
| CVX Links: Profile News Message Board | |
| Charts:- Daily , Weekly | |
| Add CVX to Watchlist: View: Get Complete CVX Trend Analysis ➞ | |
 | F Ford Motor Company |
| Sector: Consumer Staples | |
| SubSector: Auto Manufacturers - Major | |
| MarketCap: 19052.1 Millions | |
| Recent Price: 13.04 Smart Investing & Trading Score: 61 | |
| Day Percent Change: 0.69% Day Change: 0.09 | |
| Week Change: 7.41% Year-to-date Change: 7.0% | |
| F Links: Profile News Message Board | |
| Charts:- Daily , Weekly | |
| Add F to Watchlist: View: Get Complete F Trend Analysis ➞ | |
 | COP ConocoPhillips |
| Sector: Energy | |
| SubSector: Independent Oil & Gas | |
| MarketCap: 33504.3 Millions | |
| Recent Price: 130.11 Smart Investing & Trading Score: 61 | |
| Day Percent Change: 0.64% Day Change: 0.83 | |
| Week Change: 0.56% Year-to-date Change: 12.1% | |
| COP Links: Profile News Message Board | |
| Charts:- Daily , Weekly | |
| Add COP to Watchlist: View: Get Complete COP Trend Analysis ➞ | |
 | SO The Southern Company |
| Sector: Utilities | |
| SubSector: Electric Utilities | |
| MarketCap: 54483.6 Millions | |
| Recent Price: 74.37 Smart Investing & Trading Score: 100 | |
| Day Percent Change: 0.62% Day Change: 0.46 | |
| Week Change: 3.08% Year-to-date Change: 6.1% | |
| SO Links: Profile News Message Board | |
| Charts:- Daily , Weekly | |
| Add SO to Watchlist: View: Get Complete SO Trend Analysis ➞ | |
 | WMT Walmart Inc. |
| Sector: Services & Goods | |
| SubSector: Discount, Variety Stores | |
| MarketCap: 355610 Millions | |
| Recent Price: 60.21 Smart Investing & Trading Score: 63 | |
| Day Percent Change: 0.57% Day Change: 0.34 | |
| Week Change: 1.14% Year-to-date Change: 14.6% | |
| WMT Links: Profile News Message Board | |
| Charts:- Daily , Weekly | |
| Add WMT to Watchlist: View: Get Complete WMT Trend Analysis ➞ | |
 | UPS United Parcel Service, Inc. |
| Sector: Transports | |
| SubSector: Air Delivery & Freight Services | |
| MarketCap: 81928.9 Millions | |
| Recent Price: 147.39 Smart Investing & Trading Score: 85 | |
| Day Percent Change: 0.53% Day Change: 0.77 | |
| Week Change: 3.24% Year-to-date Change: -6.3% | |
| UPS Links: Profile News Message Board | |
| Charts:- Daily , Weekly | |
| Add UPS to Watchlist: View: Get Complete UPS Trend Analysis ➞ | |
 | AAPL Apple Inc. |
| Sector: Technology | |
| SubSector: Electronic Equipment | |
| MarketCap: 1112940 Millions | |
| Recent Price: 169.89 Smart Investing & Trading Score: 50 | |
| Day Percent Change: 0.51% Day Change: 0.87 | |
| Week Change: 2.96% Year-to-date Change: -11.8% | |
| AAPL Links: Profile News Message Board | |
| Charts:- Daily , Weekly | |
| Add AAPL to Watchlist: View: Get Complete AAPL Trend Analysis ➞ | |
 | NEE NextEra Energy, Inc. |
| Sector: Utilities | |
| SubSector: Electric Utilities | |
| MarketCap: 108288 Millions | |
| Recent Price: 66.90 Smart Investing & Trading Score: 100 | |
| Day Percent Change: 0.51% Day Change: 0.34 | |
| Week Change: 4.04% Year-to-date Change: 10.1% | |
| NEE Links: Profile News Message Board | |
| Charts:- Daily , Weekly | |
| Add NEE to Watchlist: View: Get Complete NEE Trend Analysis ➞ | |
 | CL Colgate-Palmolive Company |
| Sector: Consumer Staples | |
| SubSector: Personal Products | |
| MarketCap: 57242.7 Millions | |
| Recent Price: 89.29 Smart Investing & Trading Score: 90 | |
| Day Percent Change: 0.47% Day Change: 0.42 | |
| Week Change: 2.48% Year-to-date Change: 12.0% | |
| CL Links: Profile News Message Board | |
| Charts:- Daily , Weekly | |
| Add CL to Watchlist: View: Get Complete CL Trend Analysis ➞ | |
 | KO The Coca-Cola Company |
| Sector: Consumer Staples | |
| SubSector: Beverages - Soft Drinks | |
| MarketCap: 182046 Millions | |
| Recent Price: 61.74 Smart Investing & Trading Score: 100 | |
| Day Percent Change: 0.31% Day Change: 0.19 | |
| Week Change: 2.61% Year-to-date Change: 4.8% | |
| KO Links: Profile News Message Board | |
| Charts:- Daily , Weekly | |
| Add KO to Watchlist: View: Get Complete KO Trend Analysis ➞ | |
| For tabular summary view of above stock list: Summary View ➞ 0 - 25 , 25 - 50 , 50 - 75 , 75 - 100 , 100 - 125 | ||
| Click To Change The Sort Order: By Market Cap or Company Size Performance: Year-to-date, Week and Day | |
| Select Chart Type: | ||
|
Best Stocks Today 12Stocks.com |
� 2024 12Stocks.com Terms & Conditions Privacy Contact Us
All Information Provided Only For Education And Not To Be Used For Investing or Trading. See Terms & Conditions


One More Thing ... Get Best Stocks Delivered Daily!
Never Ever Miss A Move With Our Top Ten Stocks Lists
Find Best Stocks In Any Market - Bull or Bear Market
Take A Peek At Our Top Ten Stocks Lists: Daily, Weekly, Year-to-Date & Top Trends
Find Best Stocks In Any Market - Bull or Bear Market
Take A Peek At Our Top Ten Stocks Lists: Daily, Weekly, Year-to-Date & Top Trends
S&P 100 Stocks With Best Up Trends [0-bearish to 100-bullish]: Merck [100], Altria [100], General Motors[100], Chevron [100], Southern [100], NextEra Energy[100], Coca-Cola [100], Duke Energy[100], Procter & Gamble[100], T-Mobile US[100], Kraft Heinz[100]
Best S&P 100 Stocks Year-to-Date:
NVIDIA [66.86%], General Motors[27%], American Express[26.56%], General Electric[26.35%], Walt Disney[24.9%], Eli Lilly[24.35%], Meta Platforms[22.36%], Wells Fargo[21.76%], Exxon Mobil[21.35%], Citi [20.12%], Merck [19.9%] Best S&P 100 Stocks This Week:
Tesla [15.73%], Texas Instruments[9.75%], General Electric[8.92%], NVIDIA [8.44%], General Motors[7.67%], Broadcom [7.45%], Ford Motor[7.41%], Thermo Fisher[4.95%], Union Pacific[4.94%], Advanced Micro[4.86%], Citi [4.48%] Best S&P 100 Stocks Daily:
Union Pacific[4.99%], Tesla [4.97%], NVIDIA [3.71%], Broadcom [2.99%], Merck [2.93%], Intel [1.77%], Netflix [1.74%], Boeing [1.51%], Altria [1.44%], UnitedHealth [1.35%], General Dynamics[1.35%]