
 Login Sign Up


| |||||
 |  | ||||

| 12Stocks.com Market Intelligence |
Best S&P 100 Stocks
| In a hurry? S&P 100 Stocks Lists: Performance Trends Table, Stock Charts
Sort S&P 100 stocks: Daily, Weekly, Year-to-Date, Market Cap & Trends. |
| 12Stocks.com S&P 100 Stocks Performances & Trends Daily | |||||||||
|
|  The overall Smart Investing & Trading Score is 63 (0-bearish to 100-bullish) which puts S&P 100 index in short term neutral to bullish trend. The Smart Investing & Trading Score from previous trading session is 44 and hence an improvement of trend.
| ||||||||
Here are the Smart Investing & Trading Scores of the most requested S&P 100 stocks at 12Stocks.com (click stock name for detailed review):
|


| 12Stocks.com: Top Performing S&P 100 Index Stocks | ||||||||||||||||||||||||||||||||||||||||||||||||
 The top performing S&P 100 Index stocks year to date are
Now, more recently, over last week, the top performing S&P 100 Index stocks on the move are


|
||||||||||||||||||||||||||||||||||||||||||||||||
| 12Stocks.com: Investing in S&P 100 Index with Stocks | |
|
The following table helps investors and traders sort through current performance and trends (as measured by Smart Investing & Trading Score) of various
stocks in the S&P 100 Index. Quick View: Move mouse or cursor over stock symbol (ticker) to view short-term technical chart and over stock name to view long term chart. Click on  to add stock symbol to your watchlist and to add stock symbol to your watchlist and  to view watchlist. Click on any ticker or stock name for detailed market intelligence report for that stock. to view watchlist. Click on any ticker or stock name for detailed market intelligence report for that stock. |
12Stocks.com Performance of Stocks in S&P 100 Index
| Ticker | Stock Name | Watchlist | Category | Recent Price | Smart Investing & Trading Score | Change % | YTD Change% |
| ADBE | Adobe |   | Technology | 477.56 | 42 | 0.87 | -19.95% |
| BLK | BlackRock | | Financials | 762.88 | 25 | 0.69 | -6.03% |
| GE | General Electric | | Industrials | 162.35 | 78 | 0.68 | 27.20% |
| ABT | Abbott | | Health Care | 107.53 | 25 | 0.63 | -2.31% |
| MDT | Medtronic | | Health Care | 79.74 | 10 | 0.62 | -3.20% |
| PFE | Pfizer | | Health Care | 25.40 | 17 | 0.55 | -11.77% |
| BKNG | Booking | | Services & Goods | 3521.08 | 48 | 0.53 | -0.74% |
| GM | General Motors | | Consumer Staples | 45.84 | 100 | 0.48 | 27.62% |
| SBUX | Starbucks | | Services & Goods | 88.25 | 45 | 0.47 | -8.08% |
| MMM | 3M | | Industrials | 91.83 | 39 | 0.46 | -16.00% |
| CRM | salesforce.com | | Technology | 274.29 | 25 | 0.42 | 4.24% |
| CVX | Chevron | | Energy | 165.89 | 100 | 0.37 | 11.22% |
| MRK | Merck | | Health Care | 131.20 | 100 | 0.37 | 20.34% |
| BMY | Bristol-Myers | | Health Care | 44.85 | 10 | 0.34 | -12.59% |
| TMO | Thermo Fisher | | Health Care | 573.60 | 61 | 0.33 | 8.07% |
| USB | U.S. Bancorp | | Financials | 41.12 | 30 | 0.32 | -4.99% |
| DHR | Danaher | | Industrials | 246.58 | 73 | 0.32 | 6.59% |
| UNH | UnitedHealth | | Health Care | 495.35 | 59 | 0.30 | -5.91% |
| MS | Morgan Stanley | | Financials | 92.83 | 66 | 0.29 | -0.45% |
| EMR | Emerson Electric | | Industrials | 109.89 | 61 | 0.26 | 12.90% |
| BA | Boeing | | Industrials | 167.22 | 35 | 0.25 | -35.85% |
| BK | Bank of New York | | Financials | 57.32 | 83 | 0.24 | 10.12% |
| GILD | Gilead Sciences | | Health Care | 65.42 | 0 | 0.23 | -19.24% |
| AMGN | Amgen | | Health Care | 269.98 | 25 | 0.22 | -6.26% |
| HON | Honeywell | | Industrials | 193.45 | 17 | 0.22 | -7.75% |
| For chart view version of above stock list: Chart View ➞ 0 - 25 , 25 - 50 , 50 - 75 , 75 - 100 , 100 - 125 | ||
 | Click To Change The Sort Order: By Market Cap or Company Size Performance: Year-to-date, Week and Day |  |
|
Get the most comprehensive stock market coverage daily at 12Stocks.com ➞ Best Stocks Today ➞ Best Stocks Weekly ➞ Best Stocks Year-to-Date ➞ Best Stocks Trends ➞  Best Stocks Today 12Stocks.com Best Nasdaq Stocks ➞ Best S&P 500 Stocks ➞ Best Tech Stocks ➞ Best Biotech Stocks ➞ |
| Detailed Overview of S&P 100 Stocks |
| S&P 100 Technical Overview, Leaders & Laggards, Top S&P 100 ETF Funds & Detailed S&P 100 Stocks List, Charts, Trends & More |
| S&P 100: Technical Analysis, Trends & YTD Performance | |
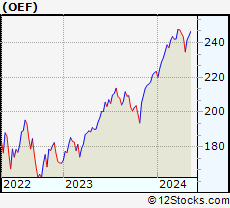
| S&P 100 index as represented by
OEF, an exchange-traded fund [ETF], holds basket of one hundred US (mostly largecap) stocks from across all major sectors of the US stock market. The S&P 100 index (contains stocks like Apple and Exxon) is up by 8.13% and is currently outperforming the overall market by 1.99% year-to-date. Below is a quick view of technical charts and trends: | |
 OEF Weekly Chart |
|
| Long Term Trend: Good | |
| Medium Term Trend: Not Good | |
 OEF Daily Chart |
|
| Short Term Trend: Very Good | |
| Overall Trend Score: 63 | |
| YTD Performance: 8.13% | |
| **Trend Scores & Views Are Only For Educational Purposes And Not For Investing | |
| 12Stocks.com: Investing in S&P 100 Index using Exchange Traded Funds | |
|
The following table shows list of key exchange traded funds (ETF) that
help investors track S&P 100 index. We have also included ETF funds that track S&P 500 index since it is market-cap weighted. The following list also includes leveraged ETF funds that track twice or thrice the daily returns of S&P 100 indices. Short or inverse ETF funds move in the opposite direction to the index they track and are useful during market pullbacks or during bear markets. Quick View: Move mouse or cursor over ETF symbol (ticker) to view short-term technical chart and over ETF name to view long term chart. Click on ticker or stock name for detailed view. Click on to add stock symbol to your watchlist and to view watchlist. |
12Stocks.com List of ETFs that track S&P 100 Index
| Ticker | ETF Name | Watchlist | Recent Price | Smart Investing & Trading Score | Change % | Week % | Year-to-date % |
| SPY | SPDR S&P 500 ETF | | 508.26 | 63 | 0.95 | 2.65 | 6.93% |
| SPXS | Direxion Daily S&P 500 Bear 3X ETF | | 9.61 | 25 | -2.73 | -7.24 | -16.8% |
| SH | ProShares Short S&P500 | | 12.28 | 42 | -0.89 | -2.46 | -5.47% |
| SDS | ProShares UltraShort S&P500 | | 26.53 | 32 | -1.89 | -4.91 | -11.33% |
| SSO | ProShares Ultra S&P500 | | 72.71 | 63 | 1.95 | 5.21 | 11.74% |
| SPXL | Direxion Daily S&P500 Bull 3X ETF | | 121.14 | 63 | 2.80 | 7.63 | 16.49% |
| SPXU | ProShares UltraPro Short S&P500 | | 35.50 | 42 | -2.79 | -7.38 | -17.44% |
| UPRO | ProShares UltraPro S&P500 | | 63.82 | 63 | 2.89 | 7.88 | 16.59% |
| VOO | Vanguard 500 ETF | | 467.21 | 63 | 1.00 | 2.66 | 6.96% |
| OEF | iShares S&P 100 | | 241.56 | 63 | 1.35 | 2.93 | 8.13% |
| 12Stocks.com: Charts, Trends, Fundamental Data and Performances of S&P 100 Stocks | |
|
We now take in-depth look at all S&P 100 stocks including charts, multi-period performances and overall trends (as measured by Smart Investing & Trading Score). One can sort S&P 100 stocks (click link to choose) by Daily, Weekly and by Year-to-Date performances. Also, one can sort by size of the company or by market capitalization. |
| Select Your Default Chart Type: | |||||
| |||||
| Click on stock symbol or name for detailed view. Click on to add stock symbol to your watchlist and to view watchlist. Quick View: Move mouse or cursor over "Daily" to quickly view daily technical stock chart and over "Weekly" to view weekly technical stock chart. | |||||

 | ADBE Adobe Inc. |
| Sector: Technology | |
| SubSector: Application Software | |
| MarketCap: 157868 Millions | |
| Recent Price: 477.56 Smart Investing & Trading Score: 42 | |
| Day Percent Change: 0.87% Day Change: 4.12 | |
| Week Change: 2.7% Year-to-date Change: -20.0% | |
| ADBE Links: Profile News Message Board | |
| Charts:- Daily , Weekly | |
| Add ADBE to Watchlist: View: Get Complete ADBE Trend Analysis ➞ | |
 | BLK BlackRock, Inc. |
| Sector: Financials | |
| SubSector: Asset Management | |
| MarketCap: 61284.9 Millions | |
| Recent Price: 762.88 Smart Investing & Trading Score: 25 | |
| Day Percent Change: 0.69% Day Change: 5.23 | |
| Week Change: 1.72% Year-to-date Change: -6.0% | |
| BLK Links: Profile News Message Board | |
| Charts:- Daily , Weekly | |
| Add BLK to Watchlist: View: Get Complete BLK Trend Analysis ➞ | |
 | GE General Electric Company |
| Sector: Industrials | |
| SubSector: Diversified Machinery | |
| MarketCap: 64710.6 Millions | |
| Recent Price: 162.35 Smart Investing & Trading Score: 78 | |
| Day Percent Change: 0.68% Day Change: 1.09 | |
| Week Change: 9.65% Year-to-date Change: 27.2% | |
| GE Links: Profile News Message Board | |
| Charts:- Daily , Weekly | |
| Add GE to Watchlist: View: Get Complete GE Trend Analysis ➞ | |
 | ABT Abbott Laboratories |
| Sector: Health Care | |
| SubSector: Medical Appliances & Equipment | |
| MarketCap: 125288 Millions | |
| Recent Price: 107.53 Smart Investing & Trading Score: 25 | |
| Day Percent Change: 0.63% Day Change: 0.67 | |
| Week Change: 0.23% Year-to-date Change: -2.3% | |
| ABT Links: Profile News Message Board | |
| Charts:- Daily , Weekly | |
| Add ABT to Watchlist: View: Get Complete ABT Trend Analysis ➞ | |
 | MDT Medtronic plc |
| Sector: Health Care | |
| SubSector: Medical Appliances & Equipment | |
| MarketCap: 113698 Millions | |
| Recent Price: 79.74 Smart Investing & Trading Score: 10 | |
| Day Percent Change: 0.62% Day Change: 0.49 | |
| Week Change: 0.33% Year-to-date Change: -3.2% | |
| MDT Links: Profile News Message Board | |
| Charts:- Daily , Weekly | |
| Add MDT to Watchlist: View: Get Complete MDT Trend Analysis ➞ | |
 | PFE Pfizer Inc. |
| Sector: Health Care | |
| SubSector: Drug Manufacturers - Major | |
| MarketCap: 172467 Millions | |
| Recent Price: 25.40 Smart Investing & Trading Score: 17 | |
| Day Percent Change: 0.55% Day Change: 0.14 | |
| Week Change: -2.31% Year-to-date Change: -11.8% | |
| PFE Links: Profile News Message Board | |
| Charts:- Daily , Weekly | |
| Add PFE to Watchlist: View: Get Complete PFE Trend Analysis ➞ | |
 | BKNG Booking Holdings Inc. |
| Sector: Services & Goods | |
| SubSector: Business Services | |
| MarketCap: 54467.9 Millions | |
| Recent Price: 3521.08 Smart Investing & Trading Score: 48 | |
| Day Percent Change: 0.53% Day Change: 18.60 | |
| Week Change: 3.11% Year-to-date Change: -0.7% | |
| BKNG Links: Profile News Message Board | |
| Charts:- Daily , Weekly | |
| Add BKNG to Watchlist: View: Get Complete BKNG Trend Analysis ➞ | |
 | GM General Motors Company |
| Sector: Consumer Staples | |
| SubSector: Auto Manufacturers - Major | |
| MarketCap: 29252.4 Millions | |
| Recent Price: 45.84 Smart Investing & Trading Score: 100 | |
| Day Percent Change: 0.48% Day Change: 0.22 | |
| Week Change: 8.19% Year-to-date Change: 27.6% | |
| GM Links: Profile News Message Board | |
| Charts:- Daily , Weekly | |
| Add GM to Watchlist: View: Get Complete GM Trend Analysis ➞ | |
 | SBUX Starbucks Corporation |
| Sector: Services & Goods | |
| SubSector: Specialty Eateries | |
| MarketCap: 74909.7 Millions | |
| Recent Price: 88.25 Smart Investing & Trading Score: 45 | |
| Day Percent Change: 0.47% Day Change: 0.41 | |
| Week Change: 0.73% Year-to-date Change: -8.1% | |
| SBUX Links: Profile News Message Board | |
| Charts:- Daily , Weekly | |
| Add SBUX to Watchlist: View: Get Complete SBUX Trend Analysis ➞ | |
 | MMM 3M Company |
| Sector: Industrials | |
| SubSector: Diversified Machinery | |
| MarketCap: 79237.7 Millions | |
| Recent Price: 91.83 Smart Investing & Trading Score: 39 | |
| Day Percent Change: 0.46% Day Change: 0.42 | |
| Week Change: -0.48% Year-to-date Change: -16.0% | |
| MMM Links: Profile News Message Board | |
| Charts:- Daily , Weekly | |
| Add MMM to Watchlist: View: Get Complete MMM Trend Analysis ➞ | |
 | CRM salesforce.com, inc. |
| Sector: Technology | |
| SubSector: Application Software | |
| MarketCap: 137120 Millions | |
| Recent Price: 274.29 Smart Investing & Trading Score: 25 | |
| Day Percent Change: 0.42% Day Change: 1.15 | |
| Week Change: 1.45% Year-to-date Change: 4.2% | |
| CRM Links: Profile News Message Board | |
| Charts:- Daily , Weekly | |
| Add CRM to Watchlist: View: Get Complete CRM Trend Analysis ➞ | |
 | CVX Chevron Corporation |
| Sector: Energy | |
| SubSector: Major Integrated Oil & Gas | |
| MarketCap: 121521 Millions | |
| Recent Price: 165.89 Smart Investing & Trading Score: 100 | |
| Day Percent Change: 0.37% Day Change: 0.61 | |
| Week Change: 3.68% Year-to-date Change: 11.2% | |
| CVX Links: Profile News Message Board | |
| Charts:- Daily , Weekly | |
| Add CVX to Watchlist: View: Get Complete CVX Trend Analysis ➞ | |
 | MRK Merck & Co., Inc. |
| Sector: Health Care | |
| SubSector: Drug Manufacturers - Major | |
| MarketCap: 192657 Millions | |
| Recent Price: 131.20 Smart Investing & Trading Score: 100 | |
| Day Percent Change: 0.37% Day Change: 0.48 | |
| Week Change: 4.31% Year-to-date Change: 20.3% | |
| MRK Links: Profile News Message Board | |
| Charts:- Daily , Weekly | |
| Add MRK to Watchlist: View: Get Complete MRK Trend Analysis ➞ | |
 | BMY Bristol-Myers Squibb Company |
| Sector: Health Care | |
| SubSector: Drug Manufacturers - Major | |
| MarketCap: 117052 Millions | |
| Recent Price: 44.85 Smart Investing & Trading Score: 10 | |
| Day Percent Change: 0.34% Day Change: 0.15 | |
| Week Change: -8.34% Year-to-date Change: -12.6% | |
| BMY Links: Profile News Message Board | |
| Charts:- Daily , Weekly | |
| Add BMY to Watchlist: View: Get Complete BMY Trend Analysis ➞ | |
 | TMO Thermo Fisher Scientific Inc. |
| Sector: Health Care | |
| SubSector: Medical Laboratories & Research | |
| MarketCap: 112999 Millions | |
| Recent Price: 573.60 Smart Investing & Trading Score: 61 | |
| Day Percent Change: 0.33% Day Change: 1.87 | |
| Week Change: 5.29% Year-to-date Change: 8.1% | |
| TMO Links: Profile News Message Board | |
| Charts:- Daily , Weekly | |
| Add TMO to Watchlist: View: Get Complete TMO Trend Analysis ➞ | |
 | USB U.S. Bancorp |
| Sector: Financials | |
| SubSector: Regional - Midwest Banks | |
| MarketCap: 56757.8 Millions | |
| Recent Price: 41.12 Smart Investing & Trading Score: 30 | |
| Day Percent Change: 0.32% Day Change: 0.13 | |
| Week Change: 1.66% Year-to-date Change: -5.0% | |
| USB Links: Profile News Message Board | |
| Charts:- Daily , Weekly | |
| Add USB to Watchlist: View: Get Complete USB Trend Analysis ➞ | |
 | DHR Danaher Corporation |
| Sector: Industrials | |
| SubSector: Diversified Machinery | |
| MarketCap: 93210.3 Millions | |
| Recent Price: 246.58 Smart Investing & Trading Score: 73 | |
| Day Percent Change: 0.32% Day Change: 0.78 | |
| Week Change: 4.7% Year-to-date Change: 6.6% | |
| DHR Links: Profile News Message Board | |
| Charts:- Daily , Weekly | |
| Add DHR to Watchlist: View: Get Complete DHR Trend Analysis ➞ | |
 | UNH UnitedHealth Group Incorporated |
| Sector: Health Care | |
| SubSector: Health Care Plans | |
| MarketCap: 217384 Millions | |
| Recent Price: 495.35 Smart Investing & Trading Score: 59 | |
| Day Percent Change: 0.30% Day Change: 1.49 | |
| Week Change: -1.15% Year-to-date Change: -5.9% | |
| UNH Links: Profile News Message Board | |
| Charts:- Daily , Weekly | |
| Add UNH to Watchlist: View: Get Complete UNH Trend Analysis ➞ | |
 | MS Morgan Stanley |
| Sector: Financials | |
| SubSector: Investment Brokerage - National | |
| MarketCap: 55876.7 Millions | |
| Recent Price: 92.83 Smart Investing & Trading Score: 66 | |
| Day Percent Change: 0.29% Day Change: 0.27 | |
| Week Change: 2.39% Year-to-date Change: -0.5% | |
| MS Links: Profile News Message Board | |
| Charts:- Daily , Weekly | |
| Add MS to Watchlist: View: Get Complete MS Trend Analysis ➞ | |
 | EMR Emerson Electric Co. |
| Sector: Industrials | |
| SubSector: Industrial Electrical Equipment | |
| MarketCap: 30457.9 Millions | |
| Recent Price: 109.89 Smart Investing & Trading Score: 61 | |
| Day Percent Change: 0.26% Day Change: 0.29 | |
| Week Change: 1.21% Year-to-date Change: 12.9% | |
| EMR Links: Profile News Message Board | |
| Charts:- Daily , Weekly | |
| Add EMR to Watchlist: View: Get Complete EMR Trend Analysis ➞ | |
 | BA The Boeing Company |
| Sector: Industrials | |
| SubSector: Aerospace/Defense Products & Services | |
| MarketCap: 65336.4 Millions | |
| Recent Price: 167.22 Smart Investing & Trading Score: 35 | |
| Day Percent Change: 0.25% Day Change: 0.41 | |
| Week Change: -1.53% Year-to-date Change: -35.9% | |
| BA Links: Profile News Message Board | |
| Charts:- Daily , Weekly | |
| Add BA to Watchlist: View: Get Complete BA Trend Analysis ➞ | |
 | BK The Bank of New York Mellon Corporation |
| Sector: Financials | |
| SubSector: Asset Management | |
| MarketCap: 29807.5 Millions | |
| Recent Price: 57.32 Smart Investing & Trading Score: 83 | |
| Day Percent Change: 0.24% Day Change: 0.14 | |
| Week Change: 1.83% Year-to-date Change: 10.1% | |
| BK Links: Profile News Message Board | |
| Charts:- Daily , Weekly | |
| Add BK to Watchlist: View: Get Complete BK Trend Analysis ➞ | |
 | GILD Gilead Sciences, Inc. |
| Sector: Health Care | |
| SubSector: Biotechnology | |
| MarketCap: 99485.6 Millions | |
| Recent Price: 65.42 Smart Investing & Trading Score: 0 | |
| Day Percent Change: 0.23% Day Change: 0.15 | |
| Week Change: -2.01% Year-to-date Change: -19.2% | |
| GILD Links: Profile News Message Board | |
| Charts:- Daily , Weekly | |
| Add GILD to Watchlist: View: Get Complete GILD Trend Analysis ➞ | |
 | AMGN Amgen Inc. |
| Sector: Health Care | |
| SubSector: Biotechnology | |
| MarketCap: 121030 Millions | |
| Recent Price: 269.98 Smart Investing & Trading Score: 25 | |
| Day Percent Change: 0.22% Day Change: 0.60 | |
| Week Change: 0.39% Year-to-date Change: -6.3% | |
| AMGN Links: Profile News Message Board | |
| Charts:- Daily , Weekly | |
| Add AMGN to Watchlist: View: Get Complete AMGN Trend Analysis ➞ | |
 | HON Honeywell International Inc. |
| Sector: Industrials | |
| SubSector: Diversified Machinery | |
| MarketCap: 91189.1 Millions | |
| Recent Price: 193.45 Smart Investing & Trading Score: 17 | |
| Day Percent Change: 0.22% Day Change: 0.43 | |
| Week Change: -0.42% Year-to-date Change: -7.8% | |
| HON Links: Profile News Message Board | |
| Charts:- Daily , Weekly | |
| Add HON to Watchlist: View: Get Complete HON Trend Analysis ➞ | |
| For tabular summary view of above stock list: Summary View ➞ 0 - 25 , 25 - 50 , 50 - 75 , 75 - 100 , 100 - 125 | ||
| Click To Change The Sort Order: By Market Cap or Company Size Performance: Year-to-date, Week and Day | |
| Select Chart Type: | ||
|
Best Stocks Today 12Stocks.com |
� 2024 12Stocks.com Terms & Conditions Privacy Contact Us
All Information Provided Only For Education And Not To Be Used For Investing or Trading. See Terms & Conditions


One More Thing ... Get Best Stocks Delivered Daily!
Never Ever Miss A Move With Our Top Ten Stocks Lists
Find Best Stocks In Any Market - Bull or Bear Market
Take A Peek At Our Top Ten Stocks Lists: Daily, Weekly, Year-to-Date & Top Trends
Find Best Stocks In Any Market - Bull or Bear Market
Take A Peek At Our Top Ten Stocks Lists: Daily, Weekly, Year-to-Date & Top Trends
S&P 100 Stocks With Best Up Trends [0-bearish to 100-bullish]: Google [100], Google [100], Colgate-Palmolive [100], Goldman Sachs[100], Texas Instruments[100], General Motors[100], Chevron [100], Merck [100], Altria [100], Costco Wholesale[95], Coca-Cola [93]
Best S&P 100 Stocks Year-to-Date:
NVIDIA [77.16%], General Motors[27.62%], General Electric[27.2%], Eli Lilly[25.83%], American Express[25.78%], Meta Platforms[25.47%], Walt Disney[24.85%], Google [23.25%], Google [23.09%], Citi [21.81%], Wells Fargo[21.72%] Best S&P 100 Stocks This Week:
NVIDIA [15.14%], Tesla [14.44%], Google [11.59%], Broadcom [11.57%], Google [11.54%], Texas Instruments[11.15%], General Electric[9.65%], General Motors[8.19%], Advanced Micro[7.34%], Citi [5.95%], PayPal [5.86%] Best S&P 100 Stocks Daily:
Google [10.22%], Google [9.97%], NVIDIA [6.18%], Broadcom [3.84%], Amazon.com [3.43%], PayPal [2.90%], Meta Platforms[2.54%], Advanced Micro[2.37%], Oracle [2.02%], Colgate-Palmolive [1.93%], Comcast [1.85%]