
 Login Sign Up


| |||||
 |  | ||||

| 12Stocks.com Market Intelligence |
Best S&P 100 Stocks
| In a hurry? S&P 100 Stocks Lists: Performance Trends Table, Stock Charts
Sort S&P 100 stocks: Daily, Weekly, Year-to-Date, Market Cap & Trends. |
| 12Stocks.com S&P 100 Stocks Performances & Trends Daily | |||||||||
|
|  The overall Smart Investing & Trading Score is 7 (0-bearish to 100-bullish) which puts S&P 100 index in short term bearish trend. The Smart Investing & Trading Score from previous trading session is 41 and hence a deterioration of trend.
| ||||||||
Here are the Smart Investing & Trading Scores of the most requested S&P 100 stocks at 12Stocks.com (click stock name for detailed review):
|


| 12Stocks.com: Top Performing S&P 100 Index Stocks | ||||||||||||||||||||||||||||||||||||||||||||||||
 The top performing S&P 100 Index stocks year to date are
Now, more recently, over last week, the top performing S&P 100 Index stocks on the move are


|
||||||||||||||||||||||||||||||||||||||||||||||||
| 12Stocks.com: Investing in S&P 100 Index with Stocks | |
|
The following table helps investors and traders sort through current performance and trends (as measured by Smart Investing & Trading Score) of various
stocks in the S&P 100 Index. Quick View: Move mouse or cursor over stock symbol (ticker) to view short-term technical chart and over stock name to view long term chart. Click on  to add stock symbol to your watchlist and to add stock symbol to your watchlist and  to view watchlist. Click on any ticker or stock name for detailed market intelligence report for that stock. to view watchlist. Click on any ticker or stock name for detailed market intelligence report for that stock. |
12Stocks.com Performance of Stocks in S&P 100 Index
| Ticker | Stock Name | Watchlist | Category | Recent Price | Smart Investing & Trading Score | Change % | YTD Change% |
| QCOM | QUALCOMM |   | Technology | 165.66 | 56 | -0.11 | 14.54% |
| EMR | Emerson Electric | | Industrials | 107.65 | 23 | -0.12 | 10.60% |
| C | Citi | | Financials | 61.23 | 48 | -0.16 | 19.03% |
| BK | Bank of New York | | Financials | 56.37 | 28 | -0.21 | 8.30% |
| SPY | SPDR S&P | | Utilities | 500.86 | 7 | -0.22 | 5.38% |
| SPG | Simon Property | | Financials | 140.20 | 0 | -0.23 | -1.71% |
| GD | General Dynamics | | Industrials | 286.27 | 56 | -0.28 | 10.25% |
| CL | Colgate-Palmolive | | Consumer Staples | 91.60 | 83 | -0.35 | 14.92% |
| CRM | salesforce.com | | Technology | 267.98 | 10 | -0.36 | 1.84% |
| CHTR | Charter | | Technology | 255.00 | 25 | -0.37 | -34.39% |
| SCHW | Charles Schwab | | Financials | 73.66 | 58 | -0.39 | 7.06% |
| PEP | PepsiCo | | Consumer Staples | 175.23 | 71 | -0.39 | 3.17% |
| COST | Costco Wholesale | | Services & Goods | 719.99 | 7 | -0.40 | 9.08% |
| FDX | FedEx | | Transports | 260.69 | 26 | -0.42 | 3.05% |
| AXP | American Express | | Financials | 233.01 | 53 | -0.44 | 24.38% |
| NFLX | Netflix | | Technology | 548.01 | 10 | -0.48 | 12.56% |
| DIS | Walt Disney | | Services & Goods | 110.57 | 15 | -0.48 | 22.46% |
| UNP | Union Pacific | | Transports | 236.02 | 15 | -0.48 | -3.91% |
| LOW | Lowe s | | Services & Goods | 226.88 | 0 | -0.49 | 1.95% |
| LLY | Eli Lilly | | Health Care | 777.12 | 90 | -0.51 | 33.32% |
| WMT | Walmart | | Services & Goods | 59.05 | 13 | -0.51 | 12.37% |
| MCD | McDonald s | | Services & Goods | 271.60 | 40 | -0.53 | -8.40% |
| TXN | Texas Instruments | | Technology | 175.43 | 68 | -0.56 | 2.92% |
| LMT | Lockheed Martin | | Industrials | 462.27 | 71 | -0.57 | 1.99% |
| DHR | Danaher | | Industrials | 245.22 | 47 | -0.57 | 6.00% |
| For chart view version of above stock list: Chart View ➞ 0 - 25 , 25 - 50 , 50 - 75 , 75 - 100 , 100 - 125 | ||
 | Click To Change The Sort Order: By Market Cap or Company Size Performance: Year-to-date, Week and Day |  |
|
Get the most comprehensive stock market coverage daily at 12Stocks.com ➞ Best Stocks Today ➞ Best Stocks Weekly ➞ Best Stocks Year-to-Date ➞ Best Stocks Trends ➞  Best Stocks Today 12Stocks.com Best Nasdaq Stocks ➞ Best S&P 500 Stocks ➞ Best Tech Stocks ➞ Best Biotech Stocks ➞ |
| Detailed Overview of S&P 100 Stocks |
| S&P 100 Technical Overview, Leaders & Laggards, Top S&P 100 ETF Funds & Detailed S&P 100 Stocks List, Charts, Trends & More |
| S&P 100: Technical Analysis, Trends & YTD Performance | |
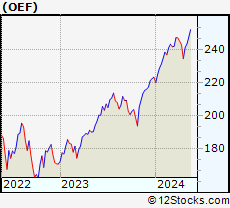
| S&P 100 index as represented by
OEF, an exchange-traded fund [ETF], holds basket of one hundred US (mostly largecap) stocks from across all major sectors of the US stock market. The S&P 100 index (contains stocks like Apple and Exxon) is up by 6.65% and is currently outperforming the overall market by 1.96% year-to-date. Below is a quick view of technical charts and trends: | |
 OEF Weekly Chart |
|
| Long Term Trend: Not Good | |
| Medium Term Trend: Not Good | |
 OEF Daily Chart |
|
| Short Term Trend: Not Good | |
| Overall Trend Score: 7 | |
| YTD Performance: 6.65% | |
| **Trend Scores & Views Are Only For Educational Purposes And Not For Investing | |
| 12Stocks.com: Investing in S&P 100 Index using Exchange Traded Funds | |
|
The following table shows list of key exchange traded funds (ETF) that
help investors track S&P 100 index. We have also included ETF funds that track S&P 500 index since it is market-cap weighted. The following list also includes leveraged ETF funds that track twice or thrice the daily returns of S&P 100 indices. Short or inverse ETF funds move in the opposite direction to the index they track and are useful during market pullbacks or during bear markets. Quick View: Move mouse or cursor over ETF symbol (ticker) to view short-term technical chart and over ETF name to view long term chart. Click on ticker or stock name for detailed view. Click on to add stock symbol to your watchlist and to view watchlist. |
12Stocks.com List of ETFs that track S&P 100 Index
| Ticker | ETF Name | Watchlist | Recent Price | Smart Investing & Trading Score | Change % | Week % | Year-to-date % |
| SPY | SPDR S&P 500 ETF | | 500.86 | 7 | -0.22 | -1.46 | 5.38% |
| SPXS | Direxion Daily S&P 500 Bear 3X ETF | | 10.02 | 88 | 0.60 | 4.27 | -13.25% |
| SH | ProShares Short S&P500 | | 12.47 | 93 | 0.32 | 1.55 | -4% |
| SDS | ProShares UltraShort S&P500 | | 27.31 | 93 | 0.40 | 2.94 | -8.72% |
| SPXU | ProShares UltraPro Short S&P500 | | 37.02 | 88 | 0.46 | 4.28 | -13.91% |
| UPRO | ProShares UltraPro S&P500 | | 60.95 | 7 | -0.73 | -4.5 | 11.34% |
| SPXL | Direxion Daily S&P500 Bull 3X ETF | | 116.04 | 7 | -0.50 | -4.21 | 11.59% |
| VOO | Vanguard 500 ETF | | 460.50 | 7 | -0.20 | -1.44 | 5.43% |
| SSO | ProShares Ultra S&P500 | | 70.67 | 7 | -0.28 | -2.8 | 8.61% |
| OEF | iShares S&P 100 | | 238.25 | 7 | -0.08 | -1.37 | 6.65% |
| 12Stocks.com: Charts, Trends, Fundamental Data and Performances of S&P 100 Stocks | |
|
We now take in-depth look at all S&P 100 stocks including charts, multi-period performances and overall trends (as measured by Smart Investing & Trading Score). One can sort S&P 100 stocks (click link to choose) by Daily, Weekly and by Year-to-Date performances. Also, one can sort by size of the company or by market capitalization. |
| Select Your Default Chart Type: | |||||
| |||||
| Click on stock symbol or name for detailed view. Click on to add stock symbol to your watchlist and to view watchlist. Quick View: Move mouse or cursor over "Daily" to quickly view daily technical stock chart and over "Weekly" to view weekly technical stock chart. | |||||

 | QCOM QUALCOMM Incorporated |
| Sector: Technology | |
| SubSector: Communication Equipment | |
| MarketCap: 77517.7 Millions | |
| Recent Price: 165.66 Smart Investing & Trading Score: 56 | |
| Day Percent Change: -0.11% Day Change: -0.19 | |
| Week Change: 0% Year-to-date Change: 14.5% | |
| QCOM Links: Profile News Message Board | |
| Charts:- Daily , Weekly | |
| Add QCOM to Watchlist: View: Get Complete QCOM Trend Analysis ➞ | |
 | EMR Emerson Electric Co. |
| Sector: Industrials | |
| SubSector: Industrial Electrical Equipment | |
| MarketCap: 30457.9 Millions | |
| Recent Price: 107.65 Smart Investing & Trading Score: 23 | |
| Day Percent Change: -0.12% Day Change: -0.13 | |
| Week Change: -2.04% Year-to-date Change: 10.6% | |
| EMR Links: Profile News Message Board | |
| Charts:- Daily , Weekly | |
| Add EMR to Watchlist: View: Get Complete EMR Trend Analysis ➞ | |
 | C Citigroup Inc. |
| Sector: Financials | |
| SubSector: Money Center Banks | |
| MarketCap: 94128 Millions | |
| Recent Price: 61.23 Smart Investing & Trading Score: 48 | |
| Day Percent Change: -0.16% Day Change: -0.10 | |
| Week Change: -2.28% Year-to-date Change: 19.0% | |
| C Links: Profile News Message Board | |
| Charts:- Daily , Weekly | |
| Add C to Watchlist: View: Get Complete C Trend Analysis ➞ | |
 | BK The Bank of New York Mellon Corporation |
| Sector: Financials | |
| SubSector: Asset Management | |
| MarketCap: 29807.5 Millions | |
| Recent Price: 56.37 Smart Investing & Trading Score: 28 | |
| Day Percent Change: -0.21% Day Change: -0.12 | |
| Week Change: -1.66% Year-to-date Change: 8.3% | |
| BK Links: Profile News Message Board | |
| Charts:- Daily , Weekly | |
| Add BK to Watchlist: View: Get Complete BK Trend Analysis ➞ | |
 | SPY SPDR S&P 500 ETF |
| Sector: Utilities | |
| SubSector: Exchange Traded Fund | |
| MarketCap: 0 Millions | |
| Recent Price: 500.86 Smart Investing & Trading Score: 7 | |
| Day Percent Change: -0.22% Day Change: -1.12 | |
| Week Change: -1.46% Year-to-date Change: 5.4% | |
| SPY Links: Profile News Message Board | |
| Charts:- Daily , Weekly | |
| Add SPY to Watchlist: View: Get Complete SPY Trend Analysis ➞ | |
 | SPG Simon Property Group, Inc. |
| Sector: Financials | |
| SubSector: REIT - Retail | |
| MarketCap: 17959.6 Millions | |
| Recent Price: 140.20 Smart Investing & Trading Score: 0 | |
| Day Percent Change: -0.23% Day Change: -0.33 | |
| Week Change: -1.52% Year-to-date Change: -1.7% | |
| SPG Links: Profile News Message Board | |
| Charts:- Daily , Weekly | |
| Add SPG to Watchlist: View: Get Complete SPG Trend Analysis ➞ | |
 | GD General Dynamics Corporation |
| Sector: Industrials | |
| SubSector: Aerospace/Defense Products & Services | |
| MarketCap: 37063.8 Millions | |
| Recent Price: 286.27 Smart Investing & Trading Score: 56 | |
| Day Percent Change: -0.28% Day Change: -0.81 | |
| Week Change: 0.66% Year-to-date Change: 10.3% | |
| GD Links: Profile News Message Board | |
| Charts:- Daily , Weekly | |
| Add GD to Watchlist: View: Get Complete GD Trend Analysis ➞ | |
 | CL Colgate-Palmolive Company |
| Sector: Consumer Staples | |
| SubSector: Personal Products | |
| MarketCap: 57242.7 Millions | |
| Recent Price: 91.60 Smart Investing & Trading Score: 83 | |
| Day Percent Change: -0.35% Day Change: -0.32 | |
| Week Change: 0.65% Year-to-date Change: 14.9% | |
| CL Links: Profile News Message Board | |
| Charts:- Daily , Weekly | |
| Add CL to Watchlist: View: Get Complete CL Trend Analysis ➞ | |
 | CRM salesforce.com, inc. |
| Sector: Technology | |
| SubSector: Application Software | |
| MarketCap: 137120 Millions | |
| Recent Price: 267.98 Smart Investing & Trading Score: 10 | |
| Day Percent Change: -0.36% Day Change: -0.96 | |
| Week Change: -2.3% Year-to-date Change: 1.8% | |
| CRM Links: Profile News Message Board | |
| Charts:- Daily , Weekly | |
| Add CRM to Watchlist: View: Get Complete CRM Trend Analysis ➞ | |
 | CHTR Charter Communications, Inc. |
| Sector: Technology | |
| SubSector: CATV Systems | |
| MarketCap: 82268.3 Millions | |
| Recent Price: 255.00 Smart Investing & Trading Score: 25 | |
| Day Percent Change: -0.37% Day Change: -0.94 | |
| Week Change: 0.15% Year-to-date Change: -34.4% | |
| CHTR Links: Profile News Message Board | |
| Charts:- Daily , Weekly | |
| Add CHTR to Watchlist: View: Get Complete CHTR Trend Analysis ➞ | |
 | SCHW The Charles Schwab Corporation |
| Sector: Financials | |
| SubSector: Investment Brokerage - National | |
| MarketCap: 45115.8 Millions | |
| Recent Price: 73.66 Smart Investing & Trading Score: 58 | |
| Day Percent Change: -0.39% Day Change: -0.29 | |
| Week Change: -1.77% Year-to-date Change: 7.1% | |
| SCHW Links: Profile News Message Board | |
| Charts:- Daily , Weekly | |
| Add SCHW to Watchlist: View: Get Complete SCHW Trend Analysis ➞ | |
 | PEP PepsiCo, Inc. |
| Sector: Consumer Staples | |
| SubSector: Beverages - Soft Drinks | |
| MarketCap: 162458 Millions | |
| Recent Price: 175.23 Smart Investing & Trading Score: 71 | |
| Day Percent Change: -0.39% Day Change: -0.68 | |
| Week Change: -0.2% Year-to-date Change: 3.2% | |
| PEP Links: Profile News Message Board | |
| Charts:- Daily , Weekly | |
| Add PEP to Watchlist: View: Get Complete PEP Trend Analysis ➞ | |
 | COST Costco Wholesale Corporation |
| Sector: Services & Goods | |
| SubSector: Discount, Variety Stores | |
| MarketCap: 136355 Millions | |
| Recent Price: 719.99 Smart Investing & Trading Score: 7 | |
| Day Percent Change: -0.40% Day Change: -2.91 | |
| Week Change: -1.26% Year-to-date Change: 9.1% | |
| COST Links: Profile News Message Board | |
| Charts:- Daily , Weekly | |
| Add COST to Watchlist: View: Get Complete COST Trend Analysis ➞ | |
 | FDX FedEx Corporation |
| Sector: Transports | |
| SubSector: Air Delivery & Freight Services | |
| MarketCap: 33188 Millions | |
| Recent Price: 260.69 Smart Investing & Trading Score: 26 | |
| Day Percent Change: -0.42% Day Change: -1.09 | |
| Week Change: -1.94% Year-to-date Change: 3.1% | |
| FDX Links: Profile News Message Board | |
| Charts:- Daily , Weekly | |
| Add FDX to Watchlist: View: Get Complete FDX Trend Analysis ➞ | |
 | AXP American Express Company |
| Sector: Financials | |
| SubSector: Credit Services | |
| MarketCap: 68388 Millions | |
| Recent Price: 233.01 Smart Investing & Trading Score: 53 | |
| Day Percent Change: -0.44% Day Change: -1.02 | |
| Week Change: -1.12% Year-to-date Change: 24.4% | |
| AXP Links: Profile News Message Board | |
| Charts:- Daily , Weekly | |
| Add AXP to Watchlist: View: Get Complete AXP Trend Analysis ➞ | |
 | NFLX Netflix, Inc. |
| Sector: Technology | |
| SubSector: CATV Systems | |
| MarketCap: 162108 Millions | |
| Recent Price: 548.01 Smart Investing & Trading Score: 10 | |
| Day Percent Change: -0.48% Day Change: -2.63 | |
| Week Change: -2.36% Year-to-date Change: 12.6% | |
| NFLX Links: Profile News Message Board | |
| Charts:- Daily , Weekly | |
| Add NFLX to Watchlist: View: Get Complete NFLX Trend Analysis ➞ | |
 | DIS The Walt Disney Company |
| Sector: Services & Goods | |
| SubSector: Entertainment - Diversified | |
| MarketCap: 178396 Millions | |
| Recent Price: 110.57 Smart Investing & Trading Score: 15 | |
| Day Percent Change: -0.48% Day Change: -0.53 | |
| Week Change: -1.92% Year-to-date Change: 22.5% | |
| DIS Links: Profile News Message Board | |
| Charts:- Daily , Weekly | |
| Add DIS to Watchlist: View: Get Complete DIS Trend Analysis ➞ | |
 | UNP Union Pacific Corporation |
| Sector: Transports | |
| SubSector: Railroads | |
| MarketCap: 87198.1 Millions | |
| Recent Price: 236.02 Smart Investing & Trading Score: 15 | |
| Day Percent Change: -0.48% Day Change: -1.14 | |
| Week Change: -2.79% Year-to-date Change: -3.9% | |
| UNP Links: Profile News Message Board | |
| Charts:- Daily , Weekly | |
| Add UNP to Watchlist: View: Get Complete UNP Trend Analysis ➞ | |
 | LOW Lowe s Companies, Inc. |
| Sector: Services & Goods | |
| SubSector: Home Improvement Stores | |
| MarketCap: 56084.2 Millions | |
| Recent Price: 226.88 Smart Investing & Trading Score: 0 | |
| Day Percent Change: -0.49% Day Change: -1.11 | |
| Week Change: -1.3% Year-to-date Change: 2.0% | |
| LOW Links: Profile News Message Board | |
| Charts:- Daily , Weekly | |
| Add LOW to Watchlist: View: Get Complete LOW Trend Analysis ➞ | |
 | LLY Eli Lilly and Company |
| Sector: Health Care | |
| SubSector: Drug Manufacturers - Major | |
| MarketCap: 130066 Millions | |
| Recent Price: 777.12 Smart Investing & Trading Score: 90 | |
| Day Percent Change: -0.51% Day Change: -3.98 | |
| Week Change: 5.95% Year-to-date Change: 33.3% | |
| LLY Links: Profile News Message Board | |
| Charts:- Daily , Weekly | |
| Add LLY to Watchlist: View: Get Complete LLY Trend Analysis ➞ | |
 | WMT Walmart Inc. |
| Sector: Services & Goods | |
| SubSector: Discount, Variety Stores | |
| MarketCap: 355610 Millions | |
| Recent Price: 59.05 Smart Investing & Trading Score: 13 | |
| Day Percent Change: -0.51% Day Change: -0.30 | |
| Week Change: -1.85% Year-to-date Change: 12.4% | |
| WMT Links: Profile News Message Board | |
| Charts:- Daily , Weekly | |
| Add WMT to Watchlist: View: Get Complete WMT Trend Analysis ➞ | |
 | MCD McDonald s Corporation |
| Sector: Services & Goods | |
| SubSector: Restaurants | |
| MarketCap: 122481 Millions | |
| Recent Price: 271.60 Smart Investing & Trading Score: 40 | |
| Day Percent Change: -0.53% Day Change: -1.44 | |
| Week Change: -0.55% Year-to-date Change: -8.4% | |
| MCD Links: Profile News Message Board | |
| Charts:- Daily , Weekly | |
| Add MCD to Watchlist: View: Get Complete MCD Trend Analysis ➞ | |
 | TXN Texas Instruments Incorporated |
| Sector: Technology | |
| SubSector: Semiconductor - Broad Line | |
| MarketCap: 99509.1 Millions | |
| Recent Price: 175.43 Smart Investing & Trading Score: 68 | |
| Day Percent Change: -0.56% Day Change: -0.99 | |
| Week Change: -1.16% Year-to-date Change: 2.9% | |
| TXN Links: Profile News Message Board | |
| Charts:- Daily , Weekly | |
| Add TXN to Watchlist: View: Get Complete TXN Trend Analysis ➞ | |
 | LMT Lockheed Martin Corporation |
| Sector: Industrials | |
| SubSector: Aerospace/Defense Products & Services | |
| MarketCap: 94116.4 Millions | |
| Recent Price: 462.27 Smart Investing & Trading Score: 71 | |
| Day Percent Change: -0.57% Day Change: -2.66 | |
| Week Change: 0.21% Year-to-date Change: 2.0% | |
| LMT Links: Profile News Message Board | |
| Charts:- Daily , Weekly | |
| Add LMT to Watchlist: View: Get Complete LMT Trend Analysis ➞ | |
 | DHR Danaher Corporation |
| Sector: Industrials | |
| SubSector: Diversified Machinery | |
| MarketCap: 93210.3 Millions | |
| Recent Price: 245.22 Smart Investing & Trading Score: 47 | |
| Day Percent Change: -0.57% Day Change: -1.40 | |
| Week Change: -0.55% Year-to-date Change: 6.0% | |
| DHR Links: Profile News Message Board | |
| Charts:- Daily , Weekly | |
| Add DHR to Watchlist: View: Get Complete DHR Trend Analysis ➞ | |
| For tabular summary view of above stock list: Summary View ➞ 0 - 25 , 25 - 50 , 50 - 75 , 75 - 100 , 100 - 125 | ||
| Click To Change The Sort Order: By Market Cap or Company Size Performance: Year-to-date, Week and Day | |
| Select Chart Type: | ||
|
Best Stocks Today 12Stocks.com |
� 2024 12Stocks.com Terms & Conditions Privacy Contact Us
All Information Provided Only For Education And Not To Be Used For Investing or Trading. See Terms & Conditions


One More Thing ... Get Best Stocks Delivered Daily!
Never Ever Miss A Move With Our Top Ten Stocks Lists
Find Best Stocks In Any Market - Bull or Bear Market
Take A Peek At Our Top Ten Stocks Lists: Daily, Weekly, Year-to-Date & Top Trends
Find Best Stocks In Any Market - Bull or Bear Market
Take A Peek At Our Top Ten Stocks Lists: Daily, Weekly, Year-to-Date & Top Trends
S&P 100 Stocks With Best Up Trends [0-bearish to 100-bullish]: 3M [100], NextEra Energy[100], T-Mobile US[95], Exelon [95], Altria [95], Procter & Gamble[95], Amgen [90], Duke Energy[90], Eli Lilly[90], Pfizer [87], Southern [83]
Best S&P 100 Stocks Year-to-Date:
NVIDIA [67.86%], Eli Lilly[33.32%], General Electric[25.06%], General Motors[24.6%], American Express[24.38%], Meta Platforms[22.48%], Walt Disney[22.46%], Wells Fargo[21.29%], Citi [19.03%], Merck [18.62%], Google [18.39%] Best S&P 100 Stocks This Week:
3M [7.92%], Tesla [7.09%], Eli Lilly[5.95%], Pfizer [4.82%], Johnson & Johnson[3.17%], NextEra Energy[2.64%], Amgen [2.45%], AbbVie [1.95%], MetLife [1.93%], American [1.76%], Altria [1.38%] Best S&P 100 Stocks Daily:
Johnson & Johnson[4.28%], Pfizer [3.92%], 3M [2.68%], Amazon.com [1.67%], Google [1.47%], American Tower[1.38%], Google [1.34%], Ford Motor[1.32%], Microsoft [1.28%], NextEra Energy[1.14%], Honeywell [1.13%]