
 Login Sign Up


| |||||
 |  | ||||

| 12Stocks.com Market Intelligence |
Best SmallCap Stocks
|
| In a hurry? Small Cap Stock Lists: Performance Trends Table, Stock Charts
Sort Small Cap stocks: Daily, Weekly, Year-to-Date, Market Cap & Trends. Filter Small Cap stocks list by sector: Show all, Tech, Finance, Energy, Staples, Retail, Industrial, Materials, Utilities and HealthCare Filter Small Cap stocks list by size: All Large Medium Small and MicroCap |
| 12Stocks.com Small Cap Stocks Performances & Trends Daily | |||||||||
|
|  The overall Smart Investing & Trading Score is 95 (0-bearish to 100-bullish) which puts Small Cap index in short term bullish trend. The Smart Investing & Trading Score from previous trading session is 100 and hence a deterioration of trend.
| ||||||||
Here are the Smart Investing & Trading Scores of the most requested small cap stocks at 12Stocks.com (click stock name for detailed review):
|


| 12Stocks.com: Investing in Smallcap Index with Stocks | |
|
The following table helps investors and traders sort through current performance and trends (as measured by Smart Investing & Trading Score) of various
stocks in the Smallcap Index. Quick View: Move mouse or cursor over stock symbol (ticker) to view short-term technical chart and over stock name to view long term chart. Click on  to add stock symbol to your watchlist and to add stock symbol to your watchlist and  to view watchlist. Click on any ticker or stock name for detailed market intelligence report for that stock. to view watchlist. Click on any ticker or stock name for detailed market intelligence report for that stock. |
12Stocks.com Performance of Stocks in Smallcap Index
| Ticker | Stock Name | Watchlist | Category | Recent Price | Smart Investing & Trading Score | Change % | YTD Change% |
| XPEL | XPEL |   | Consumer Staples | 35.03 | 32 | 1.77% | -34.95% |
| OSUR | OraSure | | Health Care | 5.33 | 57 | -1.02% | -35.00% |
| FNA | Paragon 28 | | Health Care | 8.10 | 25 | 0.00% | -35.04% |
| QTRX | Quanterix | | Health Care | 17.74 | 57 | -0.78% | -35.11% |
| PTLO | Portillos | | Services & Goods | 10.41 | 32 | 1.26% | -35.14% |
| LIND | Lindblad Expeditions | | Consumer Staples | 7.30 | 47 | -1.35% | -35.23% |
| INFU | InfuSystem | | Health Care | 6.83 | 0 | -1.26% | -35.25% |
| HBIO | Harvard Bioscience | | Health Care | 3.46 | 27 | 0.29% | -35.33% |
| UNIT | Uniti Group | | Financials | 3.73 | 10 | -1.58% | -35.47% |
| WKHS | Workhorse Group | | Consumer Staples | 0.23 | 74 | 2.02% | -35.58% |
| CUE | Cue Biopharma | | Health Care | 1.70 | 25 | 3.66% | -35.61% |
| SLRN | Acelyrin | | Health Care | 4.73 | 69 | -0.21% | -35.82% |
| CHRS | Coherus BioSciences | | Health Care | 2.13 | 67 | -2.06% | -35.89% |
| DHC | Diversified Healthcare | | Financials | 2.40 | 32 | 0.63% | -35.96% |
| SDGR | Schrodinger | | Health Care | 22.86 | 10 | -2.12% | -36.13% |
| RYI | Ryerson Holding | | Industrials | 22.10 | 17 | 0.82% | -36.27% |
| RYI | Ryerson Holding | | Industrials | 9.45 | 17 | 0.64% | -36.27% |
| GSAT | Globalstar | | Technology | 1.24 | 27 | -0.40% | -36.34% |
| ACHR | Archer Aviation | | Industrials | 3.88 | 35 | -0.26% | -36.60% |
| MBUU | Malibu Boats | | Consumer Staples | 34.73 | 32 | -1.17% | -36.65% |
| EVGO | EVgo | | Services & Goods | 2.27 | 64 | -3.81% | -36.68% |
| ATRC | AtriCure | | Health Care | 22.57 | 27 | 2.03% | -36.76% |
| NRDY | Nerdy | | Technology | 2.15 | 10 | 0.94% | -37.41% |
| CFFI | C&F Financial | | Financials | 42.57 | 40 | -1.05% | -37.57% |
| EB | Eventbrite | | Technology | 5.21 | 10 | -0.10% | -37.74% |
| For chart view version of above stock list: Chart View ➞ 0 - 25 , 25 - 50 , 50 - 75 , 75 - 100 , 100 - 125 , 125 - 150 , 150 - 175 , 175 - 200 , 200 - 225 , 225 - 250 , 250 - 275 , 275 - 300 , 300 - 325 , 325 - 350 , 350 - 375 , 375 - 400 , 400 - 425 , 425 - 450 , 450 - 475 , 475 - 500 , 500 - 525 , 525 - 550 , 550 - 575 , 575 - 600 , 600 - 625 , 625 - 650 , 650 - 675 , 675 - 700 , 700 - 725 , 725 - 750 , 750 - 775 , 775 - 800 , 800 - 825 , 825 - 850 , 850 - 875 , 875 - 900 , 900 - 925 , 925 - 950 , 950 - 975 , 975 - 1000 , 1000 - 1025 , 1025 - 1050 , 1050 - 1075 , 1075 - 1100 , 1100 - 1125 , 1125 - 1150 , 1150 - 1175 , 1175 - 1200 , 1200 - 1225 , 1225 - 1250 , 1250 - 1275 , 1275 - 1300 , 1300 - 1325 , 1325 - 1350 , 1350 - 1375 , 1375 - 1400 , 1400 - 1425 , 1425 - 1450 , 1450 - 1475 | ||
 | Click To Change The Sort Order: By Market Cap or Company Size Performance: Year-to-date, Week and Day |  |
| Too many stocks? View smallcap stocks filtered by marketcap & sector |
| Marketcap: All SmallCap Stocks (default-no microcap), Large, Mid-Range, Small |
| Smallcap Sector: Tech, Finance, Energy, Staples, Retail, Industrial, Materials, & Medical |
|
Get the most comprehensive stock market coverage daily at 12Stocks.com ➞ Best Stocks Today ➞ Best Stocks Weekly ➞ Best Stocks Year-to-Date ➞ Best Stocks Trends ➞  Best Stocks Today 12Stocks.com Best Nasdaq Stocks ➞ Best S&P 500 Stocks ➞ Best Tech Stocks ➞ Best Biotech Stocks ➞ |
| Detailed Overview of SmallCap Stocks |
| SmallCap Technical Overview, Leaders & Laggards, Top SmallCap ETF Funds & Detailed SmallCap Stocks List, Charts, Trends & More |
| Smallcap: Technical Analysis, Trends & YTD Performance | |
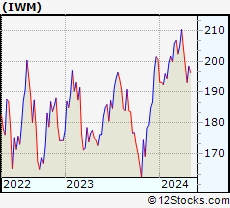
| SmallCap segment as represented by
IWM, an exchange-traded fund [ETF], holds basket of thousands of smallcap stocks from across all major sectors of the US stock market. The smallcap index (contains stocks like Riverbed & Sotheby's) is up by 4.12% and is currently underperforming the overall market by -6.85% year-to-date. Below is a quick view of technical charts and trends: | |
 IWM Weekly Chart |
|
| Long Term Trend: Very Good | |
| Medium Term Trend: Very Good | |
 IWM Daily Chart |
|
| Short Term Trend: Good | |
| Overall Trend Score: 95 | |
| YTD Performance: 4.12% | |
| **Trend Scores & Views Are Only For Educational Purposes And Not For Investing | |
| 12Stocks.com: Top Performing Small Cap Index Stocks | ||||||||||||||||||||||||||||||||||||||||||||||||
 The top performing Small Cap Index stocks year to date are
Now, more recently, over last week, the top performing Small Cap Index stocks on the move are


|
||||||||||||||||||||||||||||||||||||||||||||||||
| 12Stocks.com: Investing in Smallcap Index using Exchange Traded Funds | |
|
The following table shows list of key exchange traded funds (ETF) that
help investors track Smallcap index. The following list also includes leveraged ETF funds that track twice or thrice the daily returns of Smallcap indices. Short or inverse ETF funds move in the opposite direction to the index they track and are useful during market pullbacks or during bear markets. Quick View: Move mouse or cursor over ETF symbol (ticker) to view short-term technical chart and over ETF name to view long term chart. Click on ticker or stock name for detailed view. Click on to add stock symbol to your watchlist and to view watchlist. |
12Stocks.com List of ETFs that track Smallcap Index
| Ticker | ETF Name | Watchlist | Recent Price | Smart Investing & Trading Score | Change % | Week % | Year-to-date % |
| IWM | iShares Russell 2000 | | 208.97 | 95 | -0.22 | 2.28 | 4.12% |
| IJR | iShares Core S&P Small-Cap | | 110.63 | 88 | -0.14 | 1.51 | 2.2% |
| VTWO | Vanguard Russell 2000 ETF | | 84.43 | 95 | -0.24 | 2.18 | 4.11% |
| IWN | iShares Russell 2000 Value | | 158.82 | 95 | 0.06 | 1.68 | 2.25% |
| IJS | iShares S&P Small-Cap 600 Value | | 101.91 | 88 | -0.22 | 1.38 | -1.13% |
| IWO | iShares Russell 2000 Growth | | 267.15 | 100 | 0.21 | 2.78 | 5.92% |
| IJT | iShares S&P Small-Cap 600 Growth | | 131.69 | 100 | -0.39 | 1.41 | 5.23% |
| XSLV | PowerShares S&P SmallCap Low Volatil ETF | | 44.47 | 76 | -0.04 | 0.54 | 0.72% |
| SAA | ProShares Ultra SmallCap600 | | 25.05 | 85 | -0.60 | 2.89 | 0.42% |
| SBB | ProShares Short SmallCap600 | | 15.77 | 10 | 0.70 | -1.16 | -1% |
| SMLV | SPDR SSGA US Small Cap Low Volatil ETF | | 112.72 | 88 | 0.16 | 1.34 | 0.17% |
| SDD | ProShares UltraShort SmallCap600 | | 17.78 | 20 | 0.61 | -2.75 | -3.52% |
| 12Stocks.com: Charts, Trends, Fundamental Data and Performances of SmallCap Stocks | |
|
We now take in-depth look at all SmallCap stocks including charts, multi-period performances and overall trends (as measured by Smart Investing & Trading Score). One can sort SmallCap stocks (click link to choose) by Daily, Weekly and by Year-to-Date performances. Also, one can sort by size of the company or by market capitalization. |
| Select Your Default Chart Type: | |||||
| |||||
| Click on stock symbol or name for detailed view. Click on to add stock symbol to your watchlist and to view watchlist. Quick View: Move mouse or cursor over "Daily" to quickly view daily technical stock chart and over "Weekly" to view weekly technical stock chart. | |||||

 | XPEL XPEL, Inc. |
| Sector: Consumer Staples | |
| SubSector: Auto Parts | |
| MarketCap: 290.239 Millions | |
| Recent Price: 35.03 Smart Investing & Trading Score: 32 | |
| Day Percent Change: 1.77% Day Change: 0.61 | |
| Week Change: 2.55% Year-to-date Change: -35.0% | |
| XPEL Links: Profile News Message Board | |
| Charts:- Daily , Weekly | |
| Add XPEL to Watchlist: View: Get Complete XPEL Trend Analysis ➞ | |
 | OSUR OraSure Technologies, Inc. |
| Sector: Health Care | |
| SubSector: Medical Instruments & Supplies | |
| MarketCap: 468.26 Millions | |
| Recent Price: 5.33 Smart Investing & Trading Score: 57 | |
| Day Percent Change: -1.02% Day Change: -0.05 | |
| Week Change: 9.67% Year-to-date Change: -35.0% | |
| OSUR Links: Profile News Message Board | |
| Charts:- Daily , Weekly | |
| Add OSUR to Watchlist: View: Get Complete OSUR Trend Analysis ➞ | |
 | FNA Paragon 28, Inc. |
| Sector: Health Care | |
| SubSector: Medical Devices | |
| MarketCap: 1420 Millions | |
| Recent Price: 8.10 Smart Investing & Trading Score: 25 | |
| Day Percent Change: 0.00% Day Change: 0.00 | |
| Week Change: 4.52% Year-to-date Change: -35.0% | |
| FNA Links: Profile News Message Board | |
| Charts:- Daily , Weekly | |
| Add FNA to Watchlist: View: Get Complete FNA Trend Analysis ➞ | |
 | QTRX Quanterix Corporation |
| Sector: Health Care | |
| SubSector: Biotechnology | |
| MarketCap: 448.685 Millions | |
| Recent Price: 17.74 Smart Investing & Trading Score: 57 | |
| Day Percent Change: -0.78% Day Change: -0.14 | |
| Week Change: 6.23% Year-to-date Change: -35.1% | |
| QTRX Links: Profile News Message Board | |
| Charts:- Daily , Weekly | |
| Add QTRX to Watchlist: View: Get Complete QTRX Trend Analysis ➞ | |
 | PTLO Portillos Inc. |
| Sector: Services & Goods | |
| SubSector: Restaurants | |
| MarketCap: 1590 Millions | |
| Recent Price: 10.41 Smart Investing & Trading Score: 32 | |
| Day Percent Change: 1.26% Day Change: 0.13 | |
| Week Change: 2.97% Year-to-date Change: -35.1% | |
| PTLO Links: Profile News Message Board | |
| Charts:- Daily , Weekly | |
| Add PTLO to Watchlist: View: Get Complete PTLO Trend Analysis ➞ | |
 | LIND Lindblad Expeditions Holdings, Inc. |
| Sector: Consumer Staples | |
| SubSector: Recreational Goods, Other | |
| MarketCap: 220.259 Millions | |
| Recent Price: 7.30 Smart Investing & Trading Score: 47 | |
| Day Percent Change: -1.35% Day Change: -0.10 | |
| Week Change: 0.41% Year-to-date Change: -35.2% | |
| LIND Links: Profile News Message Board | |
| Charts:- Daily , Weekly | |
| Add LIND to Watchlist: View: Get Complete LIND Trend Analysis ➞ | |
 | INFU InfuSystem Holdings Inc. |
| Sector: Health Care | |
| SubSector: Medical Instruments & Supplies | |
| MarketCap: 136.76 Millions | |
| Recent Price: 6.83 Smart Investing & Trading Score: 0 | |
| Day Percent Change: -1.26% Day Change: -0.09 | |
| Week Change: -6.25% Year-to-date Change: -35.3% | |
| INFU Links: Profile News Message Board | |
| Charts:- Daily , Weekly | |
| Add INFU to Watchlist: View: Get Complete INFU Trend Analysis ➞ | |
 | HBIO Harvard Bioscience, Inc. |
| Sector: Health Care | |
| SubSector: Medical Instruments & Supplies | |
| MarketCap: 63.086 Millions | |
| Recent Price: 3.46 Smart Investing & Trading Score: 27 | |
| Day Percent Change: 0.29% Day Change: 0.01 | |
| Week Change: -1.98% Year-to-date Change: -35.3% | |
| HBIO Links: Profile News Message Board | |
| Charts:- Daily , Weekly | |
| Add HBIO to Watchlist: View: Get Complete HBIO Trend Analysis ➞ | |
 | UNIT Uniti Group Inc. |
| Sector: Financials | |
| SubSector: REIT - Industrial | |
| MarketCap: 1363.09 Millions | |
| Recent Price: 3.73 Smart Investing & Trading Score: 10 | |
| Day Percent Change: -1.58% Day Change: -0.06 | |
| Week Change: -3.62% Year-to-date Change: -35.5% | |
| UNIT Links: Profile News Message Board | |
| Charts:- Daily , Weekly | |
| Add UNIT to Watchlist: View: Get Complete UNIT Trend Analysis ➞ | |
 | WKHS Workhorse Group Inc. |
| Sector: Consumer Staples | |
| SubSector: Auto Parts | |
| MarketCap: 129.839 Millions | |
| Recent Price: 0.23 Smart Investing & Trading Score: 74 | |
| Day Percent Change: 2.02% Day Change: 0.00 | |
| Week Change: 28.83% Year-to-date Change: -35.6% | |
| WKHS Links: Profile News Message Board | |
| Charts:- Daily , Weekly | |
| Add WKHS to Watchlist: View: Get Complete WKHS Trend Analysis ➞ | |
 | CUE Cue Biopharma, Inc. |
| Sector: Health Care | |
| SubSector: Biotechnology | |
| MarketCap: 352.785 Millions | |
| Recent Price: 1.70 Smart Investing & Trading Score: 25 | |
| Day Percent Change: 3.66% Day Change: 0.06 | |
| Week Change: -2.3% Year-to-date Change: -35.6% | |
| CUE Links: Profile News Message Board | |
| Charts:- Daily , Weekly | |
| Add CUE to Watchlist: View: Get Complete CUE Trend Analysis ➞ | |
 | SLRN Acelyrin, Inc. |
| Sector: Health Care | |
| SubSector: Biotechnology | |
| MarketCap: 2030 Millions | |
| Recent Price: 4.73 Smart Investing & Trading Score: 69 | |
| Day Percent Change: -0.21% Day Change: -0.01 | |
| Week Change: 1.07% Year-to-date Change: -35.8% | |
| SLRN Links: Profile News Message Board | |
| Charts:- Daily , Weekly | |
| Add SLRN to Watchlist: View: Get Complete SLRN Trend Analysis ➞ | |
 | CHRS Coherus BioSciences, Inc. |
| Sector: Health Care | |
| SubSector: Biotechnology | |
| MarketCap: 1073.45 Millions | |
| Recent Price: 2.13 Smart Investing & Trading Score: 67 | |
| Day Percent Change: -2.06% Day Change: -0.05 | |
| Week Change: 12.37% Year-to-date Change: -35.9% | |
| CHRS Links: Profile News Message Board | |
| Charts:- Daily , Weekly | |
| Add CHRS to Watchlist: View: Get Complete CHRS Trend Analysis ➞ | |
 | DHC Diversified Healthcare Trust |
| Sector: Financials | |
| SubSector: REIT - Healthcare Facilities | |
| MarketCap: 814.114 Millions | |
| Recent Price: 2.40 Smart Investing & Trading Score: 32 | |
| Day Percent Change: 0.63% Day Change: 0.02 | |
| Week Change: 5.51% Year-to-date Change: -36.0% | |
| DHC Links: Profile News Message Board | |
| Charts:- Daily , Weekly | |
| Add DHC to Watchlist: View: Get Complete DHC Trend Analysis ➞ | |
 | SDGR Schrodinger, Inc. |
| Sector: Health Care | |
| SubSector: Health Information Services | |
| MarketCap: 47287 Millions | |
| Recent Price: 22.86 Smart Investing & Trading Score: 10 | |
| Day Percent Change: -2.12% Day Change: -0.50 | |
| Week Change: 0.82% Year-to-date Change: -36.1% | |
| SDGR Links: Profile News Message Board | |
| Charts:- Daily , Weekly | |
| Add SDGR to Watchlist: View: Get Complete SDGR Trend Analysis ➞ | |
 | RYI Ryerson Holding Corporation |
| Sector: Industrials | |
| SubSector: Metal Fabrication | |
| MarketCap: 202.55 Millions | |
| Recent Price: 22.10 Smart Investing & Trading Score: 17 | |
| Day Percent Change: 0.82% Day Change: 0.18 | |
| Week Change: -2.43% Year-to-date Change: -36.3% | |
| RYI Links: Profile News Message Board | |
| Charts:- Daily , Weekly | |
| Add RYI to Watchlist: View: Get Complete RYI Trend Analysis ➞ | |
| RYI Ryerson Holding Corporation |
| Sector: Industrials | |
| SubSector: Metal Fabrication | |
| MarketCap: 202.55 Millions | |
| Recent Price: 9.45 Smart Investing & Trading Score: 17 | |
| Day Percent Change: 0.64% Day Change: 0.06 | |
| Week Change: -2.43% Year-to-date Change: -36.3% | |
| RYI Links: Profile News Message Board | |
| Charts:- Daily , Weekly | |
| Add RYI to Watchlist: View: Get Complete RYI Trend Analysis ➞ | |
 | GSAT Globalstar, Inc. |
| Sector: Technology | |
| SubSector: Wireless Communications | |
| MarketCap: 485.127 Millions | |
| Recent Price: 1.24 Smart Investing & Trading Score: 27 | |
| Day Percent Change: -0.40% Day Change: 0.00 | |
| Week Change: 0.41% Year-to-date Change: -36.3% | |
| GSAT Links: Profile News Message Board | |
| Charts:- Daily , Weekly | |
| Add GSAT to Watchlist: View: Get Complete GSAT Trend Analysis ➞ | |
 | ACHR Archer Aviation Inc. |
| Sector: Industrials | |
| SubSector: Aerospace & Defense | |
| MarketCap: 976 Millions | |
| Recent Price: 3.88 Smart Investing & Trading Score: 35 | |
| Day Percent Change: -0.26% Day Change: -0.01 | |
| Week Change: 6.3% Year-to-date Change: -36.6% | |
| ACHR Links: Profile News Message Board | |
| Charts:- Daily , Weekly | |
| Add ACHR to Watchlist: View: Get Complete ACHR Trend Analysis ➞ | |
 | MBUU Malibu Boats, Inc. |
| Sector: Consumer Staples | |
| SubSector: Recreational Goods, Other | |
| MarketCap: 561.059 Millions | |
| Recent Price: 34.73 Smart Investing & Trading Score: 32 | |
| Day Percent Change: -1.17% Day Change: -0.41 | |
| Week Change: -3.42% Year-to-date Change: -36.7% | |
| MBUU Links: Profile News Message Board | |
| Charts:- Daily , Weekly | |
| Add MBUU to Watchlist: View: Get Complete MBUU Trend Analysis ➞ | |
 | EVGO EVgo, Inc. |
| Sector: Services & Goods | |
| SubSector: Specialty Retail | |
| MarketCap: 1140 Millions | |
| Recent Price: 2.27 Smart Investing & Trading Score: 64 | |
| Day Percent Change: -3.81% Day Change: -0.09 | |
| Week Change: 22.04% Year-to-date Change: -36.7% | |
| EVGO Links: Profile News Message Board | |
| Charts:- Daily , Weekly | |
| Add EVGO to Watchlist: View: Get Complete EVGO Trend Analysis ➞ | |
 | ATRC AtriCure, Inc. |
| Sector: Health Care | |
| SubSector: Medical Instruments & Supplies | |
| MarketCap: 1158.7 Millions | |
| Recent Price: 22.57 Smart Investing & Trading Score: 27 | |
| Day Percent Change: 2.03% Day Change: 0.45 | |
| Week Change: 1.21% Year-to-date Change: -36.8% | |
| ATRC Links: Profile News Message Board | |
| Charts:- Daily , Weekly | |
| Add ATRC to Watchlist: View: Get Complete ATRC Trend Analysis ➞ | |
 | NRDY Nerdy, Inc. |
| Sector: Technology | |
| SubSector: Software - Application | |
| MarketCap: 683 Millions | |
| Recent Price: 2.15 Smart Investing & Trading Score: 10 | |
| Day Percent Change: 0.94% Day Change: 0.02 | |
| Week Change: 0.94% Year-to-date Change: -37.4% | |
| NRDY Links: Profile News Message Board | |
| Charts:- Daily , Weekly | |
| Add NRDY to Watchlist: View: Get Complete NRDY Trend Analysis ➞ | |
 | CFFI C&F Financial Corporation |
| Sector: Financials | |
| SubSector: Regional - Mid-Atlantic Banks | |
| MarketCap: 145.559 Millions | |
| Recent Price: 42.57 Smart Investing & Trading Score: 40 | |
| Day Percent Change: -1.05% Day Change: -0.45 | |
| Week Change: -0.23% Year-to-date Change: -37.6% | |
| CFFI Links: Profile News Message Board | |
| Charts:- Daily , Weekly | |
| Add CFFI to Watchlist: View: Get Complete CFFI Trend Analysis ➞ | |
 | EB Eventbrite, Inc. |
| Sector: Technology | |
| SubSector: Application Software | |
| MarketCap: 805.262 Millions | |
| Recent Price: 5.21 Smart Investing & Trading Score: 10 | |
| Day Percent Change: -0.10% Day Change: 0.00 | |
| Week Change: -3.97% Year-to-date Change: -37.7% | |
| EB Links: Profile News Message Board | |
| Charts:- Daily , Weekly | |
| Add EB to Watchlist: View: Get Complete EB Trend Analysis ➞ | |
| For tabular summary view of above stock list: Summary View ➞ 0 - 25 , 25 - 50 , 50 - 75 , 75 - 100 , 100 - 125 , 125 - 150 , 150 - 175 , 175 - 200 , 200 - 225 , 225 - 250 , 250 - 275 , 275 - 300 , 300 - 325 , 325 - 350 , 350 - 375 , 375 - 400 , 400 - 425 , 425 - 450 , 450 - 475 , 475 - 500 , 500 - 525 , 525 - 550 , 550 - 575 , 575 - 600 , 600 - 625 , 625 - 650 , 650 - 675 , 675 - 700 , 700 - 725 , 725 - 750 , 750 - 775 , 775 - 800 , 800 - 825 , 825 - 850 , 850 - 875 , 875 - 900 , 900 - 925 , 925 - 950 , 950 - 975 , 975 - 1000 , 1000 - 1025 , 1025 - 1050 , 1050 - 1075 , 1075 - 1100 , 1100 - 1125 , 1125 - 1150 , 1150 - 1175 , 1175 - 1200 , 1200 - 1225 , 1225 - 1250 , 1250 - 1275 , 1275 - 1300 , 1300 - 1325 , 1325 - 1350 , 1350 - 1375 , 1375 - 1400 , 1400 - 1425 , 1425 - 1450 , 1450 - 1475 | ||
| Click To Change The Sort Order: By Market Cap or Company Size Performance: Year-to-date, Week and Day | |
| Select Chart Type: | ||
| Too many stocks? View smallcap stocks filtered by marketcap & sector |
| Marketcap: All SmallCap Stocks (default-no microcap), Large, Mid-Range, Small & MicroCap |
| Sector: Tech, Finance, Energy, Staples, Retail, Industrial, Materials, Utilities & Medical |
|
Best Stocks Today 12Stocks.com |
© 2024 12Stocks.com Terms & Conditions Privacy Contact Us
All Information Provided Only For Education And Not To Be Used For Investing or Trading. See Terms & Conditions


One More Thing ... Get Best Stocks Delivered Daily!
Never Ever Miss A Move With Our Top Ten Stocks Lists
Find Best Stocks In Any Market - Bull or Bear Market
Take A Peek At Our Top Ten Stocks Lists: Daily, Weekly, Year-to-Date & Top Trends
Find Best Stocks In Any Market - Bull or Bear Market
Take A Peek At Our Top Ten Stocks Lists: Daily, Weekly, Year-to-Date & Top Trends
Smallcap Stocks With Best Up Trends [0-bearish to 100-bullish]: Agilysys [100], Vanda [100], Guardant Health[100], Natural Grocers[100], NuScale Power[100], Cushman & Wakefield[100], Blue Bird[100], Eve Holding[100], Newpark Resources[100], Arrow Financial[100], TowneBank [100]
Best Smallcap Stocks Year-to-Date:
Viking [304.73%], Super Micro[231.02%], Sweetgreen [182.92%], Arcutis Bio[177.4%], Vera [175.32%], Novavax [171.77%], Stoke [168.25%], Oscar Health[147.78%], SoundHound AI[142.76%], MicroStrategy [131.72%], Carvana Co[127.35%] Best Smallcap Stocks This Week:
MacroGenics [48.64%], Novavax [46.9%], LivePerson [36.71%], ProKidney [36.48%], Treace Medical[29.45%], SunPower [28.91%], Workhorse Group[28.83%], Emergent BioSolutions[25.4%], Vuzix [25%], Tellurian [25%], Stoke [24.65%] Best Smallcap Stocks Daily:
Trupanion [12.53%], Extreme s[11.07%], Allakos [10.55%], Hawkins [8.45%], Ventyx Biosciences[6.68%], Semler Scientific[5.99%], Alphatec [5.88%], Verve [5.78%], Verrica [5.27%], GEO Group[5.19%], Aceto [5.00%]