
 Login Sign Up


| |||||
 |  | ||||

| 12Stocks.com Market Intelligence |
Best SmallCap Stocks
|
| In a hurry? Small Cap Stock Lists: Performance Trends Table, Stock Charts
Sort Small Cap stocks: Daily, Weekly, Year-to-Date, Market Cap & Trends. Filter Small Cap stocks list by sector: Show all, Tech, Finance, Energy, Staples, Retail, Industrial, Materials, Utilities and HealthCare Filter Small Cap stocks list by size: All Large Medium Small and MicroCap |
| 12Stocks.com Small Cap Stocks Performances & Trends Daily | |||||||||
|
|  The overall Smart Investing & Trading Score is 39 (0-bearish to 100-bullish) which puts Small Cap index in short term bearish to neutral trend. The Smart Investing & Trading Score from previous trading session is 14 and hence an improvement of trend.
| ||||||||
Here are the Smart Investing & Trading Scores of the most requested small cap stocks at 12Stocks.com (click stock name for detailed review):
|


| 12Stocks.com: Investing in Smallcap Index with Stocks | |
|
The following table helps investors and traders sort through current performance and trends (as measured by Smart Investing & Trading Score) of various
stocks in the Smallcap Index. Quick View: Move mouse or cursor over stock symbol (ticker) to view short-term technical chart and over stock name to view long term chart. Click on  to add stock symbol to your watchlist and to add stock symbol to your watchlist and  to view watchlist. Click on any ticker or stock name for detailed market intelligence report for that stock. to view watchlist. Click on any ticker or stock name for detailed market intelligence report for that stock. |
12Stocks.com Performance of Stocks in Smallcap Index
| Ticker | Stock Name | Watchlist | Category | Recent Price | Smart Investing & Trading Score | Change % | YTD Change% |
| AHH | Armada Hoffler |   | Financials | 10.78 | 88 | 1.56% | -12.89% |
| NRIM | Northrim BanCorp | | Financials | 49.83 | 77 | 1.00% | -12.91% |
| ABR | Arbor Realty | | Financials | 13.22 | 67 | 1.89% | -12.94% |
| HTH | Hilltop | | Financials | 30.65 | 57 | 1.66% | -12.95% |
| BBUC | Brookfield Business | | Financials | 20.18 | 10 | -0.76% | -12.96% |
| AEIS | Advanced Energy | | Technology | 94.80 | 17 | -1.34% | -12.97% |
| WRBY | Warby Parker | | Health Care | 12.28 | 15 | 2.46% | -12.97% |
| EVTC | EVERTEC | | Technology | 35.62 | 0 | -5.32% | -12.99% |
| ASTE | Astec Industries | | Industrials | 32.35 | 0 | -4.20% | -13.04% |
| TRNO | Terreno Realty | | Financials | 54.50 | 10 | 0.41% | -13.04% |
| RXO | RXO | | Industrials | 20.32 | 49 | 6.95% | -13.05% |
| HI | Hillenbrand | | Industrials | 41.60 | 0 | 0.41% | -13.06% |
| ALEX | Alexander & Baldwin | | Financials | 16.52 | 100 | 0.33% | -13.12% |
| MIRM | Mirum | | Health Care | 25.62 | 52 | -0.39% | -13.21% |
| BTAI | BioXcel | | Health Care | 2.56 | 10 | 0.79% | -13.22% |
| ARI | Apollo Commercial | | Financials | 10.19 | 17 | 1.85% | -13.25% |
| THFF | First Financial | | Financials | 37.31 | 67 | 2.44% | -13.29% |
| PLBC | Plumas Bancorp | | Financials | 35.83 | 86 | -0.19% | -13.35% |
| HBNC | Horizon Bancorp | | Financials | 12.40 | 100 | 1.89% | -13.35% |
| ONTF | ON24 | | Technology | 6.83 | 54 | -0.15% | -13.38% |
| PDLB | PDL Community | | Financials | 8.45 | 57 | 0.00% | -13.42% |
| UPWK | Upwork | | Technology | 12.88 | 64 | 7.65% | -13.42% |
| CBU | Community Bank | | Financials | 45.10 | 80 | 1.78% | -13.45% |
| MPB | Mid Penn | | Financials | 21.01 | 50 | 1.01% | -13.47% |
| BWMN | Bowman Consulting | | Industrials | 30.47 | 7 | -0.94% | -13.48% |


| Too many stocks? View smallcap stocks filtered by marketcap & sector |
| Marketcap: All SmallCap Stocks (default-no microcap), Large, Mid-Range, Small |
| Smallcap Sector: Tech, Finance, Energy, Staples, Retail, Industrial, Materials, & Medical |
|
Get the most comprehensive stock market coverage daily at 12Stocks.com ➞ Best Stocks Today ➞ Best Stocks Weekly ➞ Best Stocks Year-to-Date ➞ Best Stocks Trends ➞  Best Stocks Today 12Stocks.com Best Nasdaq Stocks ➞ Best S&P 500 Stocks ➞ Best Tech Stocks ➞ Best Biotech Stocks ➞ |
| Detailed Overview of SmallCap Stocks |
| SmallCap Technical Overview, Leaders & Laggards, Top SmallCap ETF Funds & Detailed SmallCap Stocks List, Charts, Trends & More |
| Smallcap: Technical Analysis, Trends & YTD Performance | |
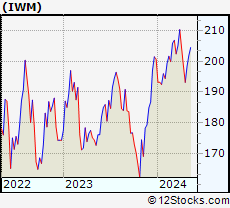
| SmallCap segment as represented by
IWM, an exchange-traded fund [ETF], holds basket of thousands of smallcap stocks from across all major sectors of the US stock market. The smallcap index (contains stocks like Riverbed & Sotheby's) is down by -0.42% and is currently underperforming the overall market by -6.01% year-to-date. Below is a quick view of technical charts and trends: | |
 IWM Weekly Chart |
|
| Long Term Trend: Not Good | |
| Medium Term Trend: Not Good | |
 IWM Daily Chart |
|
| Short Term Trend: Deteriorating | |
| Overall Trend Score: 39 | |
| YTD Performance: -0.42% | |
| **Trend Scores & Views Are Only For Educational Purposes And Not For Investing | |
| 12Stocks.com: Top Performing Small Cap Index Stocks | ||||||||||||||||||||||||||||||||||||||||||||||||
 The top performing Small Cap Index stocks year to date are
Now, more recently, over last week, the top performing Small Cap Index stocks on the move are


|
||||||||||||||||||||||||||||||||||||||||||||||||
| 12Stocks.com: Investing in Smallcap Index using Exchange Traded Funds | |
|
The following table shows list of key exchange traded funds (ETF) that
help investors track Smallcap index. The following list also includes leveraged ETF funds that track twice or thrice the daily returns of Smallcap indices. Short or inverse ETF funds move in the opposite direction to the index they track and are useful during market pullbacks or during bear markets. Quick View: Move mouse or cursor over ETF symbol (ticker) to view short-term technical chart and over ETF name to view long term chart. Click on ticker or stock name for detailed view. Click on to add stock symbol to your watchlist and to view watchlist. |
12Stocks.com List of ETFs that track Smallcap Index
| Ticker | ETF Name | Watchlist | Recent Price | Smart Investing & Trading Score | Change % | Week % | Year-to-date % |
| IWM | iShares Russell 2000 | | 199.87 | 39 | 1.81 | 0.75 | -0.42% |
| IJR | iShares Core S&P Small-Cap | | 106.30 | 50 | 1.49 | 0.62 | -1.8% |
| VTWO | Vanguard Russell 2000 ETF | | 80.62 | 7 | 1.59 | 0.5 | -0.59% |
| IWN | iShares Russell 2000 Value | | 152.63 | 50 | 1.87 | 0.98 | -1.74% |
| IWO | iShares Russell 2000 Growth | | 253.75 | 17 | 1.67 | 0.26 | 0.61% |
| IJS | iShares S&P Small-Cap 600 Value | | 97.92 | 13 | 1.58 | 0.75 | -5% |
| IJT | iShares S&P Small-Cap 600 Growth | | 126.18 | 20 | 0.99 | 0.07 | 0.83% |
| XSLV | PowerShares S&P SmallCap Low Volatil ETF | | 43.15 | 42 | 0.75 | 1.01 | -2.27% |
| SDD | ProShares UltraShort SmallCap600 | | 19.31 | 61 | -2.02 | -0.21 | 4.79% |
| SAA | ProShares Ultra SmallCap600 | | 22.93 | 25 | 1.56 | -0.46 | -8.08% |
| SMLV | SPDR SSGA US Small Cap Low Volatil ETF | | 108.63 | 30 | 1.11 | 1.04 | -3.45% |
| SBB | ProShares Short SmallCap600 | | 16.56 | 71 | 0.00 | 1.06 | 3.94% |
| 12Stocks.com: Charts, Trends, Fundamental Data and Performances of SmallCap Stocks | |
|
We now take in-depth look at all SmallCap stocks including charts, multi-period performances and overall trends (as measured by Smart Investing & Trading Score). One can sort SmallCap stocks (click link to choose) by Daily, Weekly and by Year-to-Date performances. Also, one can sort by size of the company or by market capitalization. |
| Select Your Default Chart Type: | |||||
| |||||
| Click on stock symbol or name for detailed view. Click on to add stock symbol to your watchlist and to view watchlist. Quick View: Move mouse or cursor over "Daily" to quickly view daily technical stock chart and over "Weekly" to view weekly technical stock chart. | |||||

 | AHH Armada Hoffler Properties, Inc. |
| Sector: Financials | |
| SubSector: REIT - Diversified | |
| MarketCap: 550.653 Millions | |
| Recent Price: 10.78 Smart Investing & Trading Score: 88 | |
| Day Percent Change: 1.56% Day Change: 0.17 | |
| Week Change: 1.94% Year-to-date Change: -12.9% | |
| AHH Links: Profile News Message Board | |
| Charts:- Daily , Weekly | |
| Add AHH to Watchlist: View: Get Complete AHH Trend Analysis ➞ | |
 | NRIM Northrim BanCorp, Inc. |
| Sector: Financials | |
| SubSector: Regional - Pacific Banks | |
| MarketCap: 147.629 Millions | |
| Recent Price: 49.83 Smart Investing & Trading Score: 77 | |
| Day Percent Change: 1.00% Day Change: 0.50 | |
| Week Change: 1.64% Year-to-date Change: -12.9% | |
| NRIM Links: Profile News Message Board | |
| Charts:- Daily , Weekly | |
| Add NRIM to Watchlist: View: Get Complete NRIM Trend Analysis ➞ | |
 | ABR Arbor Realty Trust, Inc. |
| Sector: Financials | |
| SubSector: Mortgage Investment | |
| MarketCap: 648.939 Millions | |
| Recent Price: 13.22 Smart Investing & Trading Score: 67 | |
| Day Percent Change: 1.89% Day Change: 0.24 | |
| Week Change: 3.08% Year-to-date Change: -12.9% | |
| ABR Links: Profile News Message Board | |
| Charts:- Daily , Weekly | |
| Add ABR to Watchlist: View: Get Complete ABR Trend Analysis ➞ | |
 | HTH Hilltop Holdings Inc. |
| Sector: Financials | |
| SubSector: Mortgage Investment | |
| MarketCap: 1317.89 Millions | |
| Recent Price: 30.65 Smart Investing & Trading Score: 57 | |
| Day Percent Change: 1.66% Day Change: 0.50 | |
| Week Change: 0.96% Year-to-date Change: -13.0% | |
| HTH Links: Profile News Message Board | |
| Charts:- Daily , Weekly | |
| Add HTH to Watchlist: View: Get Complete HTH Trend Analysis ➞ | |
 | BBUC Brookfield Business Corporation |
| Sector: Financials | |
| SubSector: Asset Management | |
| MarketCap: 1810 Millions | |
| Recent Price: 20.18 Smart Investing & Trading Score: 10 | |
| Day Percent Change: -0.76% Day Change: -0.16 | |
| Week Change: -2.63% Year-to-date Change: -13.0% | |
| BBUC Links: Profile News Message Board | |
| Charts:- Daily , Weekly | |
| Add BBUC to Watchlist: View: Get Complete BBUC Trend Analysis ➞ | |
 | AEIS Advanced Energy Industries, Inc. |
| Sector: Technology | |
| SubSector: Diversified Electronics | |
| MarketCap: 1641.86 Millions | |
| Recent Price: 94.80 Smart Investing & Trading Score: 17 | |
| Day Percent Change: -1.34% Day Change: -1.28 | |
| Week Change: -1.21% Year-to-date Change: -13.0% | |
| AEIS Links: Profile News Message Board | |
| Charts:- Daily , Weekly | |
| Add AEIS to Watchlist: View: Get Complete AEIS Trend Analysis ➞ | |
 | WRBY Warby Parker Inc. |
| Sector: Health Care | |
| SubSector: Medical Instruments & Supplies | |
| MarketCap: 1380 Millions | |
| Recent Price: 12.28 Smart Investing & Trading Score: 15 | |
| Day Percent Change: 2.46% Day Change: 0.29 | |
| Week Change: -4.99% Year-to-date Change: -13.0% | |
| WRBY Links: Profile News Message Board | |
| Charts:- Daily , Weekly | |
| Add WRBY to Watchlist: View: Get Complete WRBY Trend Analysis ➞ | |
 | EVTC EVERTEC, Inc. |
| Sector: Technology | |
| SubSector: Business Software & Services | |
| MarketCap: 1646.08 Millions | |
| Recent Price: 35.62 Smart Investing & Trading Score: 0 | |
| Day Percent Change: -5.32% Day Change: -2.00 | |
| Week Change: -7.31% Year-to-date Change: -13.0% | |
| EVTC Links: Profile News Message Board | |
| Charts:- Daily , Weekly | |
| Add EVTC to Watchlist: View: Get Complete EVTC Trend Analysis ➞ | |
 | ASTE Astec Industries, Inc. |
| Sector: Industrials | |
| SubSector: Farm & Construction Machinery | |
| MarketCap: 731.607 Millions | |
| Recent Price: 32.35 Smart Investing & Trading Score: 0 | |
| Day Percent Change: -4.20% Day Change: -1.42 | |
| Week Change: -24.13% Year-to-date Change: -13.0% | |
| ASTE Links: Profile News Message Board | |
| Charts:- Daily , Weekly | |
| Add ASTE to Watchlist: View: Get Complete ASTE Trend Analysis ➞ | |
 | TRNO Terreno Realty Corporation |
| Sector: Financials | |
| SubSector: REIT - Industrial | |
| MarketCap: 3359.69 Millions | |
| Recent Price: 54.50 Smart Investing & Trading Score: 10 | |
| Day Percent Change: 0.41% Day Change: 0.22 | |
| Week Change: 0.68% Year-to-date Change: -13.0% | |
| TRNO Links: Profile News Message Board | |
| Charts:- Daily , Weekly | |
| Add TRNO to Watchlist: View: Get Complete TRNO Trend Analysis ➞ | |
 | RXO RXO, Inc. |
| Sector: Industrials | |
| SubSector: Trucking | |
| MarketCap: 2550 Millions | |
| Recent Price: 20.32 Smart Investing & Trading Score: 49 | |
| Day Percent Change: 6.95% Day Change: 1.32 | |
| Week Change: 4.96% Year-to-date Change: -13.1% | |
| RXO Links: Profile News Message Board | |
| Charts:- Daily , Weekly | |
| Add RXO to Watchlist: View: Get Complete RXO Trend Analysis ➞ | |
 | HI Hillenbrand, Inc. |
| Sector: Industrials | |
| SubSector: Diversified Machinery | |
| MarketCap: 1389.86 Millions | |
| Recent Price: 41.60 Smart Investing & Trading Score: 0 | |
| Day Percent Change: 0.41% Day Change: 0.17 | |
| Week Change: -15.81% Year-to-date Change: -13.1% | |
| HI Links: Profile News Message Board | |
| Charts:- Daily , Weekly | |
| Add HI to Watchlist: View: Get Complete HI Trend Analysis ➞ | |
 | ALEX Alexander & Baldwin, Inc. |
| Sector: Financials | |
| SubSector: Real Estate Development | |
| MarketCap: 751.419 Millions | |
| Recent Price: 16.52 Smart Investing & Trading Score: 100 | |
| Day Percent Change: 0.33% Day Change: 0.05 | |
| Week Change: 2.07% Year-to-date Change: -13.1% | |
| ALEX Links: Profile News Message Board | |
| Charts:- Daily , Weekly | |
| Add ALEX to Watchlist: View: Get Complete ALEX Trend Analysis ➞ | |
 | MIRM Mirum Pharmaceuticals, Inc. |
| Sector: Health Care | |
| SubSector: Biotechnology | |
| MarketCap: 309.585 Millions | |
| Recent Price: 25.62 Smart Investing & Trading Score: 52 | |
| Day Percent Change: -0.39% Day Change: -0.10 | |
| Week Change: 4.74% Year-to-date Change: -13.2% | |
| MIRM Links: Profile News Message Board | |
| Charts:- Daily , Weekly | |
| Add MIRM to Watchlist: View: Get Complete MIRM Trend Analysis ➞ | |
 | BTAI BioXcel Therapeutics, Inc. |
| Sector: Health Care | |
| SubSector: Biotechnology | |
| MarketCap: 487.485 Millions | |
| Recent Price: 2.56 Smart Investing & Trading Score: 10 | |
| Day Percent Change: 0.79% Day Change: 0.02 | |
| Week Change: -2.66% Year-to-date Change: -13.2% | |
| BTAI Links: Profile News Message Board | |
| Charts:- Daily , Weekly | |
| Add BTAI to Watchlist: View: Get Complete BTAI Trend Analysis ➞ | |
 | ARI Apollo Commercial Real Estate Finance, Inc. |
| Sector: Financials | |
| SubSector: Mortgage Investment | |
| MarketCap: 1302.19 Millions | |
| Recent Price: 10.19 Smart Investing & Trading Score: 17 | |
| Day Percent Change: 1.85% Day Change: 0.19 | |
| Week Change: -5.69% Year-to-date Change: -13.3% | |
| ARI Links: Profile News Message Board | |
| Charts:- Daily , Weekly | |
| Add ARI to Watchlist: View: Get Complete ARI Trend Analysis ➞ | |
 | THFF First Financial Corporation |
| Sector: Financials | |
| SubSector: Regional - Midwest Banks | |
| MarketCap: 433.07 Millions | |
| Recent Price: 37.31 Smart Investing & Trading Score: 67 | |
| Day Percent Change: 2.44% Day Change: 0.89 | |
| Week Change: 1.22% Year-to-date Change: -13.3% | |
| THFF Links: Profile News Message Board | |
| Charts:- Daily , Weekly | |
| Add THFF to Watchlist: View: Get Complete THFF Trend Analysis ➞ | |
 | PLBC Plumas Bancorp |
| Sector: Financials | |
| SubSector: Regional - Pacific Banks | |
| MarketCap: 85.0829 Millions | |
| Recent Price: 35.83 Smart Investing & Trading Score: 86 | |
| Day Percent Change: -0.19% Day Change: -0.07 | |
| Week Change: 1.44% Year-to-date Change: -13.4% | |
| PLBC Links: Profile News Message Board | |
| Charts:- Daily , Weekly | |
| Add PLBC to Watchlist: View: Get Complete PLBC Trend Analysis ➞ | |
 | HBNC Horizon Bancorp, Inc. |
| Sector: Financials | |
| SubSector: Regional - Northeast Banks | |
| MarketCap: 405.999 Millions | |
| Recent Price: 12.40 Smart Investing & Trading Score: 100 | |
| Day Percent Change: 1.89% Day Change: 0.23 | |
| Week Change: 6.35% Year-to-date Change: -13.4% | |
| HBNC Links: Profile News Message Board | |
| Charts:- Daily , Weekly | |
| Add HBNC to Watchlist: View: Get Complete HBNC Trend Analysis ➞ | |
 | ONTF ON24, Inc. |
| Sector: Technology | |
| SubSector: Software - Application | |
| MarketCap: 386 Millions | |
| Recent Price: 6.83 Smart Investing & Trading Score: 54 | |
| Day Percent Change: -0.15% Day Change: -0.01 | |
| Week Change: 1.34% Year-to-date Change: -13.4% | |
| ONTF Links: Profile News Message Board | |
| Charts:- Daily , Weekly | |
| Add ONTF to Watchlist: View: Get Complete ONTF Trend Analysis ➞ | |
 | PDLB PDL Community Bancorp |
| Sector: Financials | |
| SubSector: REIT - Retail | |
| MarketCap: 206.114 Millions | |
| Recent Price: 8.45 Smart Investing & Trading Score: 57 | |
| Day Percent Change: 0.00% Day Change: 0.00 | |
| Week Change: 3.68% Year-to-date Change: -13.4% | |
| PDLB Links: Profile News Message Board | |
| Charts:- Daily , Weekly | |
| Add PDLB to Watchlist: View: Get Complete PDLB Trend Analysis ➞ | |
 | UPWK Upwork Inc. |
| Sector: Technology | |
| SubSector: Internet Information Providers | |
| MarketCap: 815.98 Millions | |
| Recent Price: 12.88 Smart Investing & Trading Score: 64 | |
| Day Percent Change: 7.65% Day Change: 0.91 | |
| Week Change: 11.38% Year-to-date Change: -13.4% | |
| UPWK Links: Profile News Message Board | |
| Charts:- Daily , Weekly | |
| Add UPWK to Watchlist: View: Get Complete UPWK Trend Analysis ➞ | |
 | CBU Community Bank System, Inc. |
| Sector: Financials | |
| SubSector: Regional - Midwest Banks | |
| MarketCap: 2787.8 Millions | |
| Recent Price: 45.10 Smart Investing & Trading Score: 80 | |
| Day Percent Change: 1.78% Day Change: 0.79 | |
| Week Change: 1.03% Year-to-date Change: -13.5% | |
| CBU Links: Profile News Message Board | |
| Charts:- Daily , Weekly | |
| Add CBU to Watchlist: View: Get Complete CBU Trend Analysis ➞ | |
 | MPB Mid Penn Bancorp, Inc. |
| Sector: Financials | |
| SubSector: Regional - Northeast Banks | |
| MarketCap: 187.699 Millions | |
| Recent Price: 21.01 Smart Investing & Trading Score: 50 | |
| Day Percent Change: 1.01% Day Change: 0.21 | |
| Week Change: 0.72% Year-to-date Change: -13.5% | |
| MPB Links: Profile News Message Board | |
| Charts:- Daily , Weekly | |
| Add MPB to Watchlist: View: Get Complete MPB Trend Analysis ➞ | |
 | BWMN Bowman Consulting Group Ltd. |
| Sector: Industrials | |
| SubSector: Engineering & Construction | |
| MarketCap: 443 Millions | |
| Recent Price: 30.47 Smart Investing & Trading Score: 7 | |
| Day Percent Change: -0.94% Day Change: -0.29 | |
| Week Change: -7.54% Year-to-date Change: -13.5% | |
| BWMN Links: Profile News Message Board | |
| Charts:- Daily , Weekly | |
| Add BWMN to Watchlist: View: Get Complete BWMN Trend Analysis ➞ | |
| Too many stocks? View smallcap stocks filtered by marketcap & sector |
| Marketcap: All SmallCap Stocks (default-no microcap), Large, Mid-Range, Small & MicroCap |
| Sector: Tech, Finance, Energy, Staples, Retail, Industrial, Materials, Utilities & Medical |
|
Best Stocks Today 12Stocks.com |
© 2024 12Stocks.com Terms & Conditions Privacy Contact Us
All Information Provided Only For Education And Not To Be Used For Investing or Trading. See Terms & Conditions


One More Thing ... Get Best Stocks Delivered Daily!
Never Ever Miss A Move With Our Top Ten Stocks Lists
Find Best Stocks In Any Market - Bull or Bear Market
Take A Peek At Our Top Ten Stocks Lists: Daily, Weekly, Year-to-Date & Top Trends
Find Best Stocks In Any Market - Bull or Bear Market
Take A Peek At Our Top Ten Stocks Lists: Daily, Weekly, Year-to-Date & Top Trends
Smallcap Stocks With Best Up Trends [0-bearish to 100-bullish]: Emergent BioSolutions[100], Aspen Aerogels[100], Perdoceo Education[100], Gannett Co[100], Pitney Bowes[100], Origin Materials[100], Benchmark Electronics[100], Blueprint Medicines[100], FormFactor [100], Lantheus [100], Tronox [100]
Best Smallcap Stocks Year-to-Date:
Janux [440.16%], Viking [306.07%], Longboard [258.92%], Alpine Immune[239.44%], Bakkt [187.89%], Avidity Biosciences[184.07%], Arcutis Bio[171.83%], Vera [170.74%], Cullinan Oncology[169.74%], Super Micro[159.59%], Y-mAbs [153.08%] Best Smallcap Stocks This Week:
Deciphera [73.24%], Emergent BioSolutions[69.53%], Aspen Aerogels[47.24%], Eyenovia [45.27%], P3 Health[38.51%], Carvana Co[37.82%], Origin Materials[36.24%], Poseida [34.98%], Cue Biopharma[34.07%], Surmodics [33.44%], TransMedics Group[33.23%] Best Smallcap Stocks Daily:
Emergent BioSolutions[68.65%], Aspen Aerogels[55.75%], Carvana Co[33.42%], Enovix [31.06%], Perdoceo Education[28.82%], Office Properties[28.50%], Gannett Co[26.14%], Pitney Bowes[23.99%], Sunnova Energy[23.23%], Pulmonx [20.21%], CommScope Holding[19.80%]