
 Login Sign Up


| |||||
 |  | ||||

| 12Stocks.com Market Intelligence |
Best SmallCap Stocks
|
| In a hurry? Small Cap Stock Lists: Performance Trends Table, Stock Charts
Sort Small Cap stocks: Daily, Weekly, Year-to-Date, Market Cap & Trends. Filter Small Cap stocks list by sector: Show all, Tech, Finance, Energy, Staples, Retail, Industrial, Materials, Utilities and HealthCare Filter Small Cap stocks list by size: All Large Medium Small and MicroCap |
| 12Stocks.com Small Cap Stocks Performances & Trends Daily | |||||||||
|
|  The overall Smart Investing & Trading Score is 69 (0-bearish to 100-bullish) which puts Small Cap index in short term neutral to bullish trend. The Smart Investing & Trading Score from previous trading session is 49 and hence an improvement of trend.
| ||||||||
Here are the Smart Investing & Trading Scores of the most requested small cap stocks at 12Stocks.com (click stock name for detailed review):
|


| 12Stocks.com: Investing in Smallcap Index with Stocks | |
|
The following table helps investors and traders sort through current performance and trends (as measured by Smart Investing & Trading Score) of various
stocks in the Smallcap Index. Quick View: Move mouse or cursor over stock symbol (ticker) to view short-term technical chart and over stock name to view long term chart. Click on  to add stock symbol to your watchlist and to add stock symbol to your watchlist and  to view watchlist. Click on any ticker or stock name for detailed market intelligence report for that stock. to view watchlist. Click on any ticker or stock name for detailed market intelligence report for that stock. |
12Stocks.com Performance of Stocks in Smallcap Index
| Ticker | Stock Name | Watchlist | Category | Recent Price | Smart Investing & Trading Score | Change % | YTD Change% |
| MEI | Methode Electronics |   | Technology | 12.34 | 54 | 0.57% | -45.71% |
| EVGO | EVgo | | Services & Goods | 1.95 | 59 | 3.46% | -45.75% |
| EHTH | eHealth | | Financials | 4.72 | 49 | 2.61% | -45.87% |
| DZSI | DASAN Zhone | | Technology | 1.06 | 42 | 6.50% | -45.94% |
| EVC | Entravision | | Services & Goods | 2.25 | 57 | -2.17% | -46.04% |
| LNZA | LanzaTech Global | | Industrials | 2.67 | 52 | 6.18% | -46.11% |
| NRGV | Energy Vault | | Utilities | 1.25 | 57 | -0.79% | -46.14% |
| OPFI | OppFi | | Financials | 2.75 | 42 | -1.08% | -46.18% |
| EMBC | Embecta | | Health Care | 10.26 | 60 | 0.20% | -46.30% |
| PETS | PetMed Express | | Health Care | 4.05 | 52 | 1.76% | -46.43% |
| SSP | E.W. Scripps | | Services & Goods | 4.27 | 100 | 1.18% | -46.56% |
| SSTI | ShotSpotter | | Technology | 13.48 | 52 | -0.07% | -47.22% |
| NVRO | Nevro | | Health Care | 11.29 | 52 | 1.26% | -47.54% |
| CRNC | Cerence | | Technology | 10.15 | 42 | 4.21% | -48.37% |
| MASS | 908 Devices | | Health Care | 5.76 | 49 | 2.13% | -48.57% |
| IRON | Disc Medicine | | Health Care | 29.80 | 49 | 3.29% | -48.63% |
| BIRD | Allbirds | | Services & Goods | 0.63 | 57 | 2.62% | -49.10% |
| XMTR | Xometry | | Industrials | 18.50 | 64 | 2.78% | -49.63% |
| CMP | Compass Minerals | | Materials | 12.75 | 52 | 0.31% | -49.64% |
| ALTI | AlTi Global | | Financials | 4.57 | 10 | -6.84% | -49.67% |
| NDLS | Noodles & | | Services & Goods | 1.58 | 54 | 1.28% | -49.84% |
| FRPH | FRP | | Financials | 31.00 | 39 | 1.54% | -50.70% |
| COUR | Coursera | | Consumer Staples | 9.67 | 17 | 0.62% | -50.83% |
| UONEK | Urban One | | Services & Goods | 1.67 | 52 | 7.74% | -51.45% |
| SPWR | SunPower | | Technology | 2.34 | 59 | 7.34% | -51.55% |


| Too many stocks? View smallcap stocks filtered by marketcap & sector |
| Marketcap: All SmallCap Stocks (default-no microcap), Large, Mid-Range, Small |
| Smallcap Sector: Tech, Finance, Energy, Staples, Retail, Industrial, Materials, & Medical |
|
Get the most comprehensive stock market coverage daily at 12Stocks.com ➞ Best Stocks Today ➞ Best Stocks Weekly ➞ Best Stocks Year-to-Date ➞ Best Stocks Trends ➞  Best Stocks Today 12Stocks.com Best Nasdaq Stocks ➞ Best S&P 500 Stocks ➞ Best Tech Stocks ➞ Best Biotech Stocks ➞ |
| Detailed Overview of SmallCap Stocks |
| SmallCap Technical Overview, Leaders & Laggards, Top SmallCap ETF Funds & Detailed SmallCap Stocks List, Charts, Trends & More |
| Smallcap: Technical Analysis, Trends & YTD Performance | |
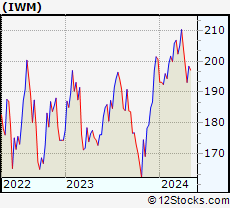
| SmallCap segment as represented by
IWM, an exchange-traded fund [ETF], holds basket of thousands of smallcap stocks from across all major sectors of the US stock market. The smallcap index (contains stocks like Riverbed & Sotheby's) is up by 0.59% and is currently underperforming the overall market by -6.29% year-to-date. Below is a quick view of technical charts and trends: | |
 IWM Weekly Chart |
|
| Long Term Trend: Not Good | |
| Medium Term Trend: Very Good | |
 IWM Daily Chart |
|
| Short Term Trend: Very Good | |
| Overall Trend Score: 69 | |
| YTD Performance: 0.59% | |
| **Trend Scores & Views Are Only For Educational Purposes And Not For Investing | |
| 12Stocks.com: Top Performing Small Cap Index Stocks | ||||||||||||||||||||||||||||||||||||||||||||||||
 The top performing Small Cap Index stocks year to date are
Now, more recently, over last week, the top performing Small Cap Index stocks on the move are


|
||||||||||||||||||||||||||||||||||||||||||||||||
| 12Stocks.com: Investing in Smallcap Index using Exchange Traded Funds | |
|
The following table shows list of key exchange traded funds (ETF) that
help investors track Smallcap index. The following list also includes leveraged ETF funds that track twice or thrice the daily returns of Smallcap indices. Short or inverse ETF funds move in the opposite direction to the index they track and are useful during market pullbacks or during bear markets. Quick View: Move mouse or cursor over ETF symbol (ticker) to view short-term technical chart and over ETF name to view long term chart. Click on ticker or stock name for detailed view. Click on to add stock symbol to your watchlist and to view watchlist. |
12Stocks.com List of ETFs that track Smallcap Index
| Ticker | ETF Name | Watchlist | Recent Price | Smart Investing & Trading Score | Change % | Week % | Year-to-date % |
| IWM | iShares Russell 2000 | | 201.90 | 69 | 0.99 | 1.77 | 0.59% |
| IJR | iShares Core S&P Small-Cap | | 107.13 | 82 | 0.75 | 1.4 | -1.03% |
| VTWO | Vanguard Russell 2000 ETF | | 81.61 | 69 | 0.94 | 1.73 | 0.63% |
| IWN | iShares Russell 2000 Value | | 154.21 | 100 | 0.87 | 2.03 | -0.72% |
| IJS | iShares S&P Small-Cap 600 Value | | 98.72 | 64 | 0.71 | 1.57 | -4.22% |
| IWO | iShares Russell 2000 Growth | | 256.87 | 57 | 0.99 | 1.49 | 1.84% |
| IJT | iShares S&P Small-Cap 600 Growth | | 127.76 | 95 | 0.82 | 1.32 | 2.09% |
| XSLV | PowerShares S&P SmallCap Low Volatil ETF | | 43.22 | 87 | 0.19 | 1.17 | -2.11% |
| SBB | ProShares Short SmallCap600 | | 16.16 | 13 | -1.28 | -1.37 | 1.44% |
| SDD | ProShares UltraShort SmallCap600 | | 18.84 | 23 | -2.41 | -2.61 | 2.27% |
| SAA | ProShares Ultra SmallCap600 | | 23.59 | 69 | 2.86 | 2.39 | -5.45% |
| SMLV | SPDR SSGA US Small Cap Low Volatil ETF | | 109.69 | 87 | 0.78 | 2.01 | -2.52% |
| 12Stocks.com: Charts, Trends, Fundamental Data and Performances of SmallCap Stocks | |
|
We now take in-depth look at all SmallCap stocks including charts, multi-period performances and overall trends (as measured by Smart Investing & Trading Score). One can sort SmallCap stocks (click link to choose) by Daily, Weekly and by Year-to-Date performances. Also, one can sort by size of the company or by market capitalization. |
| Select Your Default Chart Type: | |||||
| |||||
| Click on stock symbol or name for detailed view. Click on to add stock symbol to your watchlist and to view watchlist. Quick View: Move mouse or cursor over "Daily" to quickly view daily technical stock chart and over "Weekly" to view weekly technical stock chart. | |||||

 | MEI Methode Electronics, Inc. |
| Sector: Technology | |
| SubSector: Diversified Electronics | |
| MarketCap: 941.896 Millions | |
| Recent Price: 12.34 Smart Investing & Trading Score: 54 | |
| Day Percent Change: 0.57% Day Change: 0.07 | |
| Week Change: 0.98% Year-to-date Change: -45.7% | |
| MEI Links: Profile News Message Board | |
| Charts:- Daily , Weekly | |
| Add MEI to Watchlist: View: Get Complete MEI Trend Analysis ➞ | |
 | EVGO EVgo, Inc. |
| Sector: Services & Goods | |
| SubSector: Specialty Retail | |
| MarketCap: 1140 Millions | |
| Recent Price: 1.95 Smart Investing & Trading Score: 59 | |
| Day Percent Change: 3.46% Day Change: 0.07 | |
| Week Change: 8.06% Year-to-date Change: -45.8% | |
| EVGO Links: Profile News Message Board | |
| Charts:- Daily , Weekly | |
| Add EVGO to Watchlist: View: Get Complete EVGO Trend Analysis ➞ | |
 | EHTH eHealth, Inc. |
| Sector: Financials | |
| SubSector: Insurance Brokers | |
| MarketCap: 2813.57 Millions | |
| Recent Price: 4.72 Smart Investing & Trading Score: 49 | |
| Day Percent Change: 2.61% Day Change: 0.12 | |
| Week Change: 4.19% Year-to-date Change: -45.9% | |
| EHTH Links: Profile News Message Board | |
| Charts:- Daily , Weekly | |
| Add EHTH to Watchlist: View: Get Complete EHTH Trend Analysis ➞ | |
 | DZSI DASAN Zhone Solutions, Inc. |
| Sector: Technology | |
| SubSector: Communication Equipment | |
| MarketCap: 90.0539 Millions | |
| Recent Price: 1.06 Smart Investing & Trading Score: 42 | |
| Day Percent Change: 6.50% Day Change: 0.06 | |
| Week Change: -9.75% Year-to-date Change: -45.9% | |
| DZSI Links: Profile News Message Board | |
| Charts:- Daily , Weekly | |
| Add DZSI to Watchlist: View: Get Complete DZSI Trend Analysis ➞ | |
 | EVC Entravision Communications Corporation |
| Sector: Services & Goods | |
| SubSector: Broadcasting - TV | |
| MarketCap: 171.763 Millions | |
| Recent Price: 2.25 Smart Investing & Trading Score: 57 | |
| Day Percent Change: -2.17% Day Change: -0.05 | |
| Week Change: 7.66% Year-to-date Change: -46.0% | |
| EVC Links: Profile News Message Board | |
| Charts:- Daily , Weekly | |
| Add EVC to Watchlist: View: Get Complete EVC Trend Analysis ➞ | |
 | LNZA LanzaTech Global, Inc. |
| Sector: Industrials | |
| SubSector: Waste Management | |
| MarketCap: 1340 Millions | |
| Recent Price: 2.67 Smart Investing & Trading Score: 52 | |
| Day Percent Change: 6.18% Day Change: 0.16 | |
| Week Change: 19.78% Year-to-date Change: -46.1% | |
| LNZA Links: Profile News Message Board | |
| Charts:- Daily , Weekly | |
| Add LNZA to Watchlist: View: Get Complete LNZA Trend Analysis ➞ | |
 | NRGV Energy Vault Holdings, Inc. |
| Sector: Utilities | |
| SubSector: Utilities - Renewable | |
| MarketCap: 364 Millions | |
| Recent Price: 1.25 Smart Investing & Trading Score: 57 | |
| Day Percent Change: -0.79% Day Change: -0.01 | |
| Week Change: -0.4% Year-to-date Change: -46.1% | |
| NRGV Links: Profile News Message Board | |
| Charts:- Daily , Weekly | |
| Add NRGV to Watchlist: View: Get Complete NRGV Trend Analysis ➞ | |
 | OPFI OppFi Inc. |
| Sector: Financials | |
| SubSector: Credit Services | |
| MarketCap: 226 Millions | |
| Recent Price: 2.75 Smart Investing & Trading Score: 42 | |
| Day Percent Change: -1.08% Day Change: -0.03 | |
| Week Change: 3.38% Year-to-date Change: -46.2% | |
| OPFI Links: Profile News Message Board | |
| Charts:- Daily , Weekly | |
| Add OPFI to Watchlist: View: Get Complete OPFI Trend Analysis ➞ | |
 | EMBC Embecta Corp. |
| Sector: Health Care | |
| SubSector: Medical Instruments & Supplies | |
| MarketCap: 1260 Millions | |
| Recent Price: 10.26 Smart Investing & Trading Score: 60 | |
| Day Percent Change: 0.20% Day Change: 0.02 | |
| Week Change: -0.48% Year-to-date Change: -46.3% | |
| EMBC Links: Profile News Message Board | |
| Charts:- Daily , Weekly | |
| Add EMBC to Watchlist: View: Get Complete EMBC Trend Analysis ➞ | |
 | PETS PetMed Express, Inc. |
| Sector: Health Care | |
| SubSector: Drug Delivery | |
| MarketCap: 528.23 Millions | |
| Recent Price: 4.05 Smart Investing & Trading Score: 52 | |
| Day Percent Change: 1.76% Day Change: 0.07 | |
| Week Change: 0.75% Year-to-date Change: -46.4% | |
| PETS Links: Profile News Message Board | |
| Charts:- Daily , Weekly | |
| Add PETS to Watchlist: View: Get Complete PETS Trend Analysis ➞ | |
 | SSP The E.W. Scripps Company |
| Sector: Services & Goods | |
| SubSector: Broadcasting - TV | |
| MarketCap: 766.163 Millions | |
| Recent Price: 4.27 Smart Investing & Trading Score: 100 | |
| Day Percent Change: 1.18% Day Change: 0.05 | |
| Week Change: 15.41% Year-to-date Change: -46.6% | |
| SSP Links: Profile News Message Board | |
| Charts:- Daily , Weekly | |
| Add SSP to Watchlist: View: Get Complete SSP Trend Analysis ➞ | |
 | SSTI ShotSpotter, Inc. |
| Sector: Technology | |
| SubSector: Application Software | |
| MarketCap: 353.062 Millions | |
| Recent Price: 13.48 Smart Investing & Trading Score: 52 | |
| Day Percent Change: -0.07% Day Change: -0.01 | |
| Week Change: -1.39% Year-to-date Change: -47.2% | |
| SSTI Links: Profile News Message Board | |
| Charts:- Daily , Weekly | |
| Add SSTI to Watchlist: View: Get Complete SSTI Trend Analysis ➞ | |
 | NVRO Nevro Corp. |
| Sector: Health Care | |
| SubSector: Medical Appliances & Equipment | |
| MarketCap: 2489.3 Millions | |
| Recent Price: 11.29 Smart Investing & Trading Score: 52 | |
| Day Percent Change: 1.26% Day Change: 0.14 | |
| Week Change: -0.27% Year-to-date Change: -47.5% | |
| NVRO Links: Profile News Message Board | |
| Charts:- Daily , Weekly | |
| Add NVRO to Watchlist: View: Get Complete NVRO Trend Analysis ➞ | |
 | CRNC Cerence Inc. |
| Sector: Technology | |
| SubSector: Application Software | |
| MarketCap: 640.662 Millions | |
| Recent Price: 10.15 Smart Investing & Trading Score: 42 | |
| Day Percent Change: 4.21% Day Change: 0.41 | |
| Week Change: 4.53% Year-to-date Change: -48.4% | |
| CRNC Links: Profile News Message Board | |
| Charts:- Daily , Weekly | |
| Add CRNC to Watchlist: View: Get Complete CRNC Trend Analysis ➞ | |
 | MASS 908 Devices Inc. |
| Sector: Health Care | |
| SubSector: Medical Devices | |
| MarketCap: 225 Millions | |
| Recent Price: 5.76 Smart Investing & Trading Score: 49 | |
| Day Percent Change: 2.13% Day Change: 0.12 | |
| Week Change: 1.59% Year-to-date Change: -48.6% | |
| MASS Links: Profile News Message Board | |
| Charts:- Daily , Weekly | |
| Add MASS to Watchlist: View: Get Complete MASS Trend Analysis ➞ | |
 | IRON Disc Medicine Opco Inc |
| Sector: Health Care | |
| SubSector: Biotechnology | |
| MarketCap: 1100 Millions | |
| Recent Price: 29.80 Smart Investing & Trading Score: 49 | |
| Day Percent Change: 3.29% Day Change: 0.95 | |
| Week Change: 8.34% Year-to-date Change: -48.6% | |
| IRON Links: Profile News Message Board | |
| Charts:- Daily , Weekly | |
| Add IRON to Watchlist: View: Get Complete IRON Trend Analysis ➞ | |
 | BIRD Allbirds, Inc. |
| Sector: Services & Goods | |
| SubSector: Apparel Retail | |
| MarketCap: 184 Millions | |
| Recent Price: 0.63 Smart Investing & Trading Score: 57 | |
| Day Percent Change: 2.62% Day Change: 0.02 | |
| Week Change: 2.2% Year-to-date Change: -49.1% | |
| BIRD Links: Profile News Message Board | |
| Charts:- Daily , Weekly | |
| Add BIRD to Watchlist: View: Get Complete BIRD Trend Analysis ➞ | |
 | XMTR Xometry, Inc. |
| Sector: Industrials | |
| SubSector: Specialty Industrial Machinery | |
| MarketCap: 1050 Millions | |
| Recent Price: 18.50 Smart Investing & Trading Score: 64 | |
| Day Percent Change: 2.78% Day Change: 0.50 | |
| Week Change: 5.59% Year-to-date Change: -49.6% | |
| XMTR Links: Profile News Message Board | |
| Charts:- Daily , Weekly | |
| Add XMTR to Watchlist: View: Get Complete XMTR Trend Analysis ➞ | |
 | CMP Compass Minerals International, Inc. |
| Sector: Materials | |
| SubSector: Industrial Metals & Minerals | |
| MarketCap: 1512.1 Millions | |
| Recent Price: 12.75 Smart Investing & Trading Score: 52 | |
| Day Percent Change: 0.31% Day Change: 0.04 | |
| Week Change: -2.22% Year-to-date Change: -49.6% | |
| CMP Links: Profile News Message Board | |
| Charts:- Daily , Weekly | |
| Add CMP to Watchlist: View: Get Complete CMP Trend Analysis ➞ | |
 | ALTI AlTi Global, Inc. |
| Sector: Financials | |
| SubSector: Asset Management | |
| MarketCap: 917 Millions | |
| Recent Price: 4.57 Smart Investing & Trading Score: 10 | |
| Day Percent Change: -6.84% Day Change: -0.33 | |
| Week Change: -3.69% Year-to-date Change: -49.7% | |
| ALTI Links: Profile News Message Board | |
| Charts:- Daily , Weekly | |
| Add ALTI to Watchlist: View: Get Complete ALTI Trend Analysis ➞ | |
 | NDLS Noodles & Company |
| Sector: Services & Goods | |
| SubSector: Restaurants | |
| MarketCap: 188.77 Millions | |
| Recent Price: 1.58 Smart Investing & Trading Score: 54 | |
| Day Percent Change: 1.28% Day Change: 0.02 | |
| Week Change: 12.86% Year-to-date Change: -49.8% | |
| NDLS Links: Profile News Message Board | |
| Charts:- Daily , Weekly | |
| Add NDLS to Watchlist: View: Get Complete NDLS Trend Analysis ➞ | |
 | FRPH FRP Holdings, Inc. |
| Sector: Financials | |
| SubSector: Property Management | |
| MarketCap: 374.442 Millions | |
| Recent Price: 31.00 Smart Investing & Trading Score: 39 | |
| Day Percent Change: 1.54% Day Change: 0.47 | |
| Week Change: 1.87% Year-to-date Change: -50.7% | |
| FRPH Links: Profile News Message Board | |
| Charts:- Daily , Weekly | |
| Add FRPH to Watchlist: View: Get Complete FRPH Trend Analysis ➞ | |
 | COUR Coursera, Inc. |
| Sector: Consumer Staples | |
| SubSector: Education & Training Services | |
| MarketCap: 1990 Millions | |
| Recent Price: 9.67 Smart Investing & Trading Score: 17 | |
| Day Percent Change: 0.62% Day Change: 0.06 | |
| Week Change: -19.21% Year-to-date Change: -50.8% | |
| COUR Links: Profile News Message Board | |
| Charts:- Daily , Weekly | |
| Add COUR to Watchlist: View: Get Complete COUR Trend Analysis ➞ | |
 | UONEK Urban One, Inc. |
| Sector: Services & Goods | |
| SubSector: Broadcasting - Radio | |
| MarketCap: 601.795 Millions | |
| Recent Price: 1.67 Smart Investing & Trading Score: 52 | |
| Day Percent Change: 7.74% Day Change: 0.12 | |
| Week Change: 8.44% Year-to-date Change: -51.5% | |
| UONEK Links: Profile News Message Board | |
| Charts:- Daily , Weekly | |
| Add UONEK to Watchlist: View: Get Complete UONEK Trend Analysis ➞ | |
 | SPWR SunPower Corporation |
| Sector: Technology | |
| SubSector: Semiconductor - Specialized | |
| MarketCap: 1202.6 Millions | |
| Recent Price: 2.34 Smart Investing & Trading Score: 59 | |
| Day Percent Change: 7.34% Day Change: 0.16 | |
| Week Change: 17.59% Year-to-date Change: -51.6% | |
| SPWR Links: Profile News Message Board | |
| Charts:- Daily , Weekly | |
| Add SPWR to Watchlist: View: Get Complete SPWR Trend Analysis ➞ | |
| Too many stocks? View smallcap stocks filtered by marketcap & sector |
| Marketcap: All SmallCap Stocks (default-no microcap), Large, Mid-Range, Small & MicroCap |
| Sector: Tech, Finance, Energy, Staples, Retail, Industrial, Materials, Utilities & Medical |
|
Best Stocks Today 12Stocks.com |
© 2024 12Stocks.com Terms & Conditions Privacy Contact Us
All Information Provided Only For Education And Not To Be Used For Investing or Trading. See Terms & Conditions


One More Thing ... Get Best Stocks Delivered Daily!
Never Ever Miss A Move With Our Top Ten Stocks Lists
Find Best Stocks In Any Market - Bull or Bear Market
Take A Peek At Our Top Ten Stocks Lists: Daily, Weekly, Year-to-Date & Top Trends
Find Best Stocks In Any Market - Bull or Bear Market
Take A Peek At Our Top Ten Stocks Lists: Daily, Weekly, Year-to-Date & Top Trends
Smallcap Stocks With Best Up Trends [0-bearish to 100-bullish]: Twist Bioscience[100], WideOpenWest [100], Joint [100], FTC Solar[100], Origin Materials[100], Alignment Healthcare[100], Clarus [100], IES [100], Emergent BioSolutions[100], Enovix [100], El Pollo[100]
Best Smallcap Stocks Year-to-Date:
Janux [482.74%], Viking [313.59%], Longboard [272.5%], Alpine Immune[239.29%], Bakkt [199.55%], Avidity Biosciences[192.48%], Vera [189.47%], Cullinan Oncology[176.9%], Super Micro[175.35%], Y-mAbs [151.47%], Sana [149.33%] Best Smallcap Stocks This Week:
Emergent BioSolutions[102.6%], Deciphera [73.24%], Origin Materials[66.52%], Eyenovia [60.78%], Cue Biopharma[56.04%], Aspen Aerogels[55.96%], Enovix [54.02%], Luna Innovations[53.77%], Codexis [47.37%], Carvana Co[44.31%], Office Properties[42.79%] Best Smallcap Stocks Daily:
Luna Innovations[36.00%], Twist Bioscience[28.74%], Ardelyx [28.42%], WideOpenWest [28.23%], 2U [26.63%], Joint [25.35%], FTC Solar[25.09%], Origin Materials[22.23%], Alignment Healthcare[21.97%], Clarus [18.67%], Aurora Innovation[18.09%]