
 Login Sign Up


| |||||
 |  | ||||

| 12Stocks.com Market Intelligence |
Best SmallCap Stocks
|
| In a hurry? Small Cap Stock Lists: Performance Trends Table, Stock Charts
Sort Small Cap stocks: Daily, Weekly, Year-to-Date, Market Cap & Trends. Filter Small Cap stocks list by sector: Show all, Tech, Finance, Energy, Staples, Retail, Industrial, Materials, Utilities and HealthCare Filter Small Cap stocks list by size: All Large Medium Small and MicroCap |
| 12Stocks.com Small Cap Stocks Performances & Trends Daily | |||||||||
|
|  The overall Smart Investing & Trading Score is 39 (0-bearish to 100-bullish) which puts Small Cap index in short term bearish to neutral trend. The Smart Investing & Trading Score from previous trading session is 14 and hence an improvement of trend.
| ||||||||
Here are the Smart Investing & Trading Scores of the most requested small cap stocks at 12Stocks.com (click stock name for detailed review):
|


| 12Stocks.com: Investing in Smallcap Index with Stocks | |
|
The following table helps investors and traders sort through current performance and trends (as measured by Smart Investing & Trading Score) of various
stocks in the Smallcap Index. Quick View: Move mouse or cursor over stock symbol (ticker) to view short-term technical chart and over stock name to view long term chart. Click on  to add stock symbol to your watchlist and to add stock symbol to your watchlist and  to view watchlist. Click on any ticker or stock name for detailed market intelligence report for that stock. to view watchlist. Click on any ticker or stock name for detailed market intelligence report for that stock. |
12Stocks.com Performance of Stocks in Smallcap Index
| Ticker | Stock Name | Watchlist | Category | Recent Price | Smart Investing & Trading Score | Change % | YTD Change% |
| LASR | nLIGHT |   | Technology | 11.60 | 64 | 2.11% | -14.07% |
| TWST | Twist Bioscience | | Health Care | 31.66 | 39 | -0.95% | -14.12% |
| TIPT | Tiptree | | Financials | 16.27 | 64 | 0.96% | -14.16% |
| MHO | M/I Homes | | Industrials | 118.22 | 25 | 1.61% | -14.18% |
| GLT | P. H. | | Consumer Staples | 1.67 | 37 | 11.74% | -14.18% |
| TNET | TriNet Group | | Services & Goods | 102.05 | 10 | 0.29% | -14.19% |
| RXT | Rackspace | | Technology | 1.72 | 37 | -0.58% | -14.21% |
| ALKS | Alkermes | | Health Care | 23.80 | 0 | -0.90% | -14.22% |
| TCBK | TriCo Bancshares | | Financials | 36.86 | 100 | 3.28% | -14.22% |
| ASIX | AdvanSix | | Materials | 25.70 | 20 | 0.74% | -14.22% |
| INSE | Inspired Entertainment | | Services & Goods | 8.47 | 20 | 0.18% | -14.22% |
| PETQ | PetIQ | | Health Care | 16.93 | 64 | 0.39% | -14.25% |
| RMR | RMR Group | | Financials | 24.20 | 42 | 0.64% | -14.26% |
| CCO | Clear Channel | | Services & Goods | 1.56 | 49 | 7.59% | -14.29% |
| WGO | Winnebago Industries | | Consumer Staples | 62.44 | 10 | 1.56% | -14.32% |
| FBNC | First Bancorp | | Financials | 31.71 | 32 | 1.47% | -14.32% |
| FMNB | Farmers National | | Financials | 12.38 | 57 | 1.23% | -14.33% |
| GT | Goodyear Tire | | Consumer Staples | 12.26 | 83 | 2.77% | -14.39% |
| MOV | Movado Group | | Consumer Staples | 25.81 | 42 | 0.82% | -14.39% |
| RXRX | Recursion | | Health Care | 8.38 | 57 | 0.60% | -14.40% |
| EGRX | Eagle | | Health Care | 4.47 | 47 | 6.80% | -14.44% |
| WD | Walker & Dunlop | | Financials | 94.97 | 57 | 2.38% | -14.45% |
| COHU | Cohu | | Technology | 30.26 | 10 | 2.23% | -14.50% |
| CAC | Camden National | | Financials | 32.16 | 87 | 1.21% | -14.52% |
| LBAI | Lakeland Bancorp | | Financials | 12.64 | 83 | 1.44% | -14.54% |


| Too many stocks? View smallcap stocks filtered by marketcap & sector |
| Marketcap: All SmallCap Stocks (default-no microcap), Large, Mid-Range, Small |
| Smallcap Sector: Tech, Finance, Energy, Staples, Retail, Industrial, Materials, & Medical |
|
Get the most comprehensive stock market coverage daily at 12Stocks.com ➞ Best Stocks Today ➞ Best Stocks Weekly ➞ Best Stocks Year-to-Date ➞ Best Stocks Trends ➞  Best Stocks Today 12Stocks.com Best Nasdaq Stocks ➞ Best S&P 500 Stocks ➞ Best Tech Stocks ➞ Best Biotech Stocks ➞ |
| Detailed Overview of SmallCap Stocks |
| SmallCap Technical Overview, Leaders & Laggards, Top SmallCap ETF Funds & Detailed SmallCap Stocks List, Charts, Trends & More |
| Smallcap: Technical Analysis, Trends & YTD Performance | |
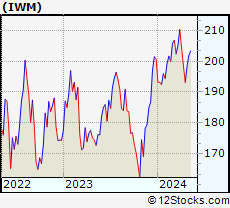
| SmallCap segment as represented by
IWM, an exchange-traded fund [ETF], holds basket of thousands of smallcap stocks from across all major sectors of the US stock market. The smallcap index (contains stocks like Riverbed & Sotheby's) is down by -0.42% and is currently underperforming the overall market by -6.01% year-to-date. Below is a quick view of technical charts and trends: | |
 IWM Weekly Chart |
|
| Long Term Trend: Not Good | |
| Medium Term Trend: Not Good | |
 IWM Daily Chart |
|
| Short Term Trend: Deteriorating | |
| Overall Trend Score: 39 | |
| YTD Performance: -0.42% | |
| **Trend Scores & Views Are Only For Educational Purposes And Not For Investing | |
| 12Stocks.com: Top Performing Small Cap Index Stocks | ||||||||||||||||||||||||||||||||||||||||||||||||
 The top performing Small Cap Index stocks year to date are
Now, more recently, over last week, the top performing Small Cap Index stocks on the move are


|
||||||||||||||||||||||||||||||||||||||||||||||||
| 12Stocks.com: Investing in Smallcap Index using Exchange Traded Funds | |
|
The following table shows list of key exchange traded funds (ETF) that
help investors track Smallcap index. The following list also includes leveraged ETF funds that track twice or thrice the daily returns of Smallcap indices. Short or inverse ETF funds move in the opposite direction to the index they track and are useful during market pullbacks or during bear markets. Quick View: Move mouse or cursor over ETF symbol (ticker) to view short-term technical chart and over ETF name to view long term chart. Click on ticker or stock name for detailed view. Click on to add stock symbol to your watchlist and to view watchlist. |
12Stocks.com List of ETFs that track Smallcap Index
| Ticker | ETF Name | Watchlist | Recent Price | Smart Investing & Trading Score | Change % | Week % | Year-to-date % |
| IWM | iShares Russell 2000 | | 199.87 | 39 | 1.81 | 0.75 | -0.42% |
| IJR | iShares Core S&P Small-Cap | | 106.30 | 50 | 1.49 | 0.62 | -1.8% |
| VTWO | Vanguard Russell 2000 ETF | | 80.62 | 7 | 1.59 | 0.5 | -0.59% |
| IWN | iShares Russell 2000 Value | | 152.63 | 50 | 1.87 | 0.98 | -1.74% |
| IWO | iShares Russell 2000 Growth | | 253.75 | 17 | 1.67 | 0.26 | 0.61% |
| IJS | iShares S&P Small-Cap 600 Value | | 97.92 | 13 | 1.58 | 0.75 | -5% |
| IJT | iShares S&P Small-Cap 600 Growth | | 126.18 | 20 | 0.99 | 0.07 | 0.83% |
| XSLV | PowerShares S&P SmallCap Low Volatil ETF | | 43.15 | 42 | 0.75 | 1.01 | -2.27% |
| SDD | ProShares UltraShort SmallCap600 | | 19.31 | 61 | -2.02 | -0.21 | 4.79% |
| SAA | ProShares Ultra SmallCap600 | | 22.93 | 25 | 1.56 | -0.46 | -8.08% |
| SMLV | SPDR SSGA US Small Cap Low Volatil ETF | | 108.63 | 30 | 1.11 | 1.04 | -3.45% |
| SBB | ProShares Short SmallCap600 | | 16.56 | 71 | 0.00 | 1.06 | 3.94% |
| 12Stocks.com: Charts, Trends, Fundamental Data and Performances of SmallCap Stocks | |
|
We now take in-depth look at all SmallCap stocks including charts, multi-period performances and overall trends (as measured by Smart Investing & Trading Score). One can sort SmallCap stocks (click link to choose) by Daily, Weekly and by Year-to-Date performances. Also, one can sort by size of the company or by market capitalization. |
| Select Your Default Chart Type: | |||||
| |||||
| Click on stock symbol or name for detailed view. Click on to add stock symbol to your watchlist and to view watchlist. Quick View: Move mouse or cursor over "Daily" to quickly view daily technical stock chart and over "Weekly" to view weekly technical stock chart. | |||||

 | LASR nLIGHT, Inc. |
| Sector: Technology | |
| SubSector: Semiconductor - Broad Line | |
| MarketCap: 445.642 Millions | |
| Recent Price: 11.60 Smart Investing & Trading Score: 64 | |
| Day Percent Change: 2.11% Day Change: 0.24 | |
| Week Change: 0.39% Year-to-date Change: -14.1% | |
| LASR Links: Profile News Message Board | |
| Charts:- Daily , Weekly | |
| Add LASR to Watchlist: View: Get Complete LASR Trend Analysis ➞ | |
 | TWST Twist Bioscience Corporation |
| Sector: Health Care | |
| SubSector: Medical Laboratories & Research | |
| MarketCap: 1065 Millions | |
| Recent Price: 31.66 Smart Investing & Trading Score: 39 | |
| Day Percent Change: -0.95% Day Change: -0.30 | |
| Week Change: 0.36% Year-to-date Change: -14.1% | |
| TWST Links: Profile News Message Board | |
| Charts:- Daily , Weekly | |
| Add TWST to Watchlist: View: Get Complete TWST Trend Analysis ➞ | |
 | TIPT Tiptree Inc. |
| Sector: Financials | |
| SubSector: Life Insurance | |
| MarketCap: 183.486 Millions | |
| Recent Price: 16.27 Smart Investing & Trading Score: 64 | |
| Day Percent Change: 0.96% Day Change: 0.15 | |
| Week Change: 1.91% Year-to-date Change: -14.2% | |
| TIPT Links: Profile News Message Board | |
| Charts:- Daily , Weekly | |
| Add TIPT to Watchlist: View: Get Complete TIPT Trend Analysis ➞ | |
 | MHO M/I Homes, Inc. |
| Sector: Industrials | |
| SubSector: Residential Construction | |
| MarketCap: 437.106 Millions | |
| Recent Price: 118.22 Smart Investing & Trading Score: 25 | |
| Day Percent Change: 1.61% Day Change: 1.88 | |
| Week Change: -1.54% Year-to-date Change: -14.2% | |
| MHO Links: Profile News Message Board | |
| Charts:- Daily , Weekly | |
| Add MHO to Watchlist: View: Get Complete MHO Trend Analysis ➞ | |
 | GLT P. H. Glatfelter Company |
| Sector: Consumer Staples | |
| SubSector: Paper & Paper Products | |
| MarketCap: 525.003 Millions | |
| Recent Price: 1.67 Smart Investing & Trading Score: 37 | |
| Day Percent Change: 11.74% Day Change: 0.18 | |
| Week Change: 11.74% Year-to-date Change: -14.2% | |
| GLT Links: Profile News Message Board | |
| Charts:- Daily , Weekly | |
| Add GLT to Watchlist: View: Get Complete GLT Trend Analysis ➞ | |
 | TNET TriNet Group, Inc. |
| Sector: Services & Goods | |
| SubSector: Business Services | |
| MarketCap: 2648.72 Millions | |
| Recent Price: 102.05 Smart Investing & Trading Score: 10 | |
| Day Percent Change: 0.29% Day Change: 0.30 | |
| Week Change: -3.47% Year-to-date Change: -14.2% | |
| TNET Links: Profile News Message Board | |
| Charts:- Daily , Weekly | |
| Add TNET to Watchlist: View: Get Complete TNET Trend Analysis ➞ | |
 | RXT Rackspace Technology, Inc. |
| Sector: Technology | |
| SubSector: Software Infrastructure | |
| MarketCap: 40287 Millions | |
| Recent Price: 1.72 Smart Investing & Trading Score: 37 | |
| Day Percent Change: -0.58% Day Change: -0.01 | |
| Week Change: -1.71% Year-to-date Change: -14.2% | |
| RXT Links: Profile News Message Board | |
| Charts:- Daily , Weekly | |
| Add RXT to Watchlist: View: Get Complete RXT Trend Analysis ➞ | |
 | ALKS Alkermes plc |
| Sector: Health Care | |
| SubSector: Biotechnology | |
| MarketCap: 2311.95 Millions | |
| Recent Price: 23.80 Smart Investing & Trading Score: 0 | |
| Day Percent Change: -0.90% Day Change: -0.21 | |
| Week Change: -3.59% Year-to-date Change: -14.2% | |
| ALKS Links: Profile News Message Board | |
| Charts:- Daily , Weekly | |
| Add ALKS to Watchlist: View: Get Complete ALKS Trend Analysis ➞ | |
 | TCBK TriCo Bancshares |
| Sector: Financials | |
| SubSector: Regional - Pacific Banks | |
| MarketCap: 875.129 Millions | |
| Recent Price: 36.86 Smart Investing & Trading Score: 100 | |
| Day Percent Change: 3.28% Day Change: 1.17 | |
| Week Change: 8.89% Year-to-date Change: -14.2% | |
| TCBK Links: Profile News Message Board | |
| Charts:- Daily , Weekly | |
| Add TCBK to Watchlist: View: Get Complete TCBK Trend Analysis ➞ | |
 | ASIX AdvanSix Inc. |
| Sector: Materials | |
| SubSector: Chemicals - Major Diversified | |
| MarketCap: 394.136 Millions | |
| Recent Price: 25.70 Smart Investing & Trading Score: 20 | |
| Day Percent Change: 0.74% Day Change: 0.19 | |
| Week Change: -1.19% Year-to-date Change: -14.2% | |
| ASIX Links: Profile News Message Board | |
| Charts:- Daily , Weekly | |
| Add ASIX to Watchlist: View: Get Complete ASIX Trend Analysis ➞ | |
 | INSE Inspired Entertainment, Inc. |
| Sector: Services & Goods | |
| SubSector: Gaming Activities | |
| MarketCap: 80.9289 Millions | |
| Recent Price: 8.47 Smart Investing & Trading Score: 20 | |
| Day Percent Change: 0.18% Day Change: 0.01 | |
| Week Change: -3.8% Year-to-date Change: -14.2% | |
| INSE Links: Profile News Message Board | |
| Charts:- Daily , Weekly | |
| Add INSE to Watchlist: View: Get Complete INSE Trend Analysis ➞ | |
 | PETQ PetIQ, Inc. |
| Sector: Health Care | |
| SubSector: Drugs - Generic | |
| MarketCap: 587.585 Millions | |
| Recent Price: 16.93 Smart Investing & Trading Score: 64 | |
| Day Percent Change: 0.39% Day Change: 0.06 | |
| Week Change: 2.45% Year-to-date Change: -14.3% | |
| PETQ Links: Profile News Message Board | |
| Charts:- Daily , Weekly | |
| Add PETQ to Watchlist: View: Get Complete PETQ Trend Analysis ➞ | |
 | RMR The RMR Group Inc. |
| Sector: Financials | |
| SubSector: Real Estate Development | |
| MarketCap: 797.419 Millions | |
| Recent Price: 24.20 Smart Investing & Trading Score: 42 | |
| Day Percent Change: 0.64% Day Change: 0.15 | |
| Week Change: 2.87% Year-to-date Change: -14.3% | |
| RMR Links: Profile News Message Board | |
| Charts:- Daily , Weekly | |
| Add RMR to Watchlist: View: Get Complete RMR Trend Analysis ➞ | |
 | CCO Clear Channel Outdoor Holdings, Inc. |
| Sector: Services & Goods | |
| SubSector: Marketing Services | |
| MarketCap: 312.715 Millions | |
| Recent Price: 1.56 Smart Investing & Trading Score: 49 | |
| Day Percent Change: 7.59% Day Change: 0.11 | |
| Week Change: 8.33% Year-to-date Change: -14.3% | |
| CCO Links: Profile News Message Board | |
| Charts:- Daily , Weekly | |
| Add CCO to Watchlist: View: Get Complete CCO Trend Analysis ➞ | |
 | WGO Winnebago Industries, Inc. |
| Sector: Consumer Staples | |
| SubSector: Recreational Vehicles | |
| MarketCap: 896.559 Millions | |
| Recent Price: 62.44 Smart Investing & Trading Score: 10 | |
| Day Percent Change: 1.56% Day Change: 0.96 | |
| Week Change: -1% Year-to-date Change: -14.3% | |
| WGO Links: Profile News Message Board | |
| Charts:- Daily , Weekly | |
| Add WGO to Watchlist: View: Get Complete WGO Trend Analysis ➞ | |
 | FBNC First Bancorp |
| Sector: Financials | |
| SubSector: Regional - Mid-Atlantic Banks | |
| MarketCap: 664.959 Millions | |
| Recent Price: 31.71 Smart Investing & Trading Score: 32 | |
| Day Percent Change: 1.47% Day Change: 0.46 | |
| Week Change: 0.6% Year-to-date Change: -14.3% | |
| FBNC Links: Profile News Message Board | |
| Charts:- Daily , Weekly | |
| Add FBNC to Watchlist: View: Get Complete FBNC Trend Analysis ➞ | |
 | FMNB Farmers National Banc Corp. |
| Sector: Financials | |
| SubSector: Regional - Midwest Banks | |
| MarketCap: 366.57 Millions | |
| Recent Price: 12.38 Smart Investing & Trading Score: 57 | |
| Day Percent Change: 1.23% Day Change: 0.15 | |
| Week Change: 2.57% Year-to-date Change: -14.3% | |
| FMNB Links: Profile News Message Board | |
| Charts:- Daily , Weekly | |
| Add FMNB to Watchlist: View: Get Complete FMNB Trend Analysis ➞ | |
 | GT The Goodyear Tire & Rubber Company |
| Sector: Consumer Staples | |
| SubSector: Rubber & Plastics | |
| MarketCap: 1483.7 Millions | |
| Recent Price: 12.26 Smart Investing & Trading Score: 83 | |
| Day Percent Change: 2.77% Day Change: 0.33 | |
| Week Change: 3.55% Year-to-date Change: -14.4% | |
| GT Links: Profile News Message Board | |
| Charts:- Daily , Weekly | |
| Add GT to Watchlist: View: Get Complete GT Trend Analysis ➞ | |
 | MOV Movado Group, Inc. |
| Sector: Consumer Staples | |
| SubSector: Recreational Goods, Other | |
| MarketCap: 161.659 Millions | |
| Recent Price: 25.81 Smart Investing & Trading Score: 42 | |
| Day Percent Change: 0.82% Day Change: 0.21 | |
| Week Change: -0.69% Year-to-date Change: -14.4% | |
| MOV Links: Profile News Message Board | |
| Charts:- Daily , Weekly | |
| Add MOV to Watchlist: View: Get Complete MOV Trend Analysis ➞ | |
 | RXRX Recursion Pharmaceuticals, Inc. |
| Sector: Health Care | |
| SubSector: Biotechnology | |
| MarketCap: 1470 Millions | |
| Recent Price: 8.38 Smart Investing & Trading Score: 57 | |
| Day Percent Change: 0.60% Day Change: 0.05 | |
| Week Change: 3.27% Year-to-date Change: -14.4% | |
| RXRX Links: Profile News Message Board | |
| Charts:- Daily , Weekly | |
| Add RXRX to Watchlist: View: Get Complete RXRX Trend Analysis ➞ | |
 | EGRX Eagle Pharmaceuticals, Inc. |
| Sector: Health Care | |
| SubSector: Drugs - Generic | |
| MarketCap: 573.385 Millions | |
| Recent Price: 4.47 Smart Investing & Trading Score: 47 | |
| Day Percent Change: 6.80% Day Change: 0.28 | |
| Week Change: 7.57% Year-to-date Change: -14.4% | |
| EGRX Links: Profile News Message Board | |
| Charts:- Daily , Weekly | |
| Add EGRX to Watchlist: View: Get Complete EGRX Trend Analysis ➞ | |
 | WD Walker & Dunlop, Inc. |
| Sector: Financials | |
| SubSector: Mortgage Investment | |
| MarketCap: 1312.99 Millions | |
| Recent Price: 94.97 Smart Investing & Trading Score: 57 | |
| Day Percent Change: 2.38% Day Change: 2.21 | |
| Week Change: 1.89% Year-to-date Change: -14.5% | |
| WD Links: Profile News Message Board | |
| Charts:- Daily , Weekly | |
| Add WD to Watchlist: View: Get Complete WD Trend Analysis ➞ | |
 | COHU Cohu, Inc. |
| Sector: Technology | |
| SubSector: Semiconductor Equipment & Materials | |
| MarketCap: 519.518 Millions | |
| Recent Price: 30.26 Smart Investing & Trading Score: 10 | |
| Day Percent Change: 2.23% Day Change: 0.66 | |
| Week Change: -2.64% Year-to-date Change: -14.5% | |
| COHU Links: Profile News Message Board | |
| Charts:- Daily , Weekly | |
| Add COHU to Watchlist: View: Get Complete COHU Trend Analysis ➞ | |
 | CAC Camden National Corporation |
| Sector: Financials | |
| SubSector: Regional - Northeast Banks | |
| MarketCap: 550.999 Millions | |
| Recent Price: 32.16 Smart Investing & Trading Score: 87 | |
| Day Percent Change: 1.21% Day Change: 0.38 | |
| Week Change: 5.46% Year-to-date Change: -14.5% | |
| CAC Links: Profile News Message Board | |
| Charts:- Daily , Weekly | |
| Add CAC to Watchlist: View: Get Complete CAC Trend Analysis ➞ | |
 | LBAI Lakeland Bancorp, Inc. |
| Sector: Financials | |
| SubSector: Regional - Northeast Banks | |
| MarketCap: 534.599 Millions | |
| Recent Price: 12.64 Smart Investing & Trading Score: 83 | |
| Day Percent Change: 1.44% Day Change: 0.18 | |
| Week Change: 0.96% Year-to-date Change: -14.5% | |
| LBAI Links: Profile News Message Board | |
| Charts:- Daily , Weekly | |
| Add LBAI to Watchlist: View: Get Complete LBAI Trend Analysis ➞ | |
| Too many stocks? View smallcap stocks filtered by marketcap & sector |
| Marketcap: All SmallCap Stocks (default-no microcap), Large, Mid-Range, Small & MicroCap |
| Sector: Tech, Finance, Energy, Staples, Retail, Industrial, Materials, Utilities & Medical |
|
Best Stocks Today 12Stocks.com |
© 2024 12Stocks.com Terms & Conditions Privacy Contact Us
All Information Provided Only For Education And Not To Be Used For Investing or Trading. See Terms & Conditions


One More Thing ... Get Best Stocks Delivered Daily!
Never Ever Miss A Move With Our Top Ten Stocks Lists
Find Best Stocks In Any Market - Bull or Bear Market
Take A Peek At Our Top Ten Stocks Lists: Daily, Weekly, Year-to-Date & Top Trends
Find Best Stocks In Any Market - Bull or Bear Market
Take A Peek At Our Top Ten Stocks Lists: Daily, Weekly, Year-to-Date & Top Trends
Smallcap Stocks With Best Up Trends [0-bearish to 100-bullish]: Emergent BioSolutions[100], Aspen Aerogels[100], Perdoceo Education[100], Gannett Co[100], Pitney Bowes[100], Origin Materials[100], Benchmark Electronics[100], Blueprint Medicines[100], FormFactor [100], Lantheus [100], Tronox [100]
Best Smallcap Stocks Year-to-Date:
Janux [440.16%], Viking [306.07%], Longboard [258.92%], Alpine Immune[239.44%], Bakkt [187.89%], Avidity Biosciences[184.07%], Arcutis Bio[171.83%], Vera [170.74%], Cullinan Oncology[169.74%], Super Micro[159.59%], Y-mAbs [153.08%] Best Smallcap Stocks This Week:
Deciphera [73.24%], Emergent BioSolutions[69.53%], Aspen Aerogels[47.24%], Eyenovia [45.27%], P3 Health[38.51%], Carvana Co[37.82%], Origin Materials[36.24%], Poseida [34.98%], Cue Biopharma[34.07%], Surmodics [33.44%], TransMedics Group[33.23%] Best Smallcap Stocks Daily:
Emergent BioSolutions[68.65%], Aspen Aerogels[55.75%], Carvana Co[33.42%], Enovix [31.06%], Perdoceo Education[28.82%], Office Properties[28.50%], Gannett Co[26.14%], Pitney Bowes[23.99%], Sunnova Energy[23.23%], Pulmonx [20.21%], CommScope Holding[19.80%]