
 Login Sign Up


| |||||
 |  | ||||

| 12Stocks.com Market Intelligence |
Best SmallCap Stocks
|
| In a hurry? Small Cap Stock Lists: Performance Trends Table, Stock Charts
Sort Small Cap stocks: Daily, Weekly, Year-to-Date, Market Cap & Trends. Filter Small Cap stocks list by sector: Show all, Tech, Finance, Energy, Staples, Retail, Industrial, Materials, Utilities and HealthCare Filter Small Cap stocks list by size: All Large Medium Small and MicroCap |
| 12Stocks.com Small Cap Stocks Performances & Trends Daily | |||||||||
|
|  The overall Smart Investing & Trading Score is 95 (0-bearish to 100-bullish) which puts Small Cap index in short term bullish trend. The Smart Investing & Trading Score from previous trading session is 100 and hence a deterioration of trend.
| ||||||||
Here are the Smart Investing & Trading Scores of the most requested small cap stocks at 12Stocks.com (click stock name for detailed review):
|


| 12Stocks.com: Investing in Smallcap Index with Stocks | |
|
The following table helps investors and traders sort through current performance and trends (as measured by Smart Investing & Trading Score) of various
stocks in the Smallcap Index. Quick View: Move mouse or cursor over stock symbol (ticker) to view short-term technical chart and over stock name to view long term chart. Click on  to add stock symbol to your watchlist and to add stock symbol to your watchlist and  to view watchlist. Click on any ticker or stock name for detailed market intelligence report for that stock. to view watchlist. Click on any ticker or stock name for detailed market intelligence report for that stock. |
12Stocks.com Performance of Stocks in Smallcap Index
| Ticker | Stock Name | Watchlist | Category | Recent Price | Smart Investing & Trading Score | Change % | YTD Change% |
| ASUR | Asure |   | Technology | 7.62 | 74 | 0.40% | -19.96% |
| CSGS | CSG Systems | | Technology | 42.58 | 42 | -2.25% | -19.98% |
| AMN | AMN Healthcare | | Industrials | 59.92 | 90 | -0.43% | -19.98% |
| UVV | Universal | | Consumer Staples | 53.83 | 68 | 0.49% | -20.04% |
| NRC | National Research | | Health Care | 31.59 | 42 | 0.10% | -20.15% |
| BW | Babcock & Wilcox Enterprises | | Industrials | 1.17 | 37 | 4.02% | -20.21% |
| LGIH | LGI Homes | | Financials | 106.21 | 74 | -0.95% | -20.24% |
| PGC | Peapack-Gladstone Financial | | Financials | 23.78 | 74 | 0.13% | -20.25% |
| MOFG | MidWestOne Financial | | Financials | 21.46 | 62 | -0.92% | -20.25% |
| TMP | Tompkins Financial | | Financials | 48.02 | 87 | 0.21% | -20.27% |
| LOB | Live Oak | | Financials | 36.24 | 64 | -0.28% | -20.35% |
| EWCZ | European Wax | | Consumer Staples | 10.78 | 35 | -5.69% | -20.38% |
| MATW | Matthews | | Services & Goods | 29.16 | 70 | 0.19% | -20.42% |
| DLTH | Duluth | | Services & Goods | 4.28 | 27 | -0.47% | -20.45% |
| MCB | Metropolitan Bank | | Financials | 44.05 | 88 | 1.18% | -20.47% |
| INDB | Independent Bank | | Financials | 52.29 | 35 | 0.19% | -20.54% |
| ALHC | Alignment Healthcare | | Health Care | 7.01 | 83 | -0.57% | -20.79% |
| DVAX | Dynavax | | Health Care | 11.06 | 42 | 0.18% | -20.89% |
| EBTC | Enterprise Bancorp | | Financials | 25.51 | 67 | -0.58% | -20.92% |
| GDYN | Grid Dynamics | | Technology | 10.54 | 45 | 0.76% | -20.93% |
| BWFG | Bankwell Financial | | Financials | 23.86 | 49 | -0.04% | -20.94% |
| GMRE | Global Medical | | Industrials | 8.77 | 42 | -0.28% | -21.04% |
| FFIC | Flushing Financial | | Financials | 13.01 | 82 | 1.88% | -21.06% |
| BRZE | Braze | | Technology | 41.94 | 32 | -1.29% | -21.22% |
| FOSL | Fossil Group | | Consumer Staples | 1.15 | 95 | 1.77% | -21.23% |
| For chart view version of above stock list: Chart View ➞ 0 - 25 , 25 - 50 , 50 - 75 , 75 - 100 , 100 - 125 , 125 - 150 , 150 - 175 , 175 - 200 , 200 - 225 , 225 - 250 , 250 - 275 , 275 - 300 , 300 - 325 , 325 - 350 , 350 - 375 , 375 - 400 , 400 - 425 , 425 - 450 , 450 - 475 , 475 - 500 , 500 - 525 , 525 - 550 , 550 - 575 , 575 - 600 , 600 - 625 , 625 - 650 , 650 - 675 , 675 - 700 , 700 - 725 , 725 - 750 , 750 - 775 , 775 - 800 , 800 - 825 , 825 - 850 , 850 - 875 , 875 - 900 , 900 - 925 , 925 - 950 , 950 - 975 , 975 - 1000 , 1000 - 1025 , 1025 - 1050 , 1050 - 1075 , 1075 - 1100 , 1100 - 1125 , 1125 - 1150 , 1150 - 1175 , 1175 - 1200 , 1200 - 1225 , 1225 - 1250 , 1250 - 1275 , 1275 - 1300 , 1300 - 1325 , 1325 - 1350 , 1350 - 1375 , 1375 - 1400 , 1400 - 1425 , 1425 - 1450 , 1450 - 1475 | ||
 | Click To Change The Sort Order: By Market Cap or Company Size Performance: Year-to-date, Week and Day |  |
| Too many stocks? View smallcap stocks filtered by marketcap & sector |
| Marketcap: All SmallCap Stocks (default-no microcap), Large, Mid-Range, Small |
| Smallcap Sector: Tech, Finance, Energy, Staples, Retail, Industrial, Materials, & Medical |
|
Get the most comprehensive stock market coverage daily at 12Stocks.com ➞ Best Stocks Today ➞ Best Stocks Weekly ➞ Best Stocks Year-to-Date ➞ Best Stocks Trends ➞  Best Stocks Today 12Stocks.com Best Nasdaq Stocks ➞ Best S&P 500 Stocks ➞ Best Tech Stocks ➞ Best Biotech Stocks ➞ |
| Detailed Overview of SmallCap Stocks |
| SmallCap Technical Overview, Leaders & Laggards, Top SmallCap ETF Funds & Detailed SmallCap Stocks List, Charts, Trends & More |
| Smallcap: Technical Analysis, Trends & YTD Performance | |
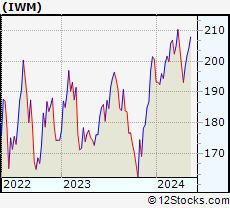
| SmallCap segment as represented by
IWM, an exchange-traded fund [ETF], holds basket of thousands of smallcap stocks from across all major sectors of the US stock market. The smallcap index (contains stocks like Riverbed & Sotheby's) is up by 4.12% and is currently underperforming the overall market by -6.85% year-to-date. Below is a quick view of technical charts and trends: | |
 IWM Weekly Chart |
|
| Long Term Trend: Very Good | |
| Medium Term Trend: Very Good | |
 IWM Daily Chart |
|
| Short Term Trend: Good | |
| Overall Trend Score: 95 | |
| YTD Performance: 4.12% | |
| **Trend Scores & Views Are Only For Educational Purposes And Not For Investing | |
| 12Stocks.com: Top Performing Small Cap Index Stocks | ||||||||||||||||||||||||||||||||||||||||||||||||
 The top performing Small Cap Index stocks year to date are
Now, more recently, over last week, the top performing Small Cap Index stocks on the move are


|
||||||||||||||||||||||||||||||||||||||||||||||||
| 12Stocks.com: Investing in Smallcap Index using Exchange Traded Funds | |
|
The following table shows list of key exchange traded funds (ETF) that
help investors track Smallcap index. The following list also includes leveraged ETF funds that track twice or thrice the daily returns of Smallcap indices. Short or inverse ETF funds move in the opposite direction to the index they track and are useful during market pullbacks or during bear markets. Quick View: Move mouse or cursor over ETF symbol (ticker) to view short-term technical chart and over ETF name to view long term chart. Click on ticker or stock name for detailed view. Click on to add stock symbol to your watchlist and to view watchlist. |
12Stocks.com List of ETFs that track Smallcap Index
| Ticker | ETF Name | Watchlist | Recent Price | Smart Investing & Trading Score | Change % | Week % | Year-to-date % |
| IWM | iShares Russell 2000 | | 208.97 | 95 | -0.22 | 2.28 | 4.12% |
| IJR | iShares Core S&P Small-Cap | | 110.63 | 88 | -0.14 | 1.51 | 2.2% |
| VTWO | Vanguard Russell 2000 ETF | | 84.43 | 95 | -0.24 | 2.18 | 4.11% |
| IWN | iShares Russell 2000 Value | | 158.82 | 95 | 0.06 | 1.68 | 2.25% |
| IJS | iShares S&P Small-Cap 600 Value | | 101.91 | 88 | -0.22 | 1.38 | -1.13% |
| IWO | iShares Russell 2000 Growth | | 267.15 | 100 | 0.21 | 2.78 | 5.92% |
| IJT | iShares S&P Small-Cap 600 Growth | | 131.69 | 100 | -0.39 | 1.41 | 5.23% |
| XSLV | PowerShares S&P SmallCap Low Volatil ETF | | 44.47 | 76 | -0.04 | 0.54 | 0.72% |
| SAA | ProShares Ultra SmallCap600 | | 25.05 | 85 | -0.60 | 2.89 | 0.42% |
| SBB | ProShares Short SmallCap600 | | 15.77 | 10 | 0.70 | -1.16 | -1% |
| SMLV | SPDR SSGA US Small Cap Low Volatil ETF | | 112.72 | 88 | 0.16 | 1.34 | 0.17% |
| SDD | ProShares UltraShort SmallCap600 | | 17.78 | 20 | 0.61 | -2.75 | -3.52% |
| 12Stocks.com: Charts, Trends, Fundamental Data and Performances of SmallCap Stocks | |
|
We now take in-depth look at all SmallCap stocks including charts, multi-period performances and overall trends (as measured by Smart Investing & Trading Score). One can sort SmallCap stocks (click link to choose) by Daily, Weekly and by Year-to-Date performances. Also, one can sort by size of the company or by market capitalization. |
| Select Your Default Chart Type: | |||||
| |||||
| Click on stock symbol or name for detailed view. Click on to add stock symbol to your watchlist and to view watchlist. Quick View: Move mouse or cursor over "Daily" to quickly view daily technical stock chart and over "Weekly" to view weekly technical stock chart. | |||||

 | ASUR Asure Software, Inc. |
| Sector: Technology | |
| SubSector: Business Software & Services | |
| MarketCap: 103.758 Millions | |
| Recent Price: 7.62 Smart Investing & Trading Score: 74 | |
| Day Percent Change: 0.40% Day Change: 0.03 | |
| Week Change: 2.14% Year-to-date Change: -20.0% | |
| ASUR Links: Profile News Message Board | |
| Charts:- Daily , Weekly | |
| Add ASUR to Watchlist: View: Get Complete ASUR Trend Analysis ➞ | |
 | CSGS CSG Systems International, Inc. |
| Sector: Technology | |
| SubSector: Business Software & Services | |
| MarketCap: 1336.78 Millions | |
| Recent Price: 42.58 Smart Investing & Trading Score: 42 | |
| Day Percent Change: -2.25% Day Change: -0.98 | |
| Week Change: 1.31% Year-to-date Change: -20.0% | |
| CSGS Links: Profile News Message Board | |
| Charts:- Daily , Weekly | |
| Add CSGS to Watchlist: View: Get Complete CSGS Trend Analysis ➞ | |
 | AMN AMN Healthcare Services, Inc. |
| Sector: Industrials | |
| SubSector: General Building Materials | |
| MarketCap: 3064.03 Millions | |
| Recent Price: 59.92 Smart Investing & Trading Score: 90 | |
| Day Percent Change: -0.43% Day Change: -0.26 | |
| Week Change: 9.52% Year-to-date Change: -20.0% | |
| AMN Links: Profile News Message Board | |
| Charts:- Daily , Weekly | |
| Add AMN to Watchlist: View: Get Complete AMN Trend Analysis ➞ | |
 | UVV Universal Corporation |
| Sector: Consumer Staples | |
| SubSector: Tobacco Products, Other | |
| MarketCap: 1107.7 Millions | |
| Recent Price: 53.83 Smart Investing & Trading Score: 68 | |
| Day Percent Change: 0.49% Day Change: 0.26 | |
| Week Change: -0.35% Year-to-date Change: -20.0% | |
| UVV Links: Profile News Message Board | |
| Charts:- Daily , Weekly | |
| Add UVV to Watchlist: View: Get Complete UVV Trend Analysis ➞ | |
 | NRC National Research Corporation |
| Sector: Health Care | |
| SubSector: Medical Laboratories & Research | |
| MarketCap: 1187.7 Millions | |
| Recent Price: 31.59 Smart Investing & Trading Score: 42 | |
| Day Percent Change: 0.10% Day Change: 0.03 | |
| Week Change: 4.85% Year-to-date Change: -20.2% | |
| NRC Links: Profile News Message Board | |
| Charts:- Daily , Weekly | |
| Add NRC to Watchlist: View: Get Complete NRC Trend Analysis ➞ | |
 | BW Babcock & Wilcox Enterprises, Inc. |
| Sector: Industrials | |
| SubSector: Industrial Electrical Equipment | |
| MarketCap: 59.0879 Millions | |
| Recent Price: 1.17 Smart Investing & Trading Score: 37 | |
| Day Percent Change: 4.02% Day Change: 0.04 | |
| Week Change: -9.69% Year-to-date Change: -20.2% | |
| BW Links: Profile News Message Board | |
| Charts:- Daily , Weekly | |
| Add BW to Watchlist: View: Get Complete BW Trend Analysis ➞ | |
 | LGIH LGI Homes, Inc. |
| Sector: Financials | |
| SubSector: Real Estate Development | |
| MarketCap: 1316.49 Millions | |
| Recent Price: 106.21 Smart Investing & Trading Score: 74 | |
| Day Percent Change: -0.95% Day Change: -1.02 | |
| Week Change: 6.86% Year-to-date Change: -20.2% | |
| LGIH Links: Profile News Message Board | |
| Charts:- Daily , Weekly | |
| Add LGIH to Watchlist: View: Get Complete LGIH Trend Analysis ➞ | |
 | PGC Peapack-Gladstone Financial Corporation |
| Sector: Financials | |
| SubSector: Regional - Northeast Banks | |
| MarketCap: 284.399 Millions | |
| Recent Price: 23.78 Smart Investing & Trading Score: 74 | |
| Day Percent Change: 0.13% Day Change: 0.03 | |
| Week Change: 3.17% Year-to-date Change: -20.3% | |
| PGC Links: Profile News Message Board | |
| Charts:- Daily , Weekly | |
| Add PGC to Watchlist: View: Get Complete PGC Trend Analysis ➞ | |
 | MOFG MidWestOne Financial Group, Inc. |
| Sector: Financials | |
| SubSector: Regional - Southwest Banks | |
| MarketCap: 345.265 Millions | |
| Recent Price: 21.46 Smart Investing & Trading Score: 62 | |
| Day Percent Change: -0.92% Day Change: -0.20 | |
| Week Change: -1.15% Year-to-date Change: -20.3% | |
| MOFG Links: Profile News Message Board | |
| Charts:- Daily , Weekly | |
| Add MOFG to Watchlist: View: Get Complete MOFG Trend Analysis ➞ | |
 | TMP Tompkins Financial Corporation |
| Sector: Financials | |
| SubSector: Regional - Northeast Banks | |
| MarketCap: 1144.79 Millions | |
| Recent Price: 48.02 Smart Investing & Trading Score: 87 | |
| Day Percent Change: 0.21% Day Change: 0.10 | |
| Week Change: 2.3% Year-to-date Change: -20.3% | |
| TMP Links: Profile News Message Board | |
| Charts:- Daily , Weekly | |
| Add TMP to Watchlist: View: Get Complete TMP Trend Analysis ➞ | |
 | LOB Live Oak Bancshares, Inc. |
| Sector: Financials | |
| SubSector: Savings & Loans | |
| MarketCap: 394.23 Millions | |
| Recent Price: 36.24 Smart Investing & Trading Score: 64 | |
| Day Percent Change: -0.28% Day Change: -0.10 | |
| Week Change: 2.9% Year-to-date Change: -20.4% | |
| LOB Links: Profile News Message Board | |
| Charts:- Daily , Weekly | |
| Add LOB to Watchlist: View: Get Complete LOB Trend Analysis ➞ | |
 | EWCZ European Wax Center, Inc. |
| Sector: Consumer Staples | |
| SubSector: Household & Personal Products | |
| MarketCap: 1180 Millions | |
| Recent Price: 10.78 Smart Investing & Trading Score: 35 | |
| Day Percent Change: -5.69% Day Change: -0.65 | |
| Week Change: -2.62% Year-to-date Change: -20.4% | |
| EWCZ Links: Profile News Message Board | |
| Charts:- Daily , Weekly | |
| Add EWCZ to Watchlist: View: Get Complete EWCZ Trend Analysis ➞ | |
 | MATW Matthews International Corporation |
| Sector: Services & Goods | |
| SubSector: Personal Services | |
| MarketCap: 803.325 Millions | |
| Recent Price: 29.16 Smart Investing & Trading Score: 70 | |
| Day Percent Change: 0.19% Day Change: 0.05 | |
| Week Change: 1.16% Year-to-date Change: -20.4% | |
| MATW Links: Profile News Message Board | |
| Charts:- Daily , Weekly | |
| Add MATW to Watchlist: View: Get Complete MATW Trend Analysis ➞ | |
 | DLTH Duluth Holdings Inc. |
| Sector: Services & Goods | |
| SubSector: Apparel Stores | |
| MarketCap: 180.008 Millions | |
| Recent Price: 4.28 Smart Investing & Trading Score: 27 | |
| Day Percent Change: -0.47% Day Change: -0.02 | |
| Week Change: -0.93% Year-to-date Change: -20.5% | |
| DLTH Links: Profile News Message Board | |
| Charts:- Daily , Weekly | |
| Add DLTH to Watchlist: View: Get Complete DLTH Trend Analysis ➞ | |
 | MCB Metropolitan Bank Holding Corp. |
| Sector: Financials | |
| SubSector: Regional - Northeast Banks | |
| MarketCap: 212.999 Millions | |
| Recent Price: 44.05 Smart Investing & Trading Score: 88 | |
| Day Percent Change: 1.18% Day Change: 0.52 | |
| Week Change: 3.32% Year-to-date Change: -20.5% | |
| MCB Links: Profile News Message Board | |
| Charts:- Daily , Weekly | |
| Add MCB to Watchlist: View: Get Complete MCB Trend Analysis ➞ | |
 | INDB Independent Bank Corp. |
| Sector: Financials | |
| SubSector: Regional - Northeast Banks | |
| MarketCap: 2347.09 Millions | |
| Recent Price: 52.29 Smart Investing & Trading Score: 35 | |
| Day Percent Change: 0.19% Day Change: 0.10 | |
| Week Change: 0.95% Year-to-date Change: -20.5% | |
| INDB Links: Profile News Message Board | |
| Charts:- Daily , Weekly | |
| Add INDB to Watchlist: View: Get Complete INDB Trend Analysis ➞ | |
 | ALHC Alignment Healthcare, Inc. |
| Sector: Health Care | |
| SubSector: Healthcare Plans | |
| MarketCap: 1100 Millions | |
| Recent Price: 7.01 Smart Investing & Trading Score: 83 | |
| Day Percent Change: -0.57% Day Change: -0.04 | |
| Week Change: 2.64% Year-to-date Change: -20.8% | |
| ALHC Links: Profile News Message Board | |
| Charts:- Daily , Weekly | |
| Add ALHC to Watchlist: View: Get Complete ALHC Trend Analysis ➞ | |
 | DVAX Dynavax Technologies Corporation |
| Sector: Health Care | |
| SubSector: Biotechnology | |
| MarketCap: 276.885 Millions | |
| Recent Price: 11.06 Smart Investing & Trading Score: 42 | |
| Day Percent Change: 0.18% Day Change: 0.02 | |
| Week Change: 3.08% Year-to-date Change: -20.9% | |
| DVAX Links: Profile News Message Board | |
| Charts:- Daily , Weekly | |
| Add DVAX to Watchlist: View: Get Complete DVAX Trend Analysis ➞ | |
 | EBTC Enterprise Bancorp, Inc. |
| Sector: Financials | |
| SubSector: Savings & Loans | |
| MarketCap: 304.53 Millions | |
| Recent Price: 25.51 Smart Investing & Trading Score: 67 | |
| Day Percent Change: -0.58% Day Change: -0.15 | |
| Week Change: 0.75% Year-to-date Change: -20.9% | |
| EBTC Links: Profile News Message Board | |
| Charts:- Daily , Weekly | |
| Add EBTC to Watchlist: View: Get Complete EBTC Trend Analysis ➞ | |
 | GDYN Grid Dynamics Holdings, Inc. |
| Sector: Technology | |
| SubSector: Information Technology Services | |
| MarketCap: 318.968 Millions | |
| Recent Price: 10.54 Smart Investing & Trading Score: 45 | |
| Day Percent Change: 0.76% Day Change: 0.08 | |
| Week Change: 3.03% Year-to-date Change: -20.9% | |
| GDYN Links: Profile News Message Board | |
| Charts:- Daily , Weekly | |
| Add GDYN to Watchlist: View: Get Complete GDYN Trend Analysis ➞ | |
 | BWFG Bankwell Financial Group, Inc. |
| Sector: Financials | |
| SubSector: Regional - Northeast Banks | |
| MarketCap: 142.899 Millions | |
| Recent Price: 23.86 Smart Investing & Trading Score: 49 | |
| Day Percent Change: -0.04% Day Change: -0.01 | |
| Week Change: 0.51% Year-to-date Change: -20.9% | |
| BWFG Links: Profile News Message Board | |
| Charts:- Daily , Weekly | |
| Add BWFG to Watchlist: View: Get Complete BWFG Trend Analysis ➞ | |
 | GMRE Global Medical REIT Inc. |
| Sector: Industrials | |
| SubSector: Conglomerates | |
| MarketCap: 529.748 Millions | |
| Recent Price: 8.77 Smart Investing & Trading Score: 42 | |
| Day Percent Change: -0.28% Day Change: -0.02 | |
| Week Change: -1.41% Year-to-date Change: -21.0% | |
| GMRE Links: Profile News Message Board | |
| Charts:- Daily , Weekly | |
| Add GMRE to Watchlist: View: Get Complete GMRE Trend Analysis ➞ | |
 | FFIC Flushing Financial Corporation |
| Sector: Financials | |
| SubSector: Savings & Loans | |
| MarketCap: 336.43 Millions | |
| Recent Price: 13.01 Smart Investing & Trading Score: 82 | |
| Day Percent Change: 1.88% Day Change: 0.24 | |
| Week Change: 5.34% Year-to-date Change: -21.1% | |
| FFIC Links: Profile News Message Board | |
| Charts:- Daily , Weekly | |
| Add FFIC to Watchlist: View: Get Complete FFIC Trend Analysis ➞ | |
 | BRZE Braze, Inc. |
| Sector: Technology | |
| SubSector: Software - Application | |
| MarketCap: 4340 Millions | |
| Recent Price: 41.94 Smart Investing & Trading Score: 32 | |
| Day Percent Change: -1.29% Day Change: -0.55 | |
| Week Change: 1.72% Year-to-date Change: -21.2% | |
| BRZE Links: Profile News Message Board | |
| Charts:- Daily , Weekly | |
| Add BRZE to Watchlist: View: Get Complete BRZE Trend Analysis ➞ | |
 | FOSL Fossil Group, Inc. |
| Sector: Consumer Staples | |
| SubSector: Textile - Apparel Footwear & Accessories | |
| MarketCap: 215.87 Millions | |
| Recent Price: 1.15 Smart Investing & Trading Score: 95 | |
| Day Percent Change: 1.77% Day Change: 0.02 | |
| Week Change: 18.9% Year-to-date Change: -21.2% | |
| FOSL Links: Profile News Message Board | |
| Charts:- Daily , Weekly | |
| Add FOSL to Watchlist: View: Get Complete FOSL Trend Analysis ➞ | |
| For tabular summary view of above stock list: Summary View ➞ 0 - 25 , 25 - 50 , 50 - 75 , 75 - 100 , 100 - 125 , 125 - 150 , 150 - 175 , 175 - 200 , 200 - 225 , 225 - 250 , 250 - 275 , 275 - 300 , 300 - 325 , 325 - 350 , 350 - 375 , 375 - 400 , 400 - 425 , 425 - 450 , 450 - 475 , 475 - 500 , 500 - 525 , 525 - 550 , 550 - 575 , 575 - 600 , 600 - 625 , 625 - 650 , 650 - 675 , 675 - 700 , 700 - 725 , 725 - 750 , 750 - 775 , 775 - 800 , 800 - 825 , 825 - 850 , 850 - 875 , 875 - 900 , 900 - 925 , 925 - 950 , 950 - 975 , 975 - 1000 , 1000 - 1025 , 1025 - 1050 , 1050 - 1075 , 1075 - 1100 , 1100 - 1125 , 1125 - 1150 , 1150 - 1175 , 1175 - 1200 , 1200 - 1225 , 1225 - 1250 , 1250 - 1275 , 1275 - 1300 , 1300 - 1325 , 1325 - 1350 , 1350 - 1375 , 1375 - 1400 , 1400 - 1425 , 1425 - 1450 , 1450 - 1475 | ||
| Click To Change The Sort Order: By Market Cap or Company Size Performance: Year-to-date, Week and Day | |
| Select Chart Type: | ||
| Too many stocks? View smallcap stocks filtered by marketcap & sector |
| Marketcap: All SmallCap Stocks (default-no microcap), Large, Mid-Range, Small & MicroCap |
| Sector: Tech, Finance, Energy, Staples, Retail, Industrial, Materials, Utilities & Medical |
|
Best Stocks Today 12Stocks.com |
© 2024 12Stocks.com Terms & Conditions Privacy Contact Us
All Information Provided Only For Education And Not To Be Used For Investing or Trading. See Terms & Conditions


One More Thing ... Get Best Stocks Delivered Daily!
Never Ever Miss A Move With Our Top Ten Stocks Lists
Find Best Stocks In Any Market - Bull or Bear Market
Take A Peek At Our Top Ten Stocks Lists: Daily, Weekly, Year-to-Date & Top Trends
Find Best Stocks In Any Market - Bull or Bear Market
Take A Peek At Our Top Ten Stocks Lists: Daily, Weekly, Year-to-Date & Top Trends
Smallcap Stocks With Best Up Trends [0-bearish to 100-bullish]: Agilysys [100], Vanda [100], Guardant Health[100], Natural Grocers[100], NuScale Power[100], Cushman & Wakefield[100], Blue Bird[100], Eve Holding[100], Newpark Resources[100], Arrow Financial[100], TowneBank [100]
Best Smallcap Stocks Year-to-Date:
Viking [304.73%], Super Micro[231.02%], Sweetgreen [182.92%], Arcutis Bio[177.4%], Vera [175.32%], Novavax [171.77%], Stoke [168.25%], Oscar Health[147.78%], SoundHound AI[142.76%], MicroStrategy [131.72%], Carvana Co[127.35%] Best Smallcap Stocks This Week:
MacroGenics [48.64%], Novavax [46.9%], LivePerson [36.71%], ProKidney [36.48%], Treace Medical[29.45%], SunPower [28.91%], Workhorse Group[28.83%], Emergent BioSolutions[25.4%], Vuzix [25%], Tellurian [25%], Stoke [24.65%] Best Smallcap Stocks Daily:
Trupanion [12.53%], Extreme s[11.07%], Allakos [10.55%], Hawkins [8.45%], Ventyx Biosciences[6.68%], Semler Scientific[5.99%], Alphatec [5.88%], Verve [5.78%], Verrica [5.27%], GEO Group[5.19%], Aceto [5.00%]