
 Login Sign Up


| |||||
 |  | ||||

| 12Stocks.com Market Intelligence |
Best SmallCap Stocks
|
| In a hurry? Small Cap Stock Lists: Performance Trends Table, Stock Charts
Sort Small Cap stocks: Daily, Weekly, Year-to-Date, Market Cap & Trends. Filter Small Cap stocks list by sector: Show all, Tech, Finance, Energy, Staples, Retail, Industrial, Materials, Utilities and HealthCare Filter Small Cap stocks list by size: All Large Medium Small and MicroCap |
| 12Stocks.com Small Cap Stocks Performances & Trends Daily | |||||||||
|
|  The overall Smart Investing & Trading Score is 69 (0-bearish to 100-bullish) which puts Small Cap index in short term neutral to bullish trend. The Smart Investing & Trading Score from previous trading session is 49 and hence an improvement of trend.
| ||||||||
Here are the Smart Investing & Trading Scores of the most requested small cap stocks at 12Stocks.com (click stock name for detailed review):
|


| 12Stocks.com: Investing in Smallcap Index with Stocks | |
|
The following table helps investors and traders sort through current performance and trends (as measured by Smart Investing & Trading Score) of various
stocks in the Smallcap Index. Quick View: Move mouse or cursor over stock symbol (ticker) to view short-term technical chart and over stock name to view long term chart. Click on  to add stock symbol to your watchlist and to add stock symbol to your watchlist and  to view watchlist. Click on any ticker or stock name for detailed market intelligence report for that stock. to view watchlist. Click on any ticker or stock name for detailed market intelligence report for that stock. |
12Stocks.com Performance of Stocks in Smallcap Index
| Ticker | Stock Name | Watchlist | Category | Recent Price | Smart Investing & Trading Score | Change % | YTD Change% |
| MFA | MFA Financial |   | Financials | 10.95 | 74 | 0.37% | -2.84% |
| USCB | USCB Financial | | Financials | 11.91 | 100 | 0.00% | -3.01% |
| TRC | Tejon Ranch | | Financials | 16.68 | 63 | -1.07% | -3.02% |
| NPO | EnPro Industries | | Industrials | 152.00 | 39 | -0.33% | -3.02% |
| SIGI | Selective Insurance | | Financials | 96.41 | 0 | 0.67% | -3.09% |
| IBCP | Independent Bank | | Financials | 25.20 | 80 | 0.64% | -3.15% |
| DGICA | Donegal Group | | Financials | 13.55 | 43 | 0.22% | -3.15% |
| TENB | Tenable | | Technology | 44.60 | 7 | -1.35% | -3.17% |
| ALTR | Altair Engineering | | Technology | 81.47 | 25 | -0.34% | -3.18% |
| GPI | Group 1 | | Services & Goods | 295.04 | 73 | 0.86% | -3.18% |
| PKOH | Park-Ohio | | Services & Goods | 26.07 | 64 | -1.73% | -3.30% |
| VRNS | Varonis Systems | | Technology | 43.77 | 15 | -0.95% | -3.33% |
| ENFN | Enfusion | | Technology | 9.53 | 88 | 0.11% | -3.33% |
| CODI | Compass Diversified | | Industrials | 21.68 | 10 | 1.64% | -3.43% |
| QSI | Quantum-Si | | Health Care | 1.94 | 100 | 9.92% | -3.48% |
| DX | Dynex Capital | | Financials | 12.08 | 74 | 0.75% | -3.51% |
| PHR | Phreesia | | Technology | 22.32 | 52 | 0.27% | -3.59% |
| NUVL | Nuvalent | | Health Care | 70.82 | 52 | -0.66% | -3.63% |
| MEC | Mayville Engineering | | Industrials | 13.89 | 78 | 0.51% | -3.68% |
| BJRI | BJ s | | Services & Goods | 34.68 | 69 | 5.86% | -3.69% |
| ZURA | Zura Bio | | Health Care | 4.51 | 95 | 3.92% | -3.74% |
| PLXS | Plexus | | Technology | 104.07 | 95 | 0.66% | -3.75% |
| WDFC | WD-40 | | Materials | 230.01 | 42 | -0.30% | -3.79% |
| CAKE | Cheesecake Factory | | Services & Goods | 33.67 | 15 | 0.60% | -3.83% |
| CVGW | Calavo Growers | | Consumer Staples | 28.28 | 64 | -2.18% | -3.84% |


| Too many stocks? View smallcap stocks filtered by marketcap & sector |
| Marketcap: All SmallCap Stocks (default-no microcap), Large, Mid-Range, Small |
| Smallcap Sector: Tech, Finance, Energy, Staples, Retail, Industrial, Materials, & Medical |
|
Get the most comprehensive stock market coverage daily at 12Stocks.com ➞ Best Stocks Today ➞ Best Stocks Weekly ➞ Best Stocks Year-to-Date ➞ Best Stocks Trends ➞  Best Stocks Today 12Stocks.com Best Nasdaq Stocks ➞ Best S&P 500 Stocks ➞ Best Tech Stocks ➞ Best Biotech Stocks ➞ |
| Detailed Overview of SmallCap Stocks |
| SmallCap Technical Overview, Leaders & Laggards, Top SmallCap ETF Funds & Detailed SmallCap Stocks List, Charts, Trends & More |
| Smallcap: Technical Analysis, Trends & YTD Performance | |
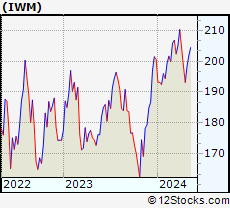
| SmallCap segment as represented by
IWM, an exchange-traded fund [ETF], holds basket of thousands of smallcap stocks from across all major sectors of the US stock market. The smallcap index (contains stocks like Riverbed & Sotheby's) is up by 0.59% and is currently underperforming the overall market by -6.29% year-to-date. Below is a quick view of technical charts and trends: | |
 IWM Weekly Chart |
|
| Long Term Trend: Not Good | |
| Medium Term Trend: Very Good | |
 IWM Daily Chart |
|
| Short Term Trend: Very Good | |
| Overall Trend Score: 69 | |
| YTD Performance: 0.59% | |
| **Trend Scores & Views Are Only For Educational Purposes And Not For Investing | |
| 12Stocks.com: Top Performing Small Cap Index Stocks | ||||||||||||||||||||||||||||||||||||||||||||||||
 The top performing Small Cap Index stocks year to date are
Now, more recently, over last week, the top performing Small Cap Index stocks on the move are


|
||||||||||||||||||||||||||||||||||||||||||||||||
| 12Stocks.com: Investing in Smallcap Index using Exchange Traded Funds | |
|
The following table shows list of key exchange traded funds (ETF) that
help investors track Smallcap index. The following list also includes leveraged ETF funds that track twice or thrice the daily returns of Smallcap indices. Short or inverse ETF funds move in the opposite direction to the index they track and are useful during market pullbacks or during bear markets. Quick View: Move mouse or cursor over ETF symbol (ticker) to view short-term technical chart and over ETF name to view long term chart. Click on ticker or stock name for detailed view. Click on to add stock symbol to your watchlist and to view watchlist. |
12Stocks.com List of ETFs that track Smallcap Index
| Ticker | ETF Name | Watchlist | Recent Price | Smart Investing & Trading Score | Change % | Week % | Year-to-date % |
| IWM | iShares Russell 2000 | | 201.90 | 69 | 0.99 | 1.77 | 0.59% |
| IJR | iShares Core S&P Small-Cap | | 107.13 | 82 | 0.75 | 1.4 | -1.03% |
| VTWO | Vanguard Russell 2000 ETF | | 81.61 | 69 | 0.94 | 1.73 | 0.63% |
| IWN | iShares Russell 2000 Value | | 154.21 | 100 | 0.87 | 2.03 | -0.72% |
| IJS | iShares S&P Small-Cap 600 Value | | 98.72 | 64 | 0.71 | 1.57 | -4.22% |
| IWO | iShares Russell 2000 Growth | | 256.87 | 57 | 0.99 | 1.49 | 1.84% |
| IJT | iShares S&P Small-Cap 600 Growth | | 127.76 | 95 | 0.82 | 1.32 | 2.09% |
| XSLV | PowerShares S&P SmallCap Low Volatil ETF | | 43.22 | 87 | 0.19 | 1.17 | -2.11% |
| SBB | ProShares Short SmallCap600 | | 16.16 | 13 | -1.28 | -1.37 | 1.44% |
| SDD | ProShares UltraShort SmallCap600 | | 18.84 | 23 | -2.41 | -2.61 | 2.27% |
| SAA | ProShares Ultra SmallCap600 | | 23.59 | 69 | 2.86 | 2.39 | -5.45% |
| SMLV | SPDR SSGA US Small Cap Low Volatil ETF | | 109.69 | 87 | 0.78 | 2.01 | -2.52% |
| 12Stocks.com: Charts, Trends, Fundamental Data and Performances of SmallCap Stocks | |
|
We now take in-depth look at all SmallCap stocks including charts, multi-period performances and overall trends (as measured by Smart Investing & Trading Score). One can sort SmallCap stocks (click link to choose) by Daily, Weekly and by Year-to-Date performances. Also, one can sort by size of the company or by market capitalization. |
| Select Your Default Chart Type: | |||||
| |||||
| Click on stock symbol or name for detailed view. Click on to add stock symbol to your watchlist and to view watchlist. Quick View: Move mouse or cursor over "Daily" to quickly view daily technical stock chart and over "Weekly" to view weekly technical stock chart. | |||||

 | MFA MFA Financial, Inc. |
| Sector: Financials | |
| SubSector: Mortgage Investment | |
| MarketCap: 1869.69 Millions | |
| Recent Price: 10.95 Smart Investing & Trading Score: 74 | |
| Day Percent Change: 0.37% Day Change: 0.04 | |
| Week Change: 2.05% Year-to-date Change: -2.8% | |
| MFA Links: Profile News Message Board | |
| Charts:- Daily , Weekly | |
| Add MFA to Watchlist: View: Get Complete MFA Trend Analysis ➞ | |
 | USCB USCB Financial Holdings, Inc. |
| Sector: Financials | |
| SubSector: Banks - Regional | |
| MarketCap: 198 Millions | |
| Recent Price: 11.91 Smart Investing & Trading Score: 100 | |
| Day Percent Change: 0.00% Day Change: 0.00 | |
| Week Change: 11% Year-to-date Change: -3.0% | |
| USCB Links: Profile News Message Board | |
| Charts:- Daily , Weekly | |
| Add USCB to Watchlist: View: Get Complete USCB Trend Analysis ➞ | |
 | TRC Tejon Ranch Co. |
| Sector: Financials | |
| SubSector: Property Management | |
| MarketCap: 346.442 Millions | |
| Recent Price: 16.68 Smart Investing & Trading Score: 63 | |
| Day Percent Change: -1.07% Day Change: -0.18 | |
| Week Change: -2.28% Year-to-date Change: -3.0% | |
| TRC Links: Profile News Message Board | |
| Charts:- Daily , Weekly | |
| Add TRC to Watchlist: View: Get Complete TRC Trend Analysis ➞ | |
 | NPO EnPro Industries, Inc. |
| Sector: Industrials | |
| SubSector: Industrial Equipment & Components | |
| MarketCap: 734.309 Millions | |
| Recent Price: 152.00 Smart Investing & Trading Score: 39 | |
| Day Percent Change: -0.33% Day Change: -0.50 | |
| Week Change: 0.9% Year-to-date Change: -3.0% | |
| NPO Links: Profile News Message Board | |
| Charts:- Daily , Weekly | |
| Add NPO to Watchlist: View: Get Complete NPO Trend Analysis ➞ | |
 | SIGI Selective Insurance Group, Inc. |
| Sector: Financials | |
| SubSector: Property & Casualty Insurance | |
| MarketCap: 3039.12 Millions | |
| Recent Price: 96.41 Smart Investing & Trading Score: 0 | |
| Day Percent Change: 0.67% Day Change: 0.64 | |
| Week Change: -3.72% Year-to-date Change: -3.1% | |
| SIGI Links: Profile News Message Board | |
| Charts:- Daily , Weekly | |
| Add SIGI to Watchlist: View: Get Complete SIGI Trend Analysis ➞ | |
 | IBCP Independent Bank Corporation |
| Sector: Financials | |
| SubSector: Regional - Midwest Banks | |
| MarketCap: 273.67 Millions | |
| Recent Price: 25.20 Smart Investing & Trading Score: 80 | |
| Day Percent Change: 0.64% Day Change: 0.16 | |
| Week Change: 0.84% Year-to-date Change: -3.2% | |
| IBCP Links: Profile News Message Board | |
| Charts:- Daily , Weekly | |
| Add IBCP to Watchlist: View: Get Complete IBCP Trend Analysis ➞ | |
 | DGICA Donegal Group Inc. |
| Sector: Financials | |
| SubSector: Property & Casualty Insurance | |
| MarketCap: 350.512 Millions | |
| Recent Price: 13.55 Smart Investing & Trading Score: 43 | |
| Day Percent Change: 0.22% Day Change: 0.03 | |
| Week Change: 0.74% Year-to-date Change: -3.2% | |
| DGICA Links: Profile News Message Board | |
| Charts:- Daily , Weekly | |
| Add DGICA to Watchlist: View: Get Complete DGICA Trend Analysis ➞ | |
 | TENB Tenable Holdings, Inc. |
| Sector: Technology | |
| SubSector: Business Software & Services | |
| MarketCap: 1986.68 Millions | |
| Recent Price: 44.60 Smart Investing & Trading Score: 7 | |
| Day Percent Change: -1.35% Day Change: -0.61 | |
| Week Change: -3.02% Year-to-date Change: -3.2% | |
| TENB Links: Profile News Message Board | |
| Charts:- Daily , Weekly | |
| Add TENB to Watchlist: View: Get Complete TENB Trend Analysis ➞ | |
 | ALTR Altair Engineering Inc. |
| Sector: Technology | |
| SubSector: Semiconductor - Specialized | |
| MarketCap: 2072.2 Millions | |
| Recent Price: 81.47 Smart Investing & Trading Score: 25 | |
| Day Percent Change: -0.34% Day Change: -0.28 | |
| Week Change: -2.52% Year-to-date Change: -3.2% | |
| ALTR Links: Profile News Message Board | |
| Charts:- Daily , Weekly | |
| Add ALTR to Watchlist: View: Get Complete ALTR Trend Analysis ➞ | |
 | GPI Group 1 Automotive, Inc. |
| Sector: Services & Goods | |
| SubSector: Auto Dealerships | |
| MarketCap: 921.021 Millions | |
| Recent Price: 295.04 Smart Investing & Trading Score: 73 | |
| Day Percent Change: 0.86% Day Change: 2.51 | |
| Week Change: -1.77% Year-to-date Change: -3.2% | |
| GPI Links: Profile News Message Board | |
| Charts:- Daily , Weekly | |
| Add GPI to Watchlist: View: Get Complete GPI Trend Analysis ➞ | |
 | PKOH Park-Ohio Holdings Corp. |
| Sector: Services & Goods | |
| SubSector: Industrial Equipment Wholesale | |
| MarketCap: 214.358 Millions | |
| Recent Price: 26.07 Smart Investing & Trading Score: 64 | |
| Day Percent Change: -1.73% Day Change: -0.46 | |
| Week Change: 8.22% Year-to-date Change: -3.3% | |
| PKOH Links: Profile News Message Board | |
| Charts:- Daily , Weekly | |
| Add PKOH to Watchlist: View: Get Complete PKOH Trend Analysis ➞ | |
 | VRNS Varonis Systems, Inc. |
| Sector: Technology | |
| SubSector: Technical & System Software | |
| MarketCap: 1715 Millions | |
| Recent Price: 43.77 Smart Investing & Trading Score: 15 | |
| Day Percent Change: -0.95% Day Change: -0.42 | |
| Week Change: -3.44% Year-to-date Change: -3.3% | |
| VRNS Links: Profile News Message Board | |
| Charts:- Daily , Weekly | |
| Add VRNS to Watchlist: View: Get Complete VRNS Trend Analysis ➞ | |
 | ENFN Enfusion, Inc. |
| Sector: Technology | |
| SubSector: Software - Application | |
| MarketCap: 1290 Millions | |
| Recent Price: 9.53 Smart Investing & Trading Score: 88 | |
| Day Percent Change: 0.11% Day Change: 0.01 | |
| Week Change: 1.17% Year-to-date Change: -3.3% | |
| ENFN Links: Profile News Message Board | |
| Charts:- Daily , Weekly | |
| Add ENFN to Watchlist: View: Get Complete ENFN Trend Analysis ➞ | |
 | CODI Compass Diversified Holdings LLC |
| Sector: Industrials | |
| SubSector: Conglomerates | |
| MarketCap: 803.348 Millions | |
| Recent Price: 21.68 Smart Investing & Trading Score: 10 | |
| Day Percent Change: 1.64% Day Change: 0.35 | |
| Week Change: -4.16% Year-to-date Change: -3.4% | |
| CODI Links: Profile News Message Board | |
| Charts:- Daily , Weekly | |
| Add CODI to Watchlist: View: Get Complete CODI Trend Analysis ➞ | |
 | QSI Quantum-Si incorporated |
| Sector: Health Care | |
| SubSector: Biotechnology | |
| MarketCap: 256 Millions | |
| Recent Price: 1.94 Smart Investing & Trading Score: 100 | |
| Day Percent Change: 9.92% Day Change: 0.18 | |
| Week Change: 17.58% Year-to-date Change: -3.5% | |
| QSI Links: Profile News Message Board | |
| Charts:- Daily , Weekly | |
| Add QSI to Watchlist: View: Get Complete QSI Trend Analysis ➞ | |
 | DX Dynex Capital, Inc. |
| Sector: Financials | |
| SubSector: Mortgage Investment | |
| MarketCap: 327.839 Millions | |
| Recent Price: 12.08 Smart Investing & Trading Score: 74 | |
| Day Percent Change: 0.75% Day Change: 0.09 | |
| Week Change: 1.34% Year-to-date Change: -3.5% | |
| DX Links: Profile News Message Board | |
| Charts:- Daily , Weekly | |
| Add DX to Watchlist: View: Get Complete DX Trend Analysis ➞ | |
 | PHR Phreesia, Inc. |
| Sector: Technology | |
| SubSector: Healthcare Information Services | |
| MarketCap: 810.255 Millions | |
| Recent Price: 22.32 Smart Investing & Trading Score: 52 | |
| Day Percent Change: 0.27% Day Change: 0.06 | |
| Week Change: 8.3% Year-to-date Change: -3.6% | |
| PHR Links: Profile News Message Board | |
| Charts:- Daily , Weekly | |
| Add PHR to Watchlist: View: Get Complete PHR Trend Analysis ➞ | |
 | NUVL Nuvalent, Inc. |
| Sector: Health Care | |
| SubSector: Biotechnology | |
| MarketCap: 2400 Millions | |
| Recent Price: 70.82 Smart Investing & Trading Score: 52 | |
| Day Percent Change: -0.66% Day Change: -0.47 | |
| Week Change: 6.02% Year-to-date Change: -3.6% | |
| NUVL Links: Profile News Message Board | |
| Charts:- Daily , Weekly | |
| Add NUVL to Watchlist: View: Get Complete NUVL Trend Analysis ➞ | |
 | MEC Mayville Engineering Company, Inc. |
| Sector: Industrials | |
| SubSector: Metal Fabrication | |
| MarketCap: 143.55 Millions | |
| Recent Price: 13.89 Smart Investing & Trading Score: 78 | |
| Day Percent Change: 0.51% Day Change: 0.07 | |
| Week Change: -1.21% Year-to-date Change: -3.7% | |
| MEC Links: Profile News Message Board | |
| Charts:- Daily , Weekly | |
| Add MEC to Watchlist: View: Get Complete MEC Trend Analysis ➞ | |
 | BJRI BJ s Restaurants, Inc. |
| Sector: Services & Goods | |
| SubSector: Restaurants | |
| MarketCap: 183.67 Millions | |
| Recent Price: 34.68 Smart Investing & Trading Score: 69 | |
| Day Percent Change: 5.86% Day Change: 1.92 | |
| Week Change: 3.71% Year-to-date Change: -3.7% | |
| BJRI Links: Profile News Message Board | |
| Charts:- Daily , Weekly | |
| Add BJRI to Watchlist: View: Get Complete BJRI Trend Analysis ➞ | |
 | ZURA Zura Bio Limited |
| Sector: Health Care | |
| SubSector: Biotechnology | |
| MarketCap: 242 Millions | |
| Recent Price: 4.51 Smart Investing & Trading Score: 95 | |
| Day Percent Change: 3.92% Day Change: 0.17 | |
| Week Change: 2.27% Year-to-date Change: -3.7% | |
| ZURA Links: Profile News Message Board | |
| Charts:- Daily , Weekly | |
| Add ZURA to Watchlist: View: Get Complete ZURA Trend Analysis ➞ | |
 | PLXS Plexus Corp. |
| Sector: Technology | |
| SubSector: Printed Circuit Boards | |
| MarketCap: 1457.15 Millions | |
| Recent Price: 104.07 Smart Investing & Trading Score: 95 | |
| Day Percent Change: 0.66% Day Change: 0.68 | |
| Week Change: 3.78% Year-to-date Change: -3.8% | |
| PLXS Links: Profile News Message Board | |
| Charts:- Daily , Weekly | |
| Add PLXS to Watchlist: View: Get Complete PLXS Trend Analysis ➞ | |
 | WDFC WD-40 Company |
| Sector: Materials | |
| SubSector: Specialty Chemicals | |
| MarketCap: 2900.57 Millions | |
| Recent Price: 230.01 Smart Investing & Trading Score: 42 | |
| Day Percent Change: -0.30% Day Change: -0.70 | |
| Week Change: 1.99% Year-to-date Change: -3.8% | |
| WDFC Links: Profile News Message Board | |
| Charts:- Daily , Weekly | |
| Add WDFC to Watchlist: View: Get Complete WDFC Trend Analysis ➞ | |
 | CAKE The Cheesecake Factory Incorporated |
| Sector: Services & Goods | |
| SubSector: Restaurants | |
| MarketCap: 829 Millions | |
| Recent Price: 33.67 Smart Investing & Trading Score: 15 | |
| Day Percent Change: 0.60% Day Change: 0.20 | |
| Week Change: -4.77% Year-to-date Change: -3.8% | |
| CAKE Links: Profile News Message Board | |
| Charts:- Daily , Weekly | |
| Add CAKE to Watchlist: View: Get Complete CAKE Trend Analysis ➞ | |
 | CVGW Calavo Growers, Inc. |
| Sector: Consumer Staples | |
| SubSector: Farm Products | |
| MarketCap: 935.287 Millions | |
| Recent Price: 28.28 Smart Investing & Trading Score: 64 | |
| Day Percent Change: -2.18% Day Change: -0.63 | |
| Week Change: 4.62% Year-to-date Change: -3.8% | |
| CVGW Links: Profile News Message Board | |
| Charts:- Daily , Weekly | |
| Add CVGW to Watchlist: View: Get Complete CVGW Trend Analysis ➞ | |
| Too many stocks? View smallcap stocks filtered by marketcap & sector |
| Marketcap: All SmallCap Stocks (default-no microcap), Large, Mid-Range, Small & MicroCap |
| Sector: Tech, Finance, Energy, Staples, Retail, Industrial, Materials, Utilities & Medical |
|
Best Stocks Today 12Stocks.com |
© 2024 12Stocks.com Terms & Conditions Privacy Contact Us
All Information Provided Only For Education And Not To Be Used For Investing or Trading. See Terms & Conditions


One More Thing ... Get Best Stocks Delivered Daily!
Never Ever Miss A Move With Our Top Ten Stocks Lists
Find Best Stocks In Any Market - Bull or Bear Market
Take A Peek At Our Top Ten Stocks Lists: Daily, Weekly, Year-to-Date & Top Trends
Find Best Stocks In Any Market - Bull or Bear Market
Take A Peek At Our Top Ten Stocks Lists: Daily, Weekly, Year-to-Date & Top Trends
Smallcap Stocks With Best Up Trends [0-bearish to 100-bullish]: Twist Bioscience[100], WideOpenWest [100], Joint [100], FTC Solar[100], Origin Materials[100], Alignment Healthcare[100], Clarus [100], IES [100], Emergent BioSolutions[100], Enovix [100], El Pollo[100]
Best Smallcap Stocks Year-to-Date:
Janux [482.74%], Viking [313.59%], Longboard [272.5%], Alpine Immune[239.29%], Bakkt [199.55%], Avidity Biosciences[192.48%], Vera [189.47%], Cullinan Oncology[176.9%], Super Micro[175.35%], Y-mAbs [151.47%], Sana [149.33%] Best Smallcap Stocks This Week:
Emergent BioSolutions[102.6%], Deciphera [73.24%], Origin Materials[66.52%], Eyenovia [60.78%], Cue Biopharma[56.04%], Aspen Aerogels[55.96%], Enovix [54.02%], Luna Innovations[53.77%], Codexis [47.37%], Carvana Co[44.31%], Office Properties[42.79%] Best Smallcap Stocks Daily:
Luna Innovations[36.00%], Twist Bioscience[28.74%], Ardelyx [28.42%], WideOpenWest [28.23%], 2U [26.63%], Joint [25.35%], FTC Solar[25.09%], Origin Materials[22.23%], Alignment Healthcare[21.97%], Clarus [18.67%], Aurora Innovation[18.09%]