
 Login Sign Up


| |||||
 |  | ||||

| 12Stocks.com Market Intelligence |
Best SmallCap Stocks
|
| In a hurry? Small Cap Stock Lists: Performance Trends Table, Stock Charts
Sort Small Cap stocks: Daily, Weekly, Year-to-Date, Market Cap & Trends. Filter Small Cap stocks list by sector: Show all, Tech, Finance, Energy, Staples, Retail, Industrial, Materials, Utilities and HealthCare Filter Small Cap stocks list by size: All Large Medium Small and MicroCap |
| 12Stocks.com Small Cap Stocks Performances & Trends Daily | |||||||||
|
|  The overall Smart Investing & Trading Score is 100 (0-bearish to 100-bullish) which puts Small Cap index in short term bullish trend. The Smart Investing & Trading Score from previous trading session is 88 and hence an improvement of trend.
| ||||||||
Here are the Smart Investing & Trading Scores of the most requested small cap stocks at 12Stocks.com (click stock name for detailed review):
|


| 12Stocks.com: Investing in Smallcap Index with Stocks | |
|
The following table helps investors and traders sort through current performance and trends (as measured by Smart Investing & Trading Score) of various
stocks in the Smallcap Index. Quick View: Move mouse or cursor over stock symbol (ticker) to view short-term technical chart and over stock name to view long term chart. Click on  to add stock symbol to your watchlist and to add stock symbol to your watchlist and  to view watchlist. Click on any ticker or stock name for detailed market intelligence report for that stock. to view watchlist. Click on any ticker or stock name for detailed market intelligence report for that stock. |
12Stocks.com Performance of Stocks in Smallcap Index
| Ticker | Stock Name | Watchlist | Category | Recent Price | Smart Investing & Trading Score | Change % | YTD Change% |
| BZH | Beazer Homes |   | Industrials | 29.84 | 64 | 5.44% | -11.69% |
| TRDA | Entrada | | Health Care | 14.49 | 88 | 2.11% | -11.70% |
| TTGT | TechTarget | | Technology | 30.77 | 74 | 3.50% | -11.73% |
| APLE | Apple Hospitality | | Financials | 14.66 | 10 | -0.88% | -11.74% |
| TGI | Triumph Group | | Industrials | 14.63 | 78 | -0.34% | -11.76% |
| HBNC | Horizon Bancorp | | Financials | 12.62 | 76 | 1.53% | -11.81% |
| MD | MEDNAX | | Health Care | 8.20 | 18 | -3.30% | -11.83% |
| EGRX | Eagle | | Health Care | 4.61 | 59 | -1.28% | -11.85% |
| VMD | Viemed Healthcare | | Health Care | 6.92 | 10 | 3.28% | -11.85% |
| ZYME | Zymeworks | | Health Care | 9.15 | 45 | 1.67% | -11.93% |
| AROW | Arrow Financial | | Financials | 24.59 | 100 | 2.97% | -11.99% |
| FBMS | First Bancshares | | Financials | 25.80 | 95 | 1.10% | -12.04% |
| JBGS | JBG SMITH | | Financials | 14.95 | 54 | 0.67% | -12.11% |
| WABC | Westamerica Ban | | Financials | 49.57 | 68 | 0.55% | -12.13% |
| CHMG | Chemung Financial | | Financials | 43.70 | 100 | 1.27% | -12.25% |
| HFWA | Heritage Financial | | Financials | 18.76 | 83 | -0.11% | -12.30% |
| JRVR | James River | | Financials | 8.10 | 35 | 1.63% | -12.34% |
| PLYM | Plymouth Industrial | | Financials | 21.10 | 64 | 1.39% | -12.34% |
| NREF | NexPoint Real | | Financials | 13.79 | 74 | 1.25% | -12.36% |
| GLT | P. H. | | Consumer Staples | 1.70 | 64 | -2.30% | -12.37% |
| TBPH | Theravance Biopharma | | Health Care | 9.85 | 93 | 4.90% | -12.37% |
| SKIN | Beauty Health | | Consumer Staples | 2.77 | 25 | -1.07% | -12.48% |
| IIIN | Insteel Industries | | Materials | 33.43 | 32 | 0.21% | -12.69% |
| BANR | Banner | | Financials | 46.76 | 83 | -0.13% | -12.70% |
| QUAD | Quad/Graphics | | Services & Goods | 4.73 | 32 | -1.05% | -12.73% |


| Too many stocks? View smallcap stocks filtered by marketcap & sector |
| Marketcap: All SmallCap Stocks (default-no microcap), Large, Mid-Range, Small |
| Smallcap Sector: Tech, Finance, Energy, Staples, Retail, Industrial, Materials, & Medical |
|
Get the most comprehensive stock market coverage daily at 12Stocks.com ➞ Best Stocks Today ➞ Best Stocks Weekly ➞ Best Stocks Year-to-Date ➞ Best Stocks Trends ➞  Best Stocks Today 12Stocks.com Best Nasdaq Stocks ➞ Best S&P 500 Stocks ➞ Best Tech Stocks ➞ Best Biotech Stocks ➞ |
| Detailed Overview of SmallCap Stocks |
| SmallCap Technical Overview, Leaders & Laggards, Top SmallCap ETF Funds & Detailed SmallCap Stocks List, Charts, Trends & More |
| Smallcap: Technical Analysis, Trends & YTD Performance | |
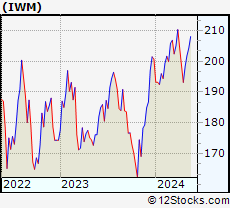
| SmallCap segment as represented by
IWM, an exchange-traded fund [ETF], holds basket of thousands of smallcap stocks from across all major sectors of the US stock market. The smallcap index (contains stocks like Riverbed & Sotheby's) is up by 4.35% and is currently underperforming the overall market by -6.37% year-to-date. Below is a quick view of technical charts and trends: | |
 IWM Weekly Chart |
|
| Long Term Trend: Very Good | |
| Medium Term Trend: Very Good | |
 IWM Daily Chart |
|
| Short Term Trend: Very Good | |
| Overall Trend Score: 100 | |
| YTD Performance: 4.35% | |
| **Trend Scores & Views Are Only For Educational Purposes And Not For Investing | |
| 12Stocks.com: Top Performing Small Cap Index Stocks | ||||||||||||||||||||||||||||||||||||||||||||||||
 The top performing Small Cap Index stocks year to date are
Now, more recently, over last week, the top performing Small Cap Index stocks on the move are


|
||||||||||||||||||||||||||||||||||||||||||||||||
| 12Stocks.com: Investing in Smallcap Index using Exchange Traded Funds | |
|
The following table shows list of key exchange traded funds (ETF) that
help investors track Smallcap index. The following list also includes leveraged ETF funds that track twice or thrice the daily returns of Smallcap indices. Short or inverse ETF funds move in the opposite direction to the index they track and are useful during market pullbacks or during bear markets. Quick View: Move mouse or cursor over ETF symbol (ticker) to view short-term technical chart and over ETF name to view long term chart. Click on ticker or stock name for detailed view. Click on to add stock symbol to your watchlist and to view watchlist. |
12Stocks.com List of ETFs that track Smallcap Index
| Ticker | ETF Name | Watchlist | Recent Price | Smart Investing & Trading Score | Change % | Week % | Year-to-date % |
| IWM | iShares Russell 2000 | | 209.44 | 100 | 1.25 | 2.51 | 4.35% |
| VTWO | Vanguard Russell 2000 ETF | | 84.63 | 95 | 1.35 | 2.43 | 4.35% |
| IJR | iShares Core S&P Small-Cap | | 110.78 | 95 | 0.34 | 1.65 | 2.34% |
| IJS | iShares S&P Small-Cap 600 Value | | 102.13 | 95 | -0.08 | 1.6 | -0.91% |
| IJT | iShares S&P Small-Cap 600 Growth | | 132.20 | 100 | 1.13 | 1.8 | 5.64% |
| IWN | iShares Russell 2000 Value | | 158.72 | 95 | 0.58 | 1.62 | 2.18% |
| IWO | iShares Russell 2000 Growth | | 266.58 | 100 | 1.17 | 2.56 | 5.69% |
| XSLV | PowerShares S&P SmallCap Low Volatil ETF | | 44.49 | 83 | 0.37 | 0.59 | 0.77% |
| SAA | ProShares Ultra SmallCap600 | | 25.20 | 85 | 0.90 | 3.51 | 1.02% |
| SMLV | SPDR SSGA US Small Cap Low Volatil ETF | | 112.54 | 95 | 0.80 | 1.19 | 0.02% |
| SBB | ProShares Short SmallCap600 | | 15.66 | 10 | -0.70 | -1.85 | -1.69% |
| SDD | ProShares UltraShort SmallCap600 | | 17.67 | 20 | -1.22 | -3.34 | -4.11% |
| 12Stocks.com: Charts, Trends, Fundamental Data and Performances of SmallCap Stocks | |
|
We now take in-depth look at all SmallCap stocks including charts, multi-period performances and overall trends (as measured by Smart Investing & Trading Score). One can sort SmallCap stocks (click link to choose) by Daily, Weekly and by Year-to-Date performances. Also, one can sort by size of the company or by market capitalization. |
| Select Your Default Chart Type: | |||||
| |||||
| Click on stock symbol or name for detailed view. Click on to add stock symbol to your watchlist and to view watchlist. Quick View: Move mouse or cursor over "Daily" to quickly view daily technical stock chart and over "Weekly" to view weekly technical stock chart. | |||||

 | BZH Beazer Homes USA, Inc. |
| Sector: Industrials | |
| SubSector: Residential Construction | |
| MarketCap: 180.106 Millions | |
| Recent Price: 29.84 Smart Investing & Trading Score: 64 | |
| Day Percent Change: 5.44% Day Change: 1.54 | |
| Week Change: 4.96% Year-to-date Change: -11.7% | |
| BZH Links: Profile News Message Board | |
| Charts:- Daily , Weekly | |
| Add BZH to Watchlist: View: Get Complete BZH Trend Analysis ➞ | |
 | TRDA Entrada Therapeutics, Inc. |
| Sector: Health Care | |
| SubSector: Biotechnology | |
| MarketCap: 481 Millions | |
| Recent Price: 14.49 Smart Investing & Trading Score: 88 | |
| Day Percent Change: 2.11% Day Change: 0.30 | |
| Week Change: 1.05% Year-to-date Change: -11.7% | |
| TRDA Links: Profile News Message Board | |
| Charts:- Daily , Weekly | |
| Add TRDA to Watchlist: View: Get Complete TRDA Trend Analysis ➞ | |
 | TTGT TechTarget, Inc. |
| Sector: Technology | |
| SubSector: Internet Information Providers | |
| MarketCap: 560.78 Millions | |
| Recent Price: 30.77 Smart Investing & Trading Score: 74 | |
| Day Percent Change: 3.50% Day Change: 1.04 | |
| Week Change: 5.41% Year-to-date Change: -11.7% | |
| TTGT Links: Profile News Message Board | |
| Charts:- Daily , Weekly | |
| Add TTGT to Watchlist: View: Get Complete TTGT Trend Analysis ➞ | |
 | APLE Apple Hospitality REIT, Inc. |
| Sector: Financials | |
| SubSector: REIT - Hotel/Motel | |
| MarketCap: 1515.74 Millions | |
| Recent Price: 14.66 Smart Investing & Trading Score: 10 | |
| Day Percent Change: -0.88% Day Change: -0.13 | |
| Week Change: -1.21% Year-to-date Change: -11.7% | |
| APLE Links: Profile News Message Board | |
| Charts:- Daily , Weekly | |
| Add APLE to Watchlist: View: Get Complete APLE Trend Analysis ➞ | |
 | TGI Triumph Group, Inc. |
| Sector: Industrials | |
| SubSector: Aerospace/Defense Products & Services | |
| MarketCap: 358.901 Millions | |
| Recent Price: 14.63 Smart Investing & Trading Score: 78 | |
| Day Percent Change: -0.34% Day Change: -0.05 | |
| Week Change: 2.16% Year-to-date Change: -11.8% | |
| TGI Links: Profile News Message Board | |
| Charts:- Daily , Weekly | |
| Add TGI to Watchlist: View: Get Complete TGI Trend Analysis ➞ | |
 | HBNC Horizon Bancorp, Inc. |
| Sector: Financials | |
| SubSector: Regional - Northeast Banks | |
| MarketCap: 405.999 Millions | |
| Recent Price: 12.62 Smart Investing & Trading Score: 76 | |
| Day Percent Change: 1.53% Day Change: 0.19 | |
| Week Change: -0.24% Year-to-date Change: -11.8% | |
| HBNC Links: Profile News Message Board | |
| Charts:- Daily , Weekly | |
| Add HBNC to Watchlist: View: Get Complete HBNC Trend Analysis ➞ | |
 | MD MEDNAX, Inc. |
| Sector: Health Care | |
| SubSector: Specialized Health Services | |
| MarketCap: 913.656 Millions | |
| Recent Price: 8.20 Smart Investing & Trading Score: 18 | |
| Day Percent Change: -3.30% Day Change: -0.28 | |
| Week Change: -0.24% Year-to-date Change: -11.8% | |
| MD Links: Profile News Message Board | |
| Charts:- Daily , Weekly | |
| Add MD to Watchlist: View: Get Complete MD Trend Analysis ➞ | |
 | EGRX Eagle Pharmaceuticals, Inc. |
| Sector: Health Care | |
| SubSector: Drugs - Generic | |
| MarketCap: 573.385 Millions | |
| Recent Price: 4.61 Smart Investing & Trading Score: 59 | |
| Day Percent Change: -1.28% Day Change: -0.06 | |
| Week Change: 1.54% Year-to-date Change: -11.9% | |
| EGRX Links: Profile News Message Board | |
| Charts:- Daily , Weekly | |
| Add EGRX to Watchlist: View: Get Complete EGRX Trend Analysis ➞ | |
 | VMD Viemed Healthcare, Inc. |
| Sector: Health Care | |
| SubSector: Medical Appliances & Equipment | |
| MarketCap: 177.28 Millions | |
| Recent Price: 6.92 Smart Investing & Trading Score: 10 | |
| Day Percent Change: 3.28% Day Change: 0.22 | |
| Week Change: -3.15% Year-to-date Change: -11.9% | |
| VMD Links: Profile News Message Board | |
| Charts:- Daily , Weekly | |
| Add VMD to Watchlist: View: Get Complete VMD Trend Analysis ➞ | |
 | ZYME Zymeworks Inc. |
| Sector: Health Care | |
| SubSector: Biotechnology | |
| MarketCap: 1373.55 Millions | |
| Recent Price: 9.15 Smart Investing & Trading Score: 45 | |
| Day Percent Change: 1.67% Day Change: 0.15 | |
| Week Change: 3.86% Year-to-date Change: -11.9% | |
| ZYME Links: Profile News Message Board | |
| Charts:- Daily , Weekly | |
| Add ZYME to Watchlist: View: Get Complete ZYME Trend Analysis ➞ | |
 | AROW Arrow Financial Corporation |
| Sector: Financials | |
| SubSector: Regional - Northeast Banks | |
| MarketCap: 413.999 Millions | |
| Recent Price: 24.59 Smart Investing & Trading Score: 100 | |
| Day Percent Change: 2.97% Day Change: 0.71 | |
| Week Change: 3.58% Year-to-date Change: -12.0% | |
| AROW Links: Profile News Message Board | |
| Charts:- Daily , Weekly | |
| Add AROW to Watchlist: View: Get Complete AROW Trend Analysis ➞ | |
 | FBMS The First Bancshares, Inc. |
| Sector: Financials | |
| SubSector: Regional - Southeast Banks | |
| MarketCap: 359.535 Millions | |
| Recent Price: 25.80 Smart Investing & Trading Score: 95 | |
| Day Percent Change: 1.10% Day Change: 0.28 | |
| Week Change: 1.18% Year-to-date Change: -12.0% | |
| FBMS Links: Profile News Message Board | |
| Charts:- Daily , Weekly | |
| Add FBMS to Watchlist: View: Get Complete FBMS Trend Analysis ➞ | |
 | JBGS JBG SMITH Properties |
| Sector: Financials | |
| SubSector: Property Management | |
| MarketCap: 4335.32 Millions | |
| Recent Price: 14.95 Smart Investing & Trading Score: 54 | |
| Day Percent Change: 0.67% Day Change: 0.10 | |
| Week Change: 3.1% Year-to-date Change: -12.1% | |
| JBGS Links: Profile News Message Board | |
| Charts:- Daily , Weekly | |
| Add JBGS to Watchlist: View: Get Complete JBGS Trend Analysis ➞ | |
 | WABC Westamerica Bancorporation |
| Sector: Financials | |
| SubSector: Regional - Pacific Banks | |
| MarketCap: 1557.69 Millions | |
| Recent Price: 49.57 Smart Investing & Trading Score: 68 | |
| Day Percent Change: 0.55% Day Change: 0.27 | |
| Week Change: -0.9% Year-to-date Change: -12.1% | |
| WABC Links: Profile News Message Board | |
| Charts:- Daily , Weekly | |
| Add WABC to Watchlist: View: Get Complete WABC Trend Analysis ➞ | |
 | CHMG Chemung Financial Corporation |
| Sector: Financials | |
| SubSector: Regional - Pacific Banks | |
| MarketCap: 142.229 Millions | |
| Recent Price: 43.70 Smart Investing & Trading Score: 100 | |
| Day Percent Change: 1.27% Day Change: 0.55 | |
| Week Change: 0.92% Year-to-date Change: -12.3% | |
| CHMG Links: Profile News Message Board | |
| Charts:- Daily , Weekly | |
| Add CHMG to Watchlist: View: Get Complete CHMG Trend Analysis ➞ | |
 | HFWA Heritage Financial Corporation |
| Sector: Financials | |
| SubSector: Regional - Pacific Banks | |
| MarketCap: 752.829 Millions | |
| Recent Price: 18.76 Smart Investing & Trading Score: 83 | |
| Day Percent Change: -0.11% Day Change: -0.02 | |
| Week Change: 0.05% Year-to-date Change: -12.3% | |
| HFWA Links: Profile News Message Board | |
| Charts:- Daily , Weekly | |
| Add HFWA to Watchlist: View: Get Complete HFWA Trend Analysis ➞ | |
 | JRVR James River Group Holdings, Ltd. |
| Sector: Financials | |
| SubSector: Property & Casualty Insurance | |
| MarketCap: 978.312 Millions | |
| Recent Price: 8.10 Smart Investing & Trading Score: 35 | |
| Day Percent Change: 1.63% Day Change: 0.13 | |
| Week Change: 5.19% Year-to-date Change: -12.3% | |
| JRVR Links: Profile News Message Board | |
| Charts:- Daily , Weekly | |
| Add JRVR to Watchlist: View: Get Complete JRVR Trend Analysis ➞ | |
 | PLYM Plymouth Industrial REIT, Inc. |
| Sector: Financials | |
| SubSector: REIT - Industrial | |
| MarketCap: 153.449 Millions | |
| Recent Price: 21.10 Smart Investing & Trading Score: 64 | |
| Day Percent Change: 1.39% Day Change: 0.29 | |
| Week Change: 1.1% Year-to-date Change: -12.3% | |
| PLYM Links: Profile News Message Board | |
| Charts:- Daily , Weekly | |
| Add PLYM to Watchlist: View: Get Complete PLYM Trend Analysis ➞ | |
 | NREF NexPoint Real Estate Finance, Inc. |
| Sector: Financials | |
| SubSector: REIT Diversified | |
| MarketCap: 97267 Millions | |
| Recent Price: 13.79 Smart Investing & Trading Score: 74 | |
| Day Percent Change: 1.25% Day Change: 0.17 | |
| Week Change: 3.22% Year-to-date Change: -12.4% | |
| NREF Links: Profile News Message Board | |
| Charts:- Daily , Weekly | |
| Add NREF to Watchlist: View: Get Complete NREF Trend Analysis ➞ | |
 | GLT P. H. Glatfelter Company |
| Sector: Consumer Staples | |
| SubSector: Paper & Paper Products | |
| MarketCap: 525.003 Millions | |
| Recent Price: 1.70 Smart Investing & Trading Score: 64 | |
| Day Percent Change: -2.30% Day Change: -0.04 | |
| Week Change: 4.29% Year-to-date Change: -12.4% | |
| GLT Links: Profile News Message Board | |
| Charts:- Daily , Weekly | |
| Add GLT to Watchlist: View: Get Complete GLT Trend Analysis ➞ | |
 | TBPH Theravance Biopharma, Inc. |
| Sector: Health Care | |
| SubSector: Biotechnology | |
| MarketCap: 1404.55 Millions | |
| Recent Price: 9.85 Smart Investing & Trading Score: 93 | |
| Day Percent Change: 4.90% Day Change: 0.46 | |
| Week Change: 5.01% Year-to-date Change: -12.4% | |
| TBPH Links: Profile News Message Board | |
| Charts:- Daily , Weekly | |
| Add TBPH to Watchlist: View: Get Complete TBPH Trend Analysis ➞ | |
 | SKIN The Beauty Health Company |
| Sector: Consumer Staples | |
| SubSector: Household & Personal Products | |
| MarketCap: 1070 Millions | |
| Recent Price: 2.77 Smart Investing & Trading Score: 25 | |
| Day Percent Change: -1.07% Day Change: -0.03 | |
| Week Change: 1.09% Year-to-date Change: -12.5% | |
| SKIN Links: Profile News Message Board | |
| Charts:- Daily , Weekly | |
| Add SKIN to Watchlist: View: Get Complete SKIN Trend Analysis ➞ | |
 | IIIN Insteel Industries, Inc. |
| Sector: Materials | |
| SubSector: Steel & Iron | |
| MarketCap: 269.488 Millions | |
| Recent Price: 33.43 Smart Investing & Trading Score: 32 | |
| Day Percent Change: 0.21% Day Change: 0.07 | |
| Week Change: -1.62% Year-to-date Change: -12.7% | |
| IIIN Links: Profile News Message Board | |
| Charts:- Daily , Weekly | |
| Add IIIN to Watchlist: View: Get Complete IIIN Trend Analysis ➞ | |
 | BANR Banner Corporation |
| Sector: Financials | |
| SubSector: Regional - Mid-Atlantic Banks | |
| MarketCap: 1187.09 Millions | |
| Recent Price: 46.76 Smart Investing & Trading Score: 83 | |
| Day Percent Change: -0.13% Day Change: -0.06 | |
| Week Change: 0.67% Year-to-date Change: -12.7% | |
| BANR Links: Profile News Message Board | |
| Charts:- Daily , Weekly | |
| Add BANR to Watchlist: View: Get Complete BANR Trend Analysis ➞ | |
 | QUAD Quad/Graphics, Inc. |
| Sector: Services & Goods | |
| SubSector: Business Services | |
| MarketCap: 205.182 Millions | |
| Recent Price: 4.73 Smart Investing & Trading Score: 32 | |
| Day Percent Change: -1.05% Day Change: -0.05 | |
| Week Change: -1.05% Year-to-date Change: -12.7% | |
| QUAD Links: Profile News Message Board | |
| Charts:- Daily , Weekly | |
| Add QUAD to Watchlist: View: Get Complete QUAD Trend Analysis ➞ | |
| Too many stocks? View smallcap stocks filtered by marketcap & sector |
| Marketcap: All SmallCap Stocks (default-no microcap), Large, Mid-Range, Small & MicroCap |
| Sector: Tech, Finance, Energy, Staples, Retail, Industrial, Materials, Utilities & Medical |
|
Best Stocks Today 12Stocks.com |
© 2024 12Stocks.com Terms & Conditions Privacy Contact Us
All Information Provided Only For Education And Not To Be Used For Investing or Trading. See Terms & Conditions


One More Thing ... Get Best Stocks Delivered Daily!
Never Ever Miss A Move With Our Top Ten Stocks Lists
Find Best Stocks In Any Market - Bull or Bear Market
Take A Peek At Our Top Ten Stocks Lists: Daily, Weekly, Year-to-Date & Top Trends
Find Best Stocks In Any Market - Bull or Bear Market
Take A Peek At Our Top Ten Stocks Lists: Daily, Weekly, Year-to-Date & Top Trends
Smallcap Stocks With Best Up Trends [0-bearish to 100-bullish]: BioCryst [100], CPI Card[100], MicroStrategy [100], J.Jill [100], Stoke [100], Astronics [100], PTC [100], Valhi [100], Generation Bio[100], Sterling Construction[100], Nurix [100]
Best Smallcap Stocks Year-to-Date:
CareMax [481.44%], Bakkt [446.19%], Janux [341.88%], Viking [299.84%], Longboard [245.99%], Alpine Immune[241.23%], Super Micro[235.03%], Avidity Biosciences[226.44%], Arcutis Bio[186.07%], Sweetgreen [182.39%], Vera [175.78%] Best Smallcap Stocks This Week:
Novavax [45.27%], MacroGenics [42.3%], LivePerson [40.88%], ProKidney [39.5%], Humacyte [37.66%], Eyenovia [37.43%], Harrow Health[37.28%], Treace Medical[35.84%], SunPower [35.22%], Emergent BioSolutions[31.26%], Poseida [30.81%] Best Smallcap Stocks Daily:
Eyenovia [28.28%], OptimizeRx [25.67%], Treace Medical[19.00%], BioCryst [18.66%], Poseida [18.49%], CPI Card[16.56%], MicroStrategy [15.86%], Super Micro[15.81%], Douglas Elliman[15.18%], HilleVax [15.00%], Arcutis Bio[13.65%]