
 Login Sign Up


| |||||
 |  | ||||

| 12Stocks.com Market Intelligence |
Best SmallCap Stocks
|
| In a hurry? Small Cap Stock Lists: Performance Trends Table, Stock Charts
Sort Small Cap stocks: Daily, Weekly, Year-to-Date, Market Cap & Trends. Filter Small Cap stocks list by sector: Show all, Tech, Finance, Energy, Staples, Retail, Industrial, Materials, Utilities and HealthCare Filter Small Cap stocks list by size: All Large Medium Small and MicroCap |
| 12Stocks.com Small Cap Stocks Performances & Trends Daily | |||||||||
|
|  The overall Smart Investing & Trading Score is 100 (0-bearish to 100-bullish) which puts Small Cap index in short term bullish trend. The Smart Investing & Trading Score from previous trading session is 88 and hence an improvement of trend.
| ||||||||
Here are the Smart Investing & Trading Scores of the most requested small cap stocks at 12Stocks.com (click stock name for detailed review):
|


| 12Stocks.com: Investing in Smallcap Index with Stocks | |
|
The following table helps investors and traders sort through current performance and trends (as measured by Smart Investing & Trading Score) of various
stocks in the Smallcap Index. Quick View: Move mouse or cursor over stock symbol (ticker) to view short-term technical chart and over stock name to view long term chart. Click on  to add stock symbol to your watchlist and to add stock symbol to your watchlist and  to view watchlist. Click on any ticker or stock name for detailed market intelligence report for that stock. to view watchlist. Click on any ticker or stock name for detailed market intelligence report for that stock. |
12Stocks.com Performance of Stocks in Smallcap Index
| Ticker | Stock Name | Watchlist | Category | Recent Price | Smart Investing & Trading Score | Change % | YTD Change% |
| ANGO | AngioDynamics |   | Health Care | 6.36 | 100 | 3.08% | -18.88% |
| PX | P10 | | Financials | 8.28 | 60 | -0.48% | -18.98% |
| PFIS | Peoples Financial | | Financials | 39.44 | 74 | 0.41% | -19.01% |
| HQI | HireQuest | | Services & Goods | 12.43 | 52 | 1.06% | -19.02% |
| RLYB | Rallybio | | Health Care | 1.91 | 62 | 3.80% | -19.07% |
| SYNA | Synaptics | | Technology | 92.25 | 64 | 2.99% | -19.14% |
| ADPT | Adaptive Bio | | Health Care | 3.96 | 69 | 0.13% | -19.18% |
| REPL | Replimune Group | | Health Care | 6.81 | 60 | 1.49% | -19.22% |
| YELP | Yelp | | Technology | 38.23 | 48 | 1.35% | -19.24% |
| AMCX | AMC s | | Services & Goods | 15.15 | 83 | -4.30% | -19.37% |
| TITN | Titan Machinery | | Services & Goods | 23.28 | 42 | -0.68% | -19.39% |
| PPBI | Pacific Premier | | Financials | 23.45 | 95 | 0.73% | -19.44% |
| BMBL | Bumble | | Technology | 11.97 | 88 | -0.08% | -19.45% |
| LGIH | LGI Homes | | Financials | 107.23 | 74 | 5.70% | -19.47% |
| MCS | Marcus | | Services & Goods | 11.74 | 39 | -0.51% | -19.48% |
| MOFG | MidWestOne Financial | | Financials | 21.66 | 62 | 0.88% | -19.51% |
| INSM | Insmed | | Health Care | 24.93 | 18 | -2.04% | -19.55% |
| NVCT | Nuvectis Pharma | | Health Care | 6.65 | 60 | -1.77% | -19.59% |
| CZNC | Citizens & Northern | | Financials | 18.03 | 67 | 2.39% | -19.62% |
| AMN | AMN Healthcare | | Industrials | 60.18 | 90 | -3.50% | -19.63% |
| BCOV | Brightcove | | Technology | 2.08 | 74 | 4.00% | -19.69% |
| FCCO | First Community | | Financials | 17.28 | 100 | 6.11% | -19.74% |
| ZEUS | Olympic Steel | | Materials | 53.51 | 17 | 1.77% | -19.78% |
| CFFN | Capitol Federal | | Financials | 5.17 | 74 | 0.98% | -19.84% |
| PWSC | PowerSchool | | Technology | 18.95 | 57 | 3.44% | -19.84% |


| Too many stocks? View smallcap stocks filtered by marketcap & sector |
| Marketcap: All SmallCap Stocks (default-no microcap), Large, Mid-Range, Small |
| Smallcap Sector: Tech, Finance, Energy, Staples, Retail, Industrial, Materials, & Medical |
|
Get the most comprehensive stock market coverage daily at 12Stocks.com ➞ Best Stocks Today ➞ Best Stocks Weekly ➞ Best Stocks Year-to-Date ➞ Best Stocks Trends ➞  Best Stocks Today 12Stocks.com Best Nasdaq Stocks ➞ Best S&P 500 Stocks ➞ Best Tech Stocks ➞ Best Biotech Stocks ➞ |
| Detailed Overview of SmallCap Stocks |
| SmallCap Technical Overview, Leaders & Laggards, Top SmallCap ETF Funds & Detailed SmallCap Stocks List, Charts, Trends & More |
| Smallcap: Technical Analysis, Trends & YTD Performance | |
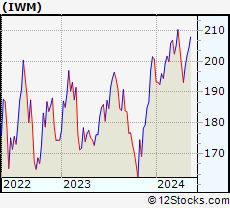
| SmallCap segment as represented by
IWM, an exchange-traded fund [ETF], holds basket of thousands of smallcap stocks from across all major sectors of the US stock market. The smallcap index (contains stocks like Riverbed & Sotheby's) is up by 4.35% and is currently underperforming the overall market by -6.37% year-to-date. Below is a quick view of technical charts and trends: | |
 IWM Weekly Chart |
|
| Long Term Trend: Very Good | |
| Medium Term Trend: Very Good | |
 IWM Daily Chart |
|
| Short Term Trend: Very Good | |
| Overall Trend Score: 100 | |
| YTD Performance: 4.35% | |
| **Trend Scores & Views Are Only For Educational Purposes And Not For Investing | |
| 12Stocks.com: Top Performing Small Cap Index Stocks | ||||||||||||||||||||||||||||||||||||||||||||||||
 The top performing Small Cap Index stocks year to date are
Now, more recently, over last week, the top performing Small Cap Index stocks on the move are


|
||||||||||||||||||||||||||||||||||||||||||||||||
| 12Stocks.com: Investing in Smallcap Index using Exchange Traded Funds | |
|
The following table shows list of key exchange traded funds (ETF) that
help investors track Smallcap index. The following list also includes leveraged ETF funds that track twice or thrice the daily returns of Smallcap indices. Short or inverse ETF funds move in the opposite direction to the index they track and are useful during market pullbacks or during bear markets. Quick View: Move mouse or cursor over ETF symbol (ticker) to view short-term technical chart and over ETF name to view long term chart. Click on ticker or stock name for detailed view. Click on to add stock symbol to your watchlist and to view watchlist. |
12Stocks.com List of ETFs that track Smallcap Index
| Ticker | ETF Name | Watchlist | Recent Price | Smart Investing & Trading Score | Change % | Week % | Year-to-date % |
| IWM | iShares Russell 2000 | | 209.44 | 100 | 1.25 | 2.51 | 4.35% |
| VTWO | Vanguard Russell 2000 ETF | | 84.63 | 95 | 1.35 | 2.43 | 4.35% |
| IJR | iShares Core S&P Small-Cap | | 110.78 | 95 | 0.34 | 1.65 | 2.34% |
| IJS | iShares S&P Small-Cap 600 Value | | 102.13 | 95 | -0.08 | 1.6 | -0.91% |
| IJT | iShares S&P Small-Cap 600 Growth | | 132.20 | 100 | 1.13 | 1.8 | 5.64% |
| IWN | iShares Russell 2000 Value | | 158.72 | 95 | 0.58 | 1.62 | 2.18% |
| IWO | iShares Russell 2000 Growth | | 266.58 | 100 | 1.17 | 2.56 | 5.69% |
| XSLV | PowerShares S&P SmallCap Low Volatil ETF | | 44.49 | 83 | 0.37 | 0.59 | 0.77% |
| SAA | ProShares Ultra SmallCap600 | | 25.20 | 85 | 0.90 | 3.51 | 1.02% |
| SMLV | SPDR SSGA US Small Cap Low Volatil ETF | | 112.54 | 95 | 0.80 | 1.19 | 0.02% |
| SBB | ProShares Short SmallCap600 | | 15.66 | 10 | -0.70 | -1.85 | -1.69% |
| SDD | ProShares UltraShort SmallCap600 | | 17.67 | 20 | -1.22 | -3.34 | -4.11% |
| 12Stocks.com: Charts, Trends, Fundamental Data and Performances of SmallCap Stocks | |
|
We now take in-depth look at all SmallCap stocks including charts, multi-period performances and overall trends (as measured by Smart Investing & Trading Score). One can sort SmallCap stocks (click link to choose) by Daily, Weekly and by Year-to-Date performances. Also, one can sort by size of the company or by market capitalization. |
| Select Your Default Chart Type: | |||||
| |||||
| Click on stock symbol or name for detailed view. Click on to add stock symbol to your watchlist and to view watchlist. Quick View: Move mouse or cursor over "Daily" to quickly view daily technical stock chart and over "Weekly" to view weekly technical stock chart. | |||||

 | ANGO AngioDynamics, Inc. |
| Sector: Health Care | |
| SubSector: Medical Instruments & Supplies | |
| MarketCap: 370.86 Millions | |
| Recent Price: 6.36 Smart Investing & Trading Score: 100 | |
| Day Percent Change: 3.08% Day Change: 0.19 | |
| Week Change: 5.12% Year-to-date Change: -18.9% | |
| ANGO Links: Profile News Message Board | |
| Charts:- Daily , Weekly | |
| Add ANGO to Watchlist: View: Get Complete ANGO Trend Analysis ➞ | |
 | PX P10, Inc. |
| Sector: Financials | |
| SubSector: Asset Management | |
| MarketCap: 1300 Millions | |
| Recent Price: 8.28 Smart Investing & Trading Score: 60 | |
| Day Percent Change: -0.48% Day Change: -0.04 | |
| Week Change: 1.22% Year-to-date Change: -19.0% | |
| PX Links: Profile News Message Board | |
| Charts:- Daily , Weekly | |
| Add PX to Watchlist: View: Get Complete PX Trend Analysis ➞ | |
 | PFIS Peoples Financial Services Corp. |
| Sector: Financials | |
| SubSector: Regional - Northeast Banks | |
| MarketCap: 305.499 Millions | |
| Recent Price: 39.44 Smart Investing & Trading Score: 74 | |
| Day Percent Change: 0.41% Day Change: 0.16 | |
| Week Change: 2.04% Year-to-date Change: -19.0% | |
| PFIS Links: Profile News Message Board | |
| Charts:- Daily , Weekly | |
| Add PFIS to Watchlist: View: Get Complete PFIS Trend Analysis ➞ | |
 | HQI HireQuest, Inc. |
| Sector: Services & Goods | |
| SubSector: Staffing & Outsourcing Services | |
| MarketCap: 77 Millions | |
| Recent Price: 12.43 Smart Investing & Trading Score: 52 | |
| Day Percent Change: 1.06% Day Change: 0.13 | |
| Week Change: 4.45% Year-to-date Change: -19.0% | |
| HQI Links: Profile News Message Board | |
| Charts:- Daily , Weekly | |
| Add HQI to Watchlist: View: Get Complete HQI Trend Analysis ➞ | |
 | RLYB Rallybio Corporation |
| Sector: Health Care | |
| SubSector: Biotechnology | |
| MarketCap: 226 Millions | |
| Recent Price: 1.91 Smart Investing & Trading Score: 62 | |
| Day Percent Change: 3.80% Day Change: 0.07 | |
| Week Change: 4.37% Year-to-date Change: -19.1% | |
| RLYB Links: Profile News Message Board | |
| Charts:- Daily , Weekly | |
| Add RLYB to Watchlist: View: Get Complete RLYB Trend Analysis ➞ | |
 | SYNA Synaptics Incorporated |
| Sector: Technology | |
| SubSector: Application Software | |
| MarketCap: 1822.82 Millions | |
| Recent Price: 92.25 Smart Investing & Trading Score: 64 | |
| Day Percent Change: 2.99% Day Change: 2.68 | |
| Week Change: 3.72% Year-to-date Change: -19.1% | |
| SYNA Links: Profile News Message Board | |
| Charts:- Daily , Weekly | |
| Add SYNA to Watchlist: View: Get Complete SYNA Trend Analysis ➞ | |
 | ADPT Adaptive Biotechnologies Corporation |
| Sector: Health Care | |
| SubSector: Biotechnology | |
| MarketCap: 3525.75 Millions | |
| Recent Price: 3.96 Smart Investing & Trading Score: 69 | |
| Day Percent Change: 0.13% Day Change: 0.00 | |
| Week Change: 13.14% Year-to-date Change: -19.2% | |
| ADPT Links: Profile News Message Board | |
| Charts:- Daily , Weekly | |
| Add ADPT to Watchlist: View: Get Complete ADPT Trend Analysis ➞ | |
 | REPL Replimune Group, Inc. |
| Sector: Health Care | |
| SubSector: Biotechnology | |
| MarketCap: 367.885 Millions | |
| Recent Price: 6.81 Smart Investing & Trading Score: 60 | |
| Day Percent Change: 1.49% Day Change: 0.10 | |
| Week Change: 6.24% Year-to-date Change: -19.2% | |
| REPL Links: Profile News Message Board | |
| Charts:- Daily , Weekly | |
| Add REPL to Watchlist: View: Get Complete REPL Trend Analysis ➞ | |
 | YELP Yelp Inc. |
| Sector: Technology | |
| SubSector: Internet Information Providers | |
| MarketCap: 1430.1 Millions | |
| Recent Price: 38.23 Smart Investing & Trading Score: 48 | |
| Day Percent Change: 1.35% Day Change: 0.51 | |
| Week Change: 3.91% Year-to-date Change: -19.2% | |
| YELP Links: Profile News Message Board | |
| Charts:- Daily , Weekly | |
| Add YELP to Watchlist: View: Get Complete YELP Trend Analysis ➞ | |
 | AMCX AMC Networks Inc. |
| Sector: Services & Goods | |
| SubSector: Entertainment - Diversified | |
| MarketCap: 1477.37 Millions | |
| Recent Price: 15.15 Smart Investing & Trading Score: 83 | |
| Day Percent Change: -4.30% Day Change: -0.68 | |
| Week Change: 14.43% Year-to-date Change: -19.4% | |
| AMCX Links: Profile News Message Board | |
| Charts:- Daily , Weekly | |
| Add AMCX to Watchlist: View: Get Complete AMCX Trend Analysis ➞ | |
 | TITN Titan Machinery Inc. |
| Sector: Services & Goods | |
| SubSector: Industrial Equipment Wholesale | |
| MarketCap: 208.958 Millions | |
| Recent Price: 23.28 Smart Investing & Trading Score: 42 | |
| Day Percent Change: -0.68% Day Change: -0.16 | |
| Week Change: -2.35% Year-to-date Change: -19.4% | |
| TITN Links: Profile News Message Board | |
| Charts:- Daily , Weekly | |
| Add TITN to Watchlist: View: Get Complete TITN Trend Analysis ➞ | |
 | PPBI Pacific Premier Bancorp, Inc. |
| Sector: Financials | |
| SubSector: Regional - Pacific Banks | |
| MarketCap: 978.029 Millions | |
| Recent Price: 23.45 Smart Investing & Trading Score: 95 | |
| Day Percent Change: 0.73% Day Change: 0.17 | |
| Week Change: 0.73% Year-to-date Change: -19.4% | |
| PPBI Links: Profile News Message Board | |
| Charts:- Daily , Weekly | |
| Add PPBI to Watchlist: View: Get Complete PPBI Trend Analysis ➞ | |
 | BMBL Bumble Inc. |
| Sector: Technology | |
| SubSector: Software - Application | |
| MarketCap: 2290 Millions | |
| Recent Price: 11.97 Smart Investing & Trading Score: 88 | |
| Day Percent Change: -0.08% Day Change: -0.01 | |
| Week Change: 4.54% Year-to-date Change: -19.5% | |
| BMBL Links: Profile News Message Board | |
| Charts:- Daily , Weekly | |
| Add BMBL to Watchlist: View: Get Complete BMBL Trend Analysis ➞ | |
 | LGIH LGI Homes, Inc. |
| Sector: Financials | |
| SubSector: Real Estate Development | |
| MarketCap: 1316.49 Millions | |
| Recent Price: 107.23 Smart Investing & Trading Score: 74 | |
| Day Percent Change: 5.70% Day Change: 5.78 | |
| Week Change: 7.89% Year-to-date Change: -19.5% | |
| LGIH Links: Profile News Message Board | |
| Charts:- Daily , Weekly | |
| Add LGIH to Watchlist: View: Get Complete LGIH Trend Analysis ➞ | |
 | MCS The Marcus Corporation |
| Sector: Services & Goods | |
| SubSector: Entertainment - Diversified | |
| MarketCap: 441.437 Millions | |
| Recent Price: 11.74 Smart Investing & Trading Score: 39 | |
| Day Percent Change: -0.51% Day Change: -0.06 | |
| Week Change: 1.65% Year-to-date Change: -19.5% | |
| MCS Links: Profile News Message Board | |
| Charts:- Daily , Weekly | |
| Add MCS to Watchlist: View: Get Complete MCS Trend Analysis ➞ | |
 | MOFG MidWestOne Financial Group, Inc. |
| Sector: Financials | |
| SubSector: Regional - Southwest Banks | |
| MarketCap: 345.265 Millions | |
| Recent Price: 21.66 Smart Investing & Trading Score: 62 | |
| Day Percent Change: 0.88% Day Change: 0.19 | |
| Week Change: -0.23% Year-to-date Change: -19.5% | |
| MOFG Links: Profile News Message Board | |
| Charts:- Daily , Weekly | |
| Add MOFG to Watchlist: View: Get Complete MOFG Trend Analysis ➞ | |
 | INSM Insmed Incorporated |
| Sector: Health Care | |
| SubSector: Biotechnology | |
| MarketCap: 1452.45 Millions | |
| Recent Price: 24.93 Smart Investing & Trading Score: 18 | |
| Day Percent Change: -2.04% Day Change: -0.52 | |
| Week Change: -4% Year-to-date Change: -19.6% | |
| INSM Links: Profile News Message Board | |
| Charts:- Daily , Weekly | |
| Add INSM to Watchlist: View: Get Complete INSM Trend Analysis ➞ | |
 | NVCT Nuvectis Pharma, Inc. |
| Sector: Health Care | |
| SubSector: Biotechnology | |
| MarketCap: 258 Millions | |
| Recent Price: 6.65 Smart Investing & Trading Score: 60 | |
| Day Percent Change: -1.77% Day Change: -0.12 | |
| Week Change: 3.91% Year-to-date Change: -19.6% | |
| NVCT Links: Profile News Message Board | |
| Charts:- Daily , Weekly | |
| Add NVCT to Watchlist: View: Get Complete NVCT Trend Analysis ➞ | |
 | CZNC Citizens & Northern Corporation |
| Sector: Financials | |
| SubSector: Regional - Mid-Atlantic Banks | |
| MarketCap: 274.459 Millions | |
| Recent Price: 18.03 Smart Investing & Trading Score: 67 | |
| Day Percent Change: 2.39% Day Change: 0.42 | |
| Week Change: 0.78% Year-to-date Change: -19.6% | |
| CZNC Links: Profile News Message Board | |
| Charts:- Daily , Weekly | |
| Add CZNC to Watchlist: View: Get Complete CZNC Trend Analysis ➞ | |
 | AMN AMN Healthcare Services, Inc. |
| Sector: Industrials | |
| SubSector: General Building Materials | |
| MarketCap: 3064.03 Millions | |
| Recent Price: 60.18 Smart Investing & Trading Score: 90 | |
| Day Percent Change: -3.50% Day Change: -2.18 | |
| Week Change: 10% Year-to-date Change: -19.6% | |
| AMN Links: Profile News Message Board | |
| Charts:- Daily , Weekly | |
| Add AMN to Watchlist: View: Get Complete AMN Trend Analysis ➞ | |
 | BCOV Brightcove Inc. |
| Sector: Technology | |
| SubSector: Application Software | |
| MarketCap: 266.162 Millions | |
| Recent Price: 2.08 Smart Investing & Trading Score: 74 | |
| Day Percent Change: 4.00% Day Change: 0.08 | |
| Week Change: 10.05% Year-to-date Change: -19.7% | |
| BCOV Links: Profile News Message Board | |
| Charts:- Daily , Weekly | |
| Add BCOV to Watchlist: View: Get Complete BCOV Trend Analysis ➞ | |
 | FCCO First Community Corporation |
| Sector: Financials | |
| SubSector: Regional - Southwest Banks | |
| MarketCap: 123.865 Millions | |
| Recent Price: 17.28 Smart Investing & Trading Score: 100 | |
| Day Percent Change: 6.11% Day Change: 1.00 | |
| Week Change: 7.13% Year-to-date Change: -19.7% | |
| FCCO Links: Profile News Message Board | |
| Charts:- Daily , Weekly | |
| Add FCCO to Watchlist: View: Get Complete FCCO Trend Analysis ➞ | |
 | ZEUS Olympic Steel, Inc. |
| Sector: Materials | |
| SubSector: Steel & Iron | |
| MarketCap: 118.888 Millions | |
| Recent Price: 53.51 Smart Investing & Trading Score: 17 | |
| Day Percent Change: 1.77% Day Change: 0.93 | |
| Week Change: -0.96% Year-to-date Change: -19.8% | |
| ZEUS Links: Profile News Message Board | |
| Charts:- Daily , Weekly | |
| Add ZEUS to Watchlist: View: Get Complete ZEUS Trend Analysis ➞ | |
 | CFFN Capitol Federal Financial, Inc. |
| Sector: Financials | |
| SubSector: Savings & Loans | |
| MarketCap: 1639.1 Millions | |
| Recent Price: 5.17 Smart Investing & Trading Score: 74 | |
| Day Percent Change: 0.98% Day Change: 0.05 | |
| Week Change: 1.57% Year-to-date Change: -19.8% | |
| CFFN Links: Profile News Message Board | |
| Charts:- Daily , Weekly | |
| Add CFFN to Watchlist: View: Get Complete CFFN Trend Analysis ➞ | |
 | PWSC PowerSchool Holdings, Inc. |
| Sector: Technology | |
| SubSector: Software - Application | |
| MarketCap: 3870 Millions | |
| Recent Price: 18.95 Smart Investing & Trading Score: 57 | |
| Day Percent Change: 3.44% Day Change: 0.63 | |
| Week Change: 4.64% Year-to-date Change: -19.8% | |
| PWSC Links: Profile News Message Board | |
| Charts:- Daily , Weekly | |
| Add PWSC to Watchlist: View: Get Complete PWSC Trend Analysis ➞ | |
| Too many stocks? View smallcap stocks filtered by marketcap & sector |
| Marketcap: All SmallCap Stocks (default-no microcap), Large, Mid-Range, Small & MicroCap |
| Sector: Tech, Finance, Energy, Staples, Retail, Industrial, Materials, Utilities & Medical |
|
Best Stocks Today 12Stocks.com |
© 2024 12Stocks.com Terms & Conditions Privacy Contact Us
All Information Provided Only For Education And Not To Be Used For Investing or Trading. See Terms & Conditions


One More Thing ... Get Best Stocks Delivered Daily!
Never Ever Miss A Move With Our Top Ten Stocks Lists
Find Best Stocks In Any Market - Bull or Bear Market
Take A Peek At Our Top Ten Stocks Lists: Daily, Weekly, Year-to-Date & Top Trends
Find Best Stocks In Any Market - Bull or Bear Market
Take A Peek At Our Top Ten Stocks Lists: Daily, Weekly, Year-to-Date & Top Trends
Smallcap Stocks With Best Up Trends [0-bearish to 100-bullish]: BioCryst [100], CPI Card[100], MicroStrategy [100], J.Jill [100], Stoke [100], Astronics [100], PTC [100], Valhi [100], Generation Bio[100], Sterling Construction[100], Nurix [100]
Best Smallcap Stocks Year-to-Date:
CareMax [481.44%], Bakkt [446.19%], Janux [341.88%], Viking [299.84%], Longboard [245.99%], Alpine Immune[241.23%], Super Micro[235.03%], Avidity Biosciences[226.44%], Arcutis Bio[186.07%], Sweetgreen [182.39%], Vera [175.78%] Best Smallcap Stocks This Week:
Novavax [45.27%], MacroGenics [42.3%], LivePerson [40.88%], ProKidney [39.5%], Humacyte [37.66%], Eyenovia [37.43%], Harrow Health[37.28%], Treace Medical[35.84%], SunPower [35.22%], Emergent BioSolutions[31.26%], Poseida [30.81%] Best Smallcap Stocks Daily:
Eyenovia [28.28%], OptimizeRx [25.67%], Treace Medical[19.00%], BioCryst [18.66%], Poseida [18.49%], CPI Card[16.56%], MicroStrategy [15.86%], Super Micro[15.81%], Douglas Elliman[15.18%], HilleVax [15.00%], Arcutis Bio[13.65%]