
 Login Sign Up


| |||||
 |  | ||||

| 12Stocks.com Market Intelligence |
Best SmallCap Stocks
|
| In a hurry? Small Cap Stock Lists: Performance Trends Table, Stock Charts
Sort Small Cap stocks: Daily, Weekly, Year-to-Date, Market Cap & Trends. Filter Small Cap stocks list by sector: Show all, Tech, Finance, Energy, Staples, Retail, Industrial, Materials, Utilities and HealthCare Filter Small Cap stocks list by size: All Large Medium Small and MicroCap |
| 12Stocks.com Small Cap Stocks Performances & Trends Daily | |||||||||
|
|  The overall Smart Investing & Trading Score is 23 (0-bearish to 100-bullish) which puts Small Cap index in short term bearish to neutral trend. The Smart Investing & Trading Score from previous trading session is 13 and hence an improvement of trend.
| ||||||||
Here are the Smart Investing & Trading Scores of the most requested small cap stocks at 12Stocks.com (click stock name for detailed review):
|


| 12Stocks.com: Investing in Smallcap Index with Stocks | |
|
The following table helps investors and traders sort through current performance and trends (as measured by Smart Investing & Trading Score) of various
stocks in the Smallcap Index. Quick View: Move mouse or cursor over stock symbol (ticker) to view short-term technical chart and over stock name to view long term chart. Click on  to add stock symbol to your watchlist and to add stock symbol to your watchlist and  to view watchlist. Click on any ticker or stock name for detailed market intelligence report for that stock. to view watchlist. Click on any ticker or stock name for detailed market intelligence report for that stock. |
12Stocks.com Performance of Stocks in Smallcap Index
| Ticker | Stock Name | Watchlist | Category | Recent Price | Smart Investing & Trading Score | Change % | YTD Change% |
| CGEM | Cullinan Oncology |   | Health Care | 18.98 | 100 | 6.42% | 86.22% |
| OSCR | Oscar Health | | Health Care | 16.53 | 100 | 6.37% | 81.55% |
| NN | NextNav | | Technology | 8.12 | 100 | 4.24% | 82.47% |
| SATS | EchoStar | | Technology | 14.56 | 100 | 3.93% | -12.13% |
| VCTR | Victory Capital | | Financials | 45.90 | 100 | 2.78% | 33.28% |
| BMI | Badger Meter | | Technology | 178.48 | 100 | 16.65% | 15.62% |
| MCBC | Macatawa Bank | | Financials | 13.85 | 100 | 1.17% | 22.78% |
| IMAX | IMAX | | Services & Goods | 17.11 | 100 | 0.23% | 13.91% |
| ENV | Envestnet | | Services & Goods | 62.22 | 100 | 0.03% | 25.65% |
| ALXO | ALX Oncology | | Health Care | 15.72 | 100 | -2.24% | 5.65% |
| AGX | Argan | | Industrials | 60.99 | 95 | 1.57% | 30.35% |
| AOMR | Angel Oak | | Financials | 11.21 | 95 | 1.08% | 5.66% |
| IE | Ivanhoe Electric | | Materials | 10.80 | 93 | 3.95% | 6.56% |
| PRCT | PROCEPT BioRobotics | | Health Care | 53.61 | 93 | 3.51% | 26.62% |
| GCI | Gannett Co | | Services & Goods | 2.50 | 93 | 3.31% | 8.70% |
| CRS | Carpenter | | Industrials | 79.38 | 93 | 2.08% | 12.12% |
| ZURA | Zura Bio | | Health Care | 3.68 | 93 | 17.20% | -21.45% |
| RPHM | Reneo | | Health Care | 1.76 | 93 | 0.57% | 8.64% |
| VNDA | Vanda | | Health Care | 4.97 | 93 | -5.15% | 17.77% |
| ZUO | Zuora | | Technology | 9.27 | 93 | -2.01% | -1.38% |
| LNTH | Lantheus | | Health Care | 62.33 | 93 | 1.38% | 0.53% |
| SENEA | Seneca Foods | | Consumer Staples | 56.78 | 93 | 1.07% | 8.28% |
| AIR | AAR | | Industrials | 63.03 | 90 | 1.87% | 1.01% |
| MCY | Mercury General | | Financials | 52.67 | 90 | 1.23% | 41.17% |
| WINA | Winmark | | Services & Goods | 366.00 | 90 | -0.68% | -12.35% |


| Too many stocks? View smallcap stocks filtered by marketcap & sector |
| Marketcap: All SmallCap Stocks (default-no microcap), Large, Mid-Range, Small |
| Smallcap Sector: Tech, Finance, Energy, Staples, Retail, Industrial, Materials, & Medical |
|
Get the most comprehensive stock market coverage daily at 12Stocks.com ➞ Best Stocks Today ➞ Best Stocks Weekly ➞ Best Stocks Year-to-Date ➞ Best Stocks Trends ➞  Best Stocks Today 12Stocks.com Best Nasdaq Stocks ➞ Best S&P 500 Stocks ➞ Best Tech Stocks ➞ Best Biotech Stocks ➞ |
| Detailed Overview of SmallCap Stocks |
| SmallCap Technical Overview, Leaders & Laggards, Top SmallCap ETF Funds & Detailed SmallCap Stocks List, Charts, Trends & More |
| Smallcap: Technical Analysis, Trends & YTD Performance | |
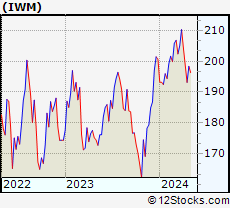
| SmallCap segment as represented by
IWM, an exchange-traded fund [ETF], holds basket of thousands of smallcap stocks from across all major sectors of the US stock market. The smallcap index (contains stocks like Riverbed & Sotheby's) is down by -3.92% and is currently underperforming the overall market by -8.11% year-to-date. Below is a quick view of technical charts and trends: | |
 IWM Weekly Chart |
|
| Long Term Trend: Not Good | |
| Medium Term Trend: Not Good | |
 IWM Daily Chart |
|
| Short Term Trend: Not Good | |
| Overall Trend Score: 23 | |
| YTD Performance: -3.92% | |
| **Trend Scores & Views Are Only For Educational Purposes And Not For Investing | |
| 12Stocks.com: Top Performing Small Cap Index Stocks | ||||||||||||||||||||||||||||||||||||||||||||||||
 The top performing Small Cap Index stocks year to date are
Now, more recently, over last week, the top performing Small Cap Index stocks on the move are


|
||||||||||||||||||||||||||||||||||||||||||||||||
| 12Stocks.com: Investing in Smallcap Index using Exchange Traded Funds | |
|
The following table shows list of key exchange traded funds (ETF) that
help investors track Smallcap index. The following list also includes leveraged ETF funds that track twice or thrice the daily returns of Smallcap indices. Short or inverse ETF funds move in the opposite direction to the index they track and are useful during market pullbacks or during bear markets. Quick View: Move mouse or cursor over ETF symbol (ticker) to view short-term technical chart and over ETF name to view long term chart. Click on ticker or stock name for detailed view. Click on to add stock symbol to your watchlist and to view watchlist. |
12Stocks.com List of ETFs that track Smallcap Index
| Ticker | ETF Name | Watchlist | Recent Price | Smart Investing & Trading Score | Change % | Week % | Year-to-date % |
| IWM | iShares Russell 2000 | | 192.84 | 23 | -0.08 | -2.94 | -3.92% |
| IJR | iShares Core S&P Small-Cap | | 102.34 | 31 | 0.21 | -2.08 | -5.46% |
| VTWO | Vanguard Russell 2000 ETF | | 77.95 | 23 | -0.13 | -2.95 | -3.88% |
| IWN | iShares Russell 2000 Value | | 146.33 | 10 | 0.21 | -2.69 | -5.79% |
| IJS | iShares S&P Small-Cap 600 Value | | 94.51 | 10 | 0.41 | -1.73 | -8.31% |
| IWO | iShares Russell 2000 Growth | | 246.94 | 36 | -0.44 | -3.3 | -2.09% |
| IJT | iShares S&P Small-Cap 600 Growth | | 121.57 | 23 | -0.22 | -2.57 | -2.85% |
| XSLV | PowerShares S&P SmallCap Low Volatil ETF | | 41.65 | 25 | 0.56 | -1.05 | -5.66% |
| SAA | ProShares Ultra SmallCap600 | | 21.62 | 10 | -0.18 | -4.17 | -13.35% |
| SMLV | SPDR SSGA US Small Cap Low Volatil ETF | | 103.83 | 10 | 0.16 | -1.13 | -7.72% |
| SBB | ProShares Short SmallCap600 | | 16.98 | 95 | 0.77 | 2.62 | 6.59% |
| SDD | ProShares UltraShort SmallCap600 | | 20.69 | 83 | 0.44 | 4.33 | 12.28% |
| 12Stocks.com: Charts, Trends, Fundamental Data and Performances of SmallCap Stocks | |
|
We now take in-depth look at all SmallCap stocks including charts, multi-period performances and overall trends (as measured by Smart Investing & Trading Score). One can sort SmallCap stocks (click link to choose) by Daily, Weekly and by Year-to-Date performances. Also, one can sort by size of the company or by market capitalization. |
| Select Your Default Chart Type: | |||||
| |||||
| Click on stock symbol or name for detailed view. Click on to add stock symbol to your watchlist and to view watchlist. Quick View: Move mouse or cursor over "Daily" to quickly view daily technical stock chart and over "Weekly" to view weekly technical stock chart. | |||||

 | CGEM Cullinan Oncology, Inc. |
| Sector: Health Care | |
| SubSector: Biotechnology | |
| MarketCap: 433 Millions | |
| Recent Price: 18.98 Smart Investing & Trading Score: 100 | |
| Day Percent Change: 6.42% Day Change: 1.14 | |
| Week Change: 13.89% Year-to-date Change: 86.2% | |
| CGEM Links: Profile News Message Board | |
| Charts:- Daily , Weekly | |
| Add CGEM to Watchlist: View: Get Complete CGEM Trend Analysis ➞ | |
 | OSCR Oscar Health, Inc. |
| Sector: Health Care | |
| SubSector: Healthcare Plans | |
| MarketCap: 1790 Millions | |
| Recent Price: 16.53 Smart Investing & Trading Score: 100 | |
| Day Percent Change: 6.37% Day Change: 0.99 | |
| Week Change: 12.14% Year-to-date Change: 81.6% | |
| OSCR Links: Profile News Message Board | |
| Charts:- Daily , Weekly | |
| Add OSCR to Watchlist: View: Get Complete OSCR Trend Analysis ➞ | |
 | NN NextNav Inc. |
| Sector: Technology | |
| SubSector: Software - Infrastructure | |
| MarketCap: 314 Millions | |
| Recent Price: 8.12 Smart Investing & Trading Score: 100 | |
| Day Percent Change: 4.24% Day Change: 0.33 | |
| Week Change: 9.58% Year-to-date Change: 82.5% | |
| NN Links: Profile News Message Board | |
| Charts:- Daily , Weekly | |
| Add NN to Watchlist: View: Get Complete NN Trend Analysis ➞ | |
 | SATS EchoStar Corporation |
| Sector: Technology | |
| SubSector: Communication Equipment | |
| MarketCap: 3175.69 Millions | |
| Recent Price: 14.56 Smart Investing & Trading Score: 100 | |
| Day Percent Change: 3.93% Day Change: 0.55 | |
| Week Change: 2.54% Year-to-date Change: -12.1% | |
| SATS Links: Profile News Message Board | |
| Charts:- Daily , Weekly | |
| Add SATS to Watchlist: View: Get Complete SATS Trend Analysis ➞ | |
 | VCTR Victory Capital Holdings, Inc. |
| Sector: Financials | |
| SubSector: Asset Management | |
| MarketCap: 1148.33 Millions | |
| Recent Price: 45.90 Smart Investing & Trading Score: 100 | |
| Day Percent Change: 2.78% Day Change: 1.24 | |
| Week Change: 6.87% Year-to-date Change: 33.3% | |
| VCTR Links: Profile News Message Board | |
| Charts:- Daily , Weekly | |
| Add VCTR to Watchlist: View: Get Complete VCTR Trend Analysis ➞ | |
 | BMI Badger Meter, Inc. |
| Sector: Technology | |
| SubSector: Scientific & Technical Instruments | |
| MarketCap: 1530.53 Millions | |
| Recent Price: 178.48 Smart Investing & Trading Score: 100 | |
| Day Percent Change: 16.65% Day Change: 25.48 | |
| Week Change: 16.72% Year-to-date Change: 15.6% | |
| BMI Links: Profile News Message Board | |
| Charts:- Daily , Weekly | |
| Add BMI to Watchlist: View: Get Complete BMI Trend Analysis ➞ | |
 | MCBC Macatawa Bank Corporation |
| Sector: Financials | |
| SubSector: Regional - Midwest Banks | |
| MarketCap: 264.37 Millions | |
| Recent Price: 13.85 Smart Investing & Trading Score: 100 | |
| Day Percent Change: 1.17% Day Change: 0.16 | |
| Week Change: 44.42% Year-to-date Change: 22.8% | |
| MCBC Links: Profile News Message Board | |
| Charts:- Daily , Weekly | |
| Add MCBC to Watchlist: View: Get Complete MCBC Trend Analysis ➞ | |
 | IMAX IMAX Corporation |
| Sector: Services & Goods | |
| SubSector: Entertainment - Diversified | |
| MarketCap: 874.237 Millions | |
| Recent Price: 17.11 Smart Investing & Trading Score: 100 | |
| Day Percent Change: 0.23% Day Change: 0.04 | |
| Week Change: 4.14% Year-to-date Change: 13.9% | |
| IMAX Links: Profile News Message Board | |
| Charts:- Daily , Weekly | |
| Add IMAX to Watchlist: View: Get Complete IMAX Trend Analysis ➞ | |
 | ENV Envestnet, Inc. |
| Sector: Services & Goods | |
| SubSector: Business Services | |
| MarketCap: 3114.02 Millions | |
| Recent Price: 62.22 Smart Investing & Trading Score: 100 | |
| Day Percent Change: 0.03% Day Change: 0.02 | |
| Week Change: 8.59% Year-to-date Change: 25.7% | |
| ENV Links: Profile News Message Board | |
| Charts:- Daily , Weekly | |
| Add ENV to Watchlist: View: Get Complete ENV Trend Analysis ➞ | |
 | ALXO ALX Oncology Holdings Inc. |
| Sector: Health Care | |
| SubSector: Biotechnology | |
| MarketCap: 41787 Millions | |
| Recent Price: 15.72 Smart Investing & Trading Score: 100 | |
| Day Percent Change: -2.24% Day Change: -0.36 | |
| Week Change: 20.64% Year-to-date Change: 5.7% | |
| ALXO Links: Profile News Message Board | |
| Charts:- Daily , Weekly | |
| Add ALXO to Watchlist: View: Get Complete ALXO Trend Analysis ➞ | |
 | AGX Argan, Inc. |
| Sector: Industrials | |
| SubSector: Heavy Construction | |
| MarketCap: 664.095 Millions | |
| Recent Price: 60.99 Smart Investing & Trading Score: 95 | |
| Day Percent Change: 1.57% Day Change: 0.94 | |
| Week Change: 2.04% Year-to-date Change: 30.4% | |
| AGX Links: Profile News Message Board | |
| Charts:- Daily , Weekly | |
| Add AGX to Watchlist: View: Get Complete AGX Trend Analysis ➞ | |
 | AOMR Angel Oak Mortgage REIT, Inc. |
| Sector: Financials | |
| SubSector: REIT - Mortgage | |
| MarketCap: 202 Millions | |
| Recent Price: 11.21 Smart Investing & Trading Score: 95 | |
| Day Percent Change: 1.08% Day Change: 0.12 | |
| Week Change: 1.72% Year-to-date Change: 5.7% | |
| AOMR Links: Profile News Message Board | |
| Charts:- Daily , Weekly | |
| Add AOMR to Watchlist: View: Get Complete AOMR Trend Analysis ➞ | |
 | IE Ivanhoe Electric Inc. |
| Sector: Materials | |
| SubSector: Copper | |
| MarketCap: 1200 Millions | |
| Recent Price: 10.80 Smart Investing & Trading Score: 93 | |
| Day Percent Change: 3.95% Day Change: 0.41 | |
| Week Change: 3.25% Year-to-date Change: 6.6% | |
| IE Links: Profile News Message Board | |
| Charts:- Daily , Weekly | |
| Add IE to Watchlist: View: Get Complete IE Trend Analysis ➞ | |
 | PRCT PROCEPT BioRobotics Corporation |
| Sector: Health Care | |
| SubSector: Medical Devices | |
| MarketCap: 1600 Millions | |
| Recent Price: 53.61 Smart Investing & Trading Score: 93 | |
| Day Percent Change: 3.51% Day Change: 1.82 | |
| Week Change: 5.72% Year-to-date Change: 26.6% | |
| PRCT Links: Profile News Message Board | |
| Charts:- Daily , Weekly | |
| Add PRCT to Watchlist: View: Get Complete PRCT Trend Analysis ➞ | |
 | GCI Gannett Co., Inc. |
| Sector: Services & Goods | |
| SubSector: Publishing - Newspapers | |
| MarketCap: 222.322 Millions | |
| Recent Price: 2.50 Smart Investing & Trading Score: 93 | |
| Day Percent Change: 3.31% Day Change: 0.08 | |
| Week Change: 5.04% Year-to-date Change: 8.7% | |
| GCI Links: Profile News Message Board | |
| Charts:- Daily , Weekly | |
| Add GCI to Watchlist: View: Get Complete GCI Trend Analysis ➞ | |
 | CRS Carpenter Technology Corporation |
| Sector: Industrials | |
| SubSector: Metal Fabrication | |
| MarketCap: 853.35 Millions | |
| Recent Price: 79.38 Smart Investing & Trading Score: 93 | |
| Day Percent Change: 2.08% Day Change: 1.62 | |
| Week Change: 2.43% Year-to-date Change: 12.1% | |
| CRS Links: Profile News Message Board | |
| Charts:- Daily , Weekly | |
| Add CRS to Watchlist: View: Get Complete CRS Trend Analysis ➞ | |
 | ZURA Zura Bio Limited |
| Sector: Health Care | |
| SubSector: Biotechnology | |
| MarketCap: 242 Millions | |
| Recent Price: 3.68 Smart Investing & Trading Score: 93 | |
| Day Percent Change: 17.20% Day Change: 0.54 | |
| Week Change: 9.52% Year-to-date Change: -21.5% | |
| ZURA Links: Profile News Message Board | |
| Charts:- Daily , Weekly | |
| Add ZURA to Watchlist: View: Get Complete ZURA Trend Analysis ➞ | |
 | RPHM Reneo Pharmaceuticals, Inc. |
| Sector: Health Care | |
| SubSector: Biotechnology | |
| MarketCap: 233 Millions | |
| Recent Price: 1.76 Smart Investing & Trading Score: 93 | |
| Day Percent Change: 0.57% Day Change: 0.01 | |
| Week Change: 1.73% Year-to-date Change: 8.6% | |
| RPHM Links: Profile News Message Board | |
| Charts:- Daily , Weekly | |
| Add RPHM to Watchlist: View: Get Complete RPHM Trend Analysis ➞ | |
 | VNDA Vanda Pharmaceuticals Inc. |
| Sector: Health Care | |
| SubSector: Biotechnology | |
| MarketCap: 464.585 Millions | |
| Recent Price: 4.97 Smart Investing & Trading Score: 93 | |
| Day Percent Change: -5.15% Day Change: -0.27 | |
| Week Change: 20.63% Year-to-date Change: 17.8% | |
| VNDA Links: Profile News Message Board | |
| Charts:- Daily , Weekly | |
| Add VNDA to Watchlist: View: Get Complete VNDA Trend Analysis ➞ | |
 | ZUO Zuora, Inc. |
| Sector: Technology | |
| SubSector: Application Software | |
| MarketCap: 1063.22 Millions | |
| Recent Price: 9.27 Smart Investing & Trading Score: 93 | |
| Day Percent Change: -2.01% Day Change: -0.19 | |
| Week Change: 7.79% Year-to-date Change: -1.4% | |
| ZUO Links: Profile News Message Board | |
| Charts:- Daily , Weekly | |
| Add ZUO to Watchlist: View: Get Complete ZUO Trend Analysis ➞ | |
 | LNTH Lantheus Holdings, Inc. |
| Sector: Health Care | |
| SubSector: Medical Appliances & Equipment | |
| MarketCap: 467.18 Millions | |
| Recent Price: 62.33 Smart Investing & Trading Score: 93 | |
| Day Percent Change: 1.38% Day Change: 0.85 | |
| Week Change: 2.53% Year-to-date Change: 0.5% | |
| LNTH Links: Profile News Message Board | |
| Charts:- Daily , Weekly | |
| Add LNTH to Watchlist: View: Get Complete LNTH Trend Analysis ➞ | |
 | SENEA Seneca Foods Corporation |
| Sector: Consumer Staples | |
| SubSector: Processed & Packaged Goods | |
| MarketCap: 326.348 Millions | |
| Recent Price: 56.78 Smart Investing & Trading Score: 93 | |
| Day Percent Change: 1.07% Day Change: 0.60 | |
| Week Change: 2.05% Year-to-date Change: 8.3% | |
| SENEA Links: Profile News Message Board | |
| Charts:- Daily , Weekly | |
| Add SENEA to Watchlist: View: Get Complete SENEA Trend Analysis ➞ | |
 | AIR AAR Corp. |
| Sector: Industrials | |
| SubSector: Aerospace/Defense Products & Services | |
| MarketCap: 591.701 Millions | |
| Recent Price: 63.03 Smart Investing & Trading Score: 90 | |
| Day Percent Change: 1.87% Day Change: 1.16 | |
| Week Change: 3.68% Year-to-date Change: 1.0% | |
| AIR Links: Profile News Message Board | |
| Charts:- Daily , Weekly | |
| Add AIR to Watchlist: View: Get Complete AIR Trend Analysis ➞ | |
 | MCY Mercury General Corporation |
| Sector: Financials | |
| SubSector: Property & Casualty Insurance | |
| MarketCap: 2122.12 Millions | |
| Recent Price: 52.67 Smart Investing & Trading Score: 90 | |
| Day Percent Change: 1.23% Day Change: 0.64 | |
| Week Change: 3.48% Year-to-date Change: 41.2% | |
| MCY Links: Profile News Message Board | |
| Charts:- Daily , Weekly | |
| Add MCY to Watchlist: View: Get Complete MCY Trend Analysis ➞ | |
 | WINA Winmark Corporation |
| Sector: Services & Goods | |
| SubSector: Specialty Retail, Other | |
| MarketCap: 520.444 Millions | |
| Recent Price: 366.00 Smart Investing & Trading Score: 90 | |
| Day Percent Change: -0.68% Day Change: -2.50 | |
| Week Change: 6.52% Year-to-date Change: -12.4% | |
| WINA Links: Profile News Message Board | |
| Charts:- Daily , Weekly | |
| Add WINA to Watchlist: View: Get Complete WINA Trend Analysis ➞ | |
| Too many stocks? View smallcap stocks filtered by marketcap & sector |
| Marketcap: All SmallCap Stocks (default-no microcap), Large, Mid-Range, Small & MicroCap |
| Sector: Tech, Finance, Energy, Staples, Retail, Industrial, Materials, Utilities & Medical |
|
Best Stocks Today 12Stocks.com |
© 2024 12Stocks.com Terms & Conditions Privacy Contact Us
All Information Provided Only For Education And Not To Be Used For Investing or Trading. See Terms & Conditions


One More Thing ... Get Best Stocks Delivered Daily!
Never Ever Miss A Move With Our Top Ten Stocks Lists
Find Best Stocks In Any Market - Bull or Bear Market
Take A Peek At Our Top Ten Stocks Lists: Daily, Weekly, Year-to-Date & Top Trends
Find Best Stocks In Any Market - Bull or Bear Market
Take A Peek At Our Top Ten Stocks Lists: Daily, Weekly, Year-to-Date & Top Trends
Smallcap Stocks With Best Up Trends [0-bearish to 100-bullish]: Badger Meter[100], Cullinan Oncology[100], Oscar Health[100], NextNav [100], EchoStar [100], Victory Capital[100], Macatawa Bank[100], IMAX [100], Envestnet [100], ALX Oncology[100], Argan [95]
Best Smallcap Stocks Year-to-Date:
Agenus [500.31%], CareMax [417.53%], Janux [348.12%], Viking [247.5%], Alpine Immune[238.5%], Super Micro[226.63%], Longboard [194.76%], Arcutis Bio[192.57%], Vera [161.3%], Avidity Biosciences[154.87%], Hippo [128.32%] Best Smallcap Stocks This Week:
Macatawa Bank[44.42%], 23andMe Holding[33.3%], ProKidney [32%], Snap One[29.73%], Vertex Energy[25.96%], ALX Oncology[20.64%], Vanda [20.63%], Expensify [18.37%], Badger Meter[16.72%], ContextLogic [15%], Cullinan Oncology[13.89%] Best Smallcap Stocks Daily:
23andMe Holding[65.91%], Vertex Energy[33.78%], Zura Bio[17.20%], Badger Meter[16.65%], ContextLogic [15.81%], Expensify [15.23%], Montrose Environmental[12.84%], Vaxxinity [10.05%], Cipher Mining[8.65%], FiscalNote [8.61%], Vuzix [8.15%]