
 Login Sign Up


| |||||
 |  | ||||

| 12Stocks.com Market Intelligence |
Best SmallCap Stocks
|
| In a hurry? Small Cap Stock Lists: Performance Trends Table, Stock Charts
Sort Small Cap stocks: Daily, Weekly, Year-to-Date, Market Cap & Trends. Filter Small Cap stocks list by sector: Show all, Tech, Finance, Energy, Staples, Retail, Industrial, Materials, Utilities and HealthCare Filter Small Cap stocks list by size: All Large Medium Small and MicroCap |
| 12Stocks.com Small Cap Stocks Performances & Trends Daily | |||||||||
|
|  The overall Smart Investing & Trading Score is 88 (0-bearish to 100-bullish) which puts Small Cap index in short term bullish trend. The Smart Investing & Trading Score from previous trading session is 56 and hence an improvement of trend.
| ||||||||
Here are the Smart Investing & Trading Scores of the most requested small cap stocks at 12Stocks.com (click stock name for detailed review):
|


| 12Stocks.com: Investing in Smallcap Index with Stocks | |
|
The following table helps investors and traders sort through current performance and trends (as measured by Smart Investing & Trading Score) of various
stocks in the Smallcap Index. Quick View: Move mouse or cursor over stock symbol (ticker) to view short-term technical chart and over stock name to view long term chart. Click on  to add stock symbol to your watchlist and to add stock symbol to your watchlist and  to view watchlist. Click on any ticker or stock name for detailed market intelligence report for that stock. to view watchlist. Click on any ticker or stock name for detailed market intelligence report for that stock. |
12Stocks.com Performance of Stocks in Smallcap Index
| Ticker | Stock Name | Watchlist | Category | Recent Price | Smart Investing & Trading Score | Change % | YTD Change% |
| VALU | Value Line |   | Services & Goods | 36.70 | 10 | 0.98% | -24.71% |
| EGAN | eGain | | Technology | 6.27 | 49 | 0.32% | -24.73% |
| SMRT | SmartRent | | Technology | 2.40 | 42 | 1.69% | -24.76% |
| BE | Bloom Energy | | Utilities | 11.14 | 74 | 5.05% | -24.76% |
| MATW | Matthews | | Services & Goods | 27.55 | 64 | 1.47% | -24.83% |
| EVRI | Everi | | Services & Goods | 8.47 | 45 | 1.07% | -24.84% |
| IBTX | Independent Bank | | Financials | 38.22 | 10 | -2.85% | -24.88% |
| ZNTL | Zentalis | | Health Care | 11.38 | 27 | 2.89% | -24.93% |
| TRDA | Entrada | | Health Care | 12.31 | 10 | -1.12% | -24.98% |
| CYTK | Cytokinetics | | Health Care | 62.53 | 10 | -4.29% | -25.10% |
| BYND | Beyond Meat | | Consumer Staples | 6.66 | 95 | 4.06% | -25.17% |
| OABI | OmniAb | | Health Care | 4.53 | 17 | 1.34% | -25.25% |
| PWSC | PowerSchool | | Technology | 17.67 | 42 | 0.57% | -25.25% |
| COOK | Traeger | | Services & Goods | 2.11 | 10 | -0.47% | -25.31% |
| GMRE | Global Medical | | Industrials | 8.29 | 49 | 2.22% | -25.32% |
| GDYN | Grid Dynamics | | Technology | 9.95 | 20 | 0.20% | -25.36% |
| SITM | SiTime | | Technology | 91.06 | 74 | 2.56% | -25.41% |
| CFFN | Capitol Federal | | Financials | 4.81 | 0 | 0.00% | -25.43% |
| ARRY | Array | | Technology | 12.52 | 90 | 0.97% | -25.48% |
| XERS | Xeris | | Health Care | 1.75 | 27 | 0.29% | -25.48% |
| ZIP | ZipRecruiter | | Industrials | 10.44 | 15 | 0.77% | -25.51% |
| IGT | Game | | Services & Goods | 20.40 | 57 | 0.49% | -25.57% |
| BCBP | BCB Bancorp | | Financials | 9.56 | 27 | 1.06% | -25.60% |
| TMP | Tompkins Financial | | Financials | 44.80 | 53 | -3.30% | -25.62% |
| MMI | Marcus & Millichap | | Financials | 32.44 | 49 | 0.53% | -25.73% |


| Too many stocks? View smallcap stocks filtered by marketcap & sector |
| Marketcap: All SmallCap Stocks (default-no microcap), Large, Mid-Range, Small |
| Smallcap Sector: Tech, Finance, Energy, Staples, Retail, Industrial, Materials, & Medical |
|
Get the most comprehensive stock market coverage daily at 12Stocks.com ➞ Best Stocks Today ➞ Best Stocks Weekly ➞ Best Stocks Year-to-Date ➞ Best Stocks Trends ➞  Best Stocks Today 12Stocks.com Best Nasdaq Stocks ➞ Best S&P 500 Stocks ➞ Best Tech Stocks ➞ Best Biotech Stocks ➞ |
| Detailed Overview of SmallCap Stocks |
| SmallCap Technical Overview, Leaders & Laggards, Top SmallCap ETF Funds & Detailed SmallCap Stocks List, Charts, Trends & More |
| Smallcap: Technical Analysis, Trends & YTD Performance | |
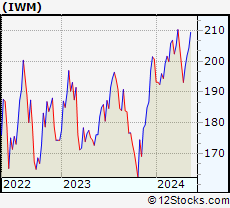
| SmallCap segment as represented by
IWM, an exchange-traded fund [ETF], holds basket of thousands of smallcap stocks from across all major sectors of the US stock market. The smallcap index (contains stocks like Riverbed & Sotheby's) is down by -0.37% and is currently underperforming the overall market by -6.93% year-to-date. Below is a quick view of technical charts and trends: | |
 IWM Weekly Chart |
|
| Long Term Trend: Very Good | |
| Medium Term Trend: Good | |
 IWM Daily Chart |
|
| Short Term Trend: Very Good | |
| Overall Trend Score: 88 | |
| YTD Performance: -0.37% | |
| **Trend Scores & Views Are Only For Educational Purposes And Not For Investing | |
| 12Stocks.com: Top Performing Small Cap Index Stocks | ||||||||||||||||||||||||||||||||||||||||||||||||
 The top performing Small Cap Index stocks year to date are
Now, more recently, over last week, the top performing Small Cap Index stocks on the move are


|
||||||||||||||||||||||||||||||||||||||||||||||||
| 12Stocks.com: Investing in Smallcap Index using Exchange Traded Funds | |
|
The following table shows list of key exchange traded funds (ETF) that
help investors track Smallcap index. The following list also includes leveraged ETF funds that track twice or thrice the daily returns of Smallcap indices. Short or inverse ETF funds move in the opposite direction to the index they track and are useful during market pullbacks or during bear markets. Quick View: Move mouse or cursor over ETF symbol (ticker) to view short-term technical chart and over ETF name to view long term chart. Click on ticker or stock name for detailed view. Click on to add stock symbol to your watchlist and to view watchlist. |
12Stocks.com List of ETFs that track Smallcap Index
| Ticker | ETF Name | Watchlist | Recent Price | Smart Investing & Trading Score | Change % | Week % | Year-to-date % |
| IWM | iShares Russell 2000 | | 199.96 | 88 | 0.79 | 0.79 | -0.37% |
| IJR | iShares Core S&P Small-Cap | | 106.41 | 93 | 0.72 | 0.72 | -1.7% |
| VTWO | Vanguard Russell 2000 ETF | | 80.78 | 88 | 0.70 | 0.7 | -0.39% |
| IWN | iShares Russell 2000 Value | | 152.05 | 93 | 0.60 | 0.6 | -2.11% |
| IWO | iShares Russell 2000 Growth | | 255.74 | 78 | 1.05 | 1.05 | 1.4% |
| IJS | iShares S&P Small-Cap 600 Value | | 97.95 | 70 | 0.78 | 0.78 | -4.97% |
| IJT | iShares S&P Small-Cap 600 Growth | | 126.96 | 88 | 0.69 | 0.69 | 1.45% |
| XSLV | PowerShares S&P SmallCap Low Volatil ETF | | 42.87 | 80 | 0.35 | 0.35 | -2.9% |
| SMLV | SPDR SSGA US Small Cap Low Volatil ETF | | 107.77 | 68 | 0.23 | 0.23 | -4.22% |
| SAA | ProShares Ultra SmallCap600 | | 23.27 | 88 | 1.00 | 1 | -6.73% |
| SBB | ProShares Short SmallCap600 | | 16.28 | 8 | -0.64 | -0.64 | 2.2% |
| SDD | ProShares UltraShort SmallCap600 | | 19.09 | 15 | -1.34 | -1.34 | 3.6% |
| 12Stocks.com: Charts, Trends, Fundamental Data and Performances of SmallCap Stocks | |
|
We now take in-depth look at all SmallCap stocks including charts, multi-period performances and overall trends (as measured by Smart Investing & Trading Score). One can sort SmallCap stocks (click link to choose) by Daily, Weekly and by Year-to-Date performances. Also, one can sort by size of the company or by market capitalization. |
| Select Your Default Chart Type: | |||||
| |||||
| Click on stock symbol or name for detailed view. Click on to add stock symbol to your watchlist and to view watchlist. Quick View: Move mouse or cursor over "Daily" to quickly view daily technical stock chart and over "Weekly" to view weekly technical stock chart. | |||||

 | VALU Value Line, Inc. |
| Sector: Services & Goods | |
| SubSector: Publishing - Periodicals | |
| MarketCap: 254.3 Millions | |
| Recent Price: 36.70 Smart Investing & Trading Score: 10 | |
| Day Percent Change: 0.98% Day Change: 0.35 | |
| Week Change: 0.98% Year-to-date Change: -24.7% | |
| VALU Links: Profile News Message Board | |
| Charts:- Daily , Weekly | |
| Add VALU to Watchlist: View: Get Complete VALU Trend Analysis ➞ | |
 | EGAN eGain Corporation |
| Sector: Technology | |
| SubSector: Business Software & Services | |
| MarketCap: 201.458 Millions | |
| Recent Price: 6.27 Smart Investing & Trading Score: 49 | |
| Day Percent Change: 0.32% Day Change: 0.02 | |
| Week Change: 0.32% Year-to-date Change: -24.7% | |
| EGAN Links: Profile News Message Board | |
| Charts:- Daily , Weekly | |
| Add EGAN to Watchlist: View: Get Complete EGAN Trend Analysis ➞ | |
 | SMRT SmartRent, Inc. |
| Sector: Technology | |
| SubSector: Software - Application | |
| MarketCap: 733 Millions | |
| Recent Price: 2.40 Smart Investing & Trading Score: 42 | |
| Day Percent Change: 1.69% Day Change: 0.04 | |
| Week Change: 1.69% Year-to-date Change: -24.8% | |
| SMRT Links: Profile News Message Board | |
| Charts:- Daily , Weekly | |
| Add SMRT to Watchlist: View: Get Complete SMRT Trend Analysis ➞ | |
 | BE Bloom Energy Corporation |
| Sector: Utilities | |
| SubSector: Electric Utilities | |
| MarketCap: 567.514 Millions | |
| Recent Price: 11.14 Smart Investing & Trading Score: 74 | |
| Day Percent Change: 5.05% Day Change: 0.54 | |
| Week Change: 5.05% Year-to-date Change: -24.8% | |
| BE Links: Profile News Message Board | |
| Charts:- Daily , Weekly | |
| Add BE to Watchlist: View: Get Complete BE Trend Analysis ➞ | |
 | MATW Matthews International Corporation |
| Sector: Services & Goods | |
| SubSector: Personal Services | |
| MarketCap: 803.325 Millions | |
| Recent Price: 27.55 Smart Investing & Trading Score: 64 | |
| Day Percent Change: 1.47% Day Change: 0.40 | |
| Week Change: 1.47% Year-to-date Change: -24.8% | |
| MATW Links: Profile News Message Board | |
| Charts:- Daily , Weekly | |
| Add MATW to Watchlist: View: Get Complete MATW Trend Analysis ➞ | |
 | EVRI Everi Holdings Inc. |
| Sector: Services & Goods | |
| SubSector: Gaming Activities | |
| MarketCap: 273.389 Millions | |
| Recent Price: 8.47 Smart Investing & Trading Score: 45 | |
| Day Percent Change: 1.07% Day Change: 0.09 | |
| Week Change: 1.07% Year-to-date Change: -24.8% | |
| EVRI Links: Profile News Message Board | |
| Charts:- Daily , Weekly | |
| Add EVRI to Watchlist: View: Get Complete EVRI Trend Analysis ➞ | |
 | IBTX Independent Bank Group, Inc. |
| Sector: Financials | |
| SubSector: Regional - Southeast Banks | |
| MarketCap: 1133.35 Millions | |
| Recent Price: 38.22 Smart Investing & Trading Score: 10 | |
| Day Percent Change: -2.85% Day Change: -1.12 | |
| Week Change: -2.85% Year-to-date Change: -24.9% | |
| IBTX Links: Profile News Message Board | |
| Charts:- Daily , Weekly | |
| Add IBTX to Watchlist: View: Get Complete IBTX Trend Analysis ➞ | |
 | ZNTL Zentalis Pharmaceuticals, Inc. |
| Sector: Health Care | |
| SubSector: Biotechnology | |
| MarketCap: 22187 Millions | |
| Recent Price: 11.38 Smart Investing & Trading Score: 27 | |
| Day Percent Change: 2.89% Day Change: 0.32 | |
| Week Change: 2.89% Year-to-date Change: -24.9% | |
| ZNTL Links: Profile News Message Board | |
| Charts:- Daily , Weekly | |
| Add ZNTL to Watchlist: View: Get Complete ZNTL Trend Analysis ➞ | |
 | TRDA Entrada Therapeutics, Inc. |
| Sector: Health Care | |
| SubSector: Biotechnology | |
| MarketCap: 481 Millions | |
| Recent Price: 12.31 Smart Investing & Trading Score: 10 | |
| Day Percent Change: -1.12% Day Change: -0.14 | |
| Week Change: -1.12% Year-to-date Change: -25.0% | |
| TRDA Links: Profile News Message Board | |
| Charts:- Daily , Weekly | |
| Add TRDA to Watchlist: View: Get Complete TRDA Trend Analysis ➞ | |
 | CYTK Cytokinetics, Incorporated |
| Sector: Health Care | |
| SubSector: Biotechnology | |
| MarketCap: 654.285 Millions | |
| Recent Price: 62.53 Smart Investing & Trading Score: 10 | |
| Day Percent Change: -4.29% Day Change: -2.81 | |
| Week Change: -4.29% Year-to-date Change: -25.1% | |
| CYTK Links: Profile News Message Board | |
| Charts:- Daily , Weekly | |
| Add CYTK to Watchlist: View: Get Complete CYTK Trend Analysis ➞ | |
 | BYND Beyond Meat, Inc. |
| Sector: Consumer Staples | |
| SubSector: Processed & Packaged Goods | |
| MarketCap: 3987.98 Millions | |
| Recent Price: 6.66 Smart Investing & Trading Score: 95 | |
| Day Percent Change: 4.06% Day Change: 0.26 | |
| Week Change: 4.06% Year-to-date Change: -25.2% | |
| BYND Links: Profile News Message Board | |
| Charts:- Daily , Weekly | |
| Add BYND to Watchlist: View: Get Complete BYND Trend Analysis ➞ | |
 | OABI OmniAb, Inc. |
| Sector: Health Care | |
| SubSector: Biotechnology | |
| MarketCap: 570 Millions | |
| Recent Price: 4.53 Smart Investing & Trading Score: 17 | |
| Day Percent Change: 1.34% Day Change: 0.06 | |
| Week Change: 1.34% Year-to-date Change: -25.3% | |
| OABI Links: Profile News Message Board | |
| Charts:- Daily , Weekly | |
| Add OABI to Watchlist: View: Get Complete OABI Trend Analysis ➞ | |
 | PWSC PowerSchool Holdings, Inc. |
| Sector: Technology | |
| SubSector: Software - Application | |
| MarketCap: 3870 Millions | |
| Recent Price: 17.67 Smart Investing & Trading Score: 42 | |
| Day Percent Change: 0.57% Day Change: 0.10 | |
| Week Change: 0.57% Year-to-date Change: -25.3% | |
| PWSC Links: Profile News Message Board | |
| Charts:- Daily , Weekly | |
| Add PWSC to Watchlist: View: Get Complete PWSC Trend Analysis ➞ | |
 | COOK Traeger, Inc. |
| Sector: Services & Goods | |
| SubSector: Furnishings, Fixtures & Appliances | |
| MarketCap: 524 Millions | |
| Recent Price: 2.11 Smart Investing & Trading Score: 10 | |
| Day Percent Change: -0.47% Day Change: -0.01 | |
| Week Change: -0.47% Year-to-date Change: -25.3% | |
| COOK Links: Profile News Message Board | |
| Charts:- Daily , Weekly | |
| Add COOK to Watchlist: View: Get Complete COOK Trend Analysis ➞ | |
 | GMRE Global Medical REIT Inc. |
| Sector: Industrials | |
| SubSector: Conglomerates | |
| MarketCap: 529.748 Millions | |
| Recent Price: 8.29 Smart Investing & Trading Score: 49 | |
| Day Percent Change: 2.22% Day Change: 0.18 | |
| Week Change: 2.22% Year-to-date Change: -25.3% | |
| GMRE Links: Profile News Message Board | |
| Charts:- Daily , Weekly | |
| Add GMRE to Watchlist: View: Get Complete GMRE Trend Analysis ➞ | |
 | GDYN Grid Dynamics Holdings, Inc. |
| Sector: Technology | |
| SubSector: Information Technology Services | |
| MarketCap: 318.968 Millions | |
| Recent Price: 9.95 Smart Investing & Trading Score: 20 | |
| Day Percent Change: 0.20% Day Change: 0.02 | |
| Week Change: 0.2% Year-to-date Change: -25.4% | |
| GDYN Links: Profile News Message Board | |
| Charts:- Daily , Weekly | |
| Add GDYN to Watchlist: View: Get Complete GDYN Trend Analysis ➞ | |
 | SITM SiTime Corporation |
| Sector: Technology | |
| SubSector: Semiconductor - Specialized | |
| MarketCap: 403.76 Millions | |
| Recent Price: 91.06 Smart Investing & Trading Score: 74 | |
| Day Percent Change: 2.56% Day Change: 2.27 | |
| Week Change: 2.56% Year-to-date Change: -25.4% | |
| SITM Links: Profile News Message Board | |
| Charts:- Daily , Weekly | |
| Add SITM to Watchlist: View: Get Complete SITM Trend Analysis ➞ | |
 | CFFN Capitol Federal Financial, Inc. |
| Sector: Financials | |
| SubSector: Savings & Loans | |
| MarketCap: 1639.1 Millions | |
| Recent Price: 4.81 Smart Investing & Trading Score: 0 | |
| Day Percent Change: 0.00% Day Change: 0.00 | |
| Week Change: 0% Year-to-date Change: -25.4% | |
| CFFN Links: Profile News Message Board | |
| Charts:- Daily , Weekly | |
| Add CFFN to Watchlist: View: Get Complete CFFN Trend Analysis ➞ | |
 | ARRY Array Technologies, Inc. |
| Sector: Technology | |
| SubSector: Solar | |
| MarketCap: 45887 Millions | |
| Recent Price: 12.52 Smart Investing & Trading Score: 90 | |
| Day Percent Change: 0.97% Day Change: 0.12 | |
| Week Change: 0.97% Year-to-date Change: -25.5% | |
| ARRY Links: Profile News Message Board | |
| Charts:- Daily , Weekly | |
| Add ARRY to Watchlist: View: Get Complete ARRY Trend Analysis ➞ | |
 | XERS Xeris Pharmaceuticals, Inc. |
| Sector: Health Care | |
| SubSector: Biotechnology | |
| MarketCap: 74.5785 Millions | |
| Recent Price: 1.75 Smart Investing & Trading Score: 27 | |
| Day Percent Change: 0.29% Day Change: 0.00 | |
| Week Change: 0.29% Year-to-date Change: -25.5% | |
| XERS Links: Profile News Message Board | |
| Charts:- Daily , Weekly | |
| Add XERS to Watchlist: View: Get Complete XERS Trend Analysis ➞ | |
 | ZIP ZipRecruiter, Inc. |
| Sector: Industrials | |
| SubSector: Staffing & Employment Services | |
| MarketCap: 1730 Millions | |
| Recent Price: 10.44 Smart Investing & Trading Score: 15 | |
| Day Percent Change: 0.77% Day Change: 0.08 | |
| Week Change: 0.77% Year-to-date Change: -25.5% | |
| ZIP Links: Profile News Message Board | |
| Charts:- Daily , Weekly | |
| Add ZIP to Watchlist: View: Get Complete ZIP Trend Analysis ➞ | |
 | IGT International Game Technology PLC |
| Sector: Services & Goods | |
| SubSector: Gaming Activities | |
| MarketCap: 1030.89 Millions | |
| Recent Price: 20.40 Smart Investing & Trading Score: 57 | |
| Day Percent Change: 0.49% Day Change: 0.10 | |
| Week Change: 0.49% Year-to-date Change: -25.6% | |
| IGT Links: Profile News Message Board | |
| Charts:- Daily , Weekly | |
| Add IGT to Watchlist: View: Get Complete IGT Trend Analysis ➞ | |
 | BCBP BCB Bancorp, Inc. |
| Sector: Financials | |
| SubSector: Regional - Northeast Banks | |
| MarketCap: 196.799 Millions | |
| Recent Price: 9.56 Smart Investing & Trading Score: 27 | |
| Day Percent Change: 1.06% Day Change: 0.10 | |
| Week Change: 1.06% Year-to-date Change: -25.6% | |
| BCBP Links: Profile News Message Board | |
| Charts:- Daily , Weekly | |
| Add BCBP to Watchlist: View: Get Complete BCBP Trend Analysis ➞ | |
 | TMP Tompkins Financial Corporation |
| Sector: Financials | |
| SubSector: Regional - Northeast Banks | |
| MarketCap: 1144.79 Millions | |
| Recent Price: 44.80 Smart Investing & Trading Score: 53 | |
| Day Percent Change: -3.30% Day Change: -1.53 | |
| Week Change: -3.3% Year-to-date Change: -25.6% | |
| TMP Links: Profile News Message Board | |
| Charts:- Daily , Weekly | |
| Add TMP to Watchlist: View: Get Complete TMP Trend Analysis ➞ | |
 | MMI Marcus & Millichap, Inc. |
| Sector: Financials | |
| SubSector: Real Estate Development | |
| MarketCap: 1005.19 Millions | |
| Recent Price: 32.44 Smart Investing & Trading Score: 49 | |
| Day Percent Change: 0.53% Day Change: 0.17 | |
| Week Change: 0.53% Year-to-date Change: -25.7% | |
| MMI Links: Profile News Message Board | |
| Charts:- Daily , Weekly | |
| Add MMI to Watchlist: View: Get Complete MMI Trend Analysis ➞ | |
| Too many stocks? View smallcap stocks filtered by marketcap & sector |
| Marketcap: All SmallCap Stocks (default-no microcap), Large, Mid-Range, Small & MicroCap |
| Sector: Tech, Finance, Energy, Staples, Retail, Industrial, Materials, Utilities & Medical |
|
Best Stocks Today 12Stocks.com |
© 2024 12Stocks.com Terms & Conditions Privacy Contact Us
All Information Provided Only For Education And Not To Be Used For Investing or Trading. See Terms & Conditions


One More Thing ... Get Best Stocks Delivered Daily!
Never Ever Miss A Move With Our Top Ten Stocks Lists
Find Best Stocks In Any Market - Bull or Bear Market
Take A Peek At Our Top Ten Stocks Lists: Daily, Weekly, Year-to-Date & Top Trends
Find Best Stocks In Any Market - Bull or Bear Market
Take A Peek At Our Top Ten Stocks Lists: Daily, Weekly, Year-to-Date & Top Trends
Smallcap Stocks With Best Up Trends [0-bearish to 100-bullish]: Bakkt [100], Deciphera [100], Phibro Animal[100], Heartland Financial[100], PTC [100], Sight Sciences[100], Richardson Electronics[100], Fulton Financial[100], Cullinan Oncology[100], TPI Composites[100], Lands [100]
Best Smallcap Stocks Year-to-Date:
CareMax [572.16%], Janux [422.57%], Bakkt [346.64%], Viking [305.75%], Longboard [248.45%], Alpine Immune[239.81%], Super Micro[213.31%], Avidity Biosciences[173.17%], Arcutis Bio[170.43%], Vera [167.34%], Cullinan Oncology[166.41%] Best Smallcap Stocks This Week:
Deciphera [71.95%], Vaxxinity [35.33%], Phibro Animal[31.89%], Zevia PBC[20.94%], Velo3D [19.97%], Janux [18.32%], Acrivon [18.09%], MultiPlan [15.53%], Heartland Financial[15.24%], Codexis [14.29%], Eyenovia [13.66%] Best Smallcap Stocks Daily:
Bakkt [2391.87%], Deciphera [71.95%], Vaxxinity [35.33%], Phibro Animal[31.89%], Zevia PBC[20.94%], Velo3D [19.97%], Janux [18.32%], Acrivon [18.09%], MultiPlan [15.53%], Heartland Financial[15.24%], Codexis [14.29%]