
 Login Sign Up


| |||||
 |  | ||||

| 12Stocks.com Market Intelligence |
Best SmallCap Stocks
|
| In a hurry? Small Cap Stock Lists: Performance Trends Table, Stock Charts
Sort Small Cap stocks: Daily, Weekly, Year-to-Date, Market Cap & Trends. Filter Small Cap stocks list by sector: Show all, Tech, Finance, Energy, Staples, Retail, Industrial, Materials, Utilities and HealthCare Filter Small Cap stocks list by size: All Large Medium Small and MicroCap |
| 12Stocks.com Small Cap Stocks Performances & Trends Daily | |||||||||
|
|  The overall Smart Investing & Trading Score is 41 (0-bearish to 100-bullish) which puts Small Cap index in short term neutral trend. The Smart Investing & Trading Score from previous trading session is 88 and hence a deterioration of trend.
| ||||||||
Here are the Smart Investing & Trading Scores of the most requested small cap stocks at 12Stocks.com (click stock name for detailed review):
|


| 12Stocks.com: Investing in Smallcap Index with Stocks | |
|
The following table helps investors and traders sort through current performance and trends (as measured by Smart Investing & Trading Score) of various
stocks in the Smallcap Index. Quick View: Move mouse or cursor over stock symbol (ticker) to view short-term technical chart and over stock name to view long term chart. Click on  to add stock symbol to your watchlist and to add stock symbol to your watchlist and  to view watchlist. Click on any ticker or stock name for detailed market intelligence report for that stock. to view watchlist. Click on any ticker or stock name for detailed market intelligence report for that stock. |
12Stocks.com Performance of Stocks in Smallcap Index
| Ticker | Stock Name | Watchlist | Category | Recent Price | Smart Investing & Trading Score | Change % | YTD Change% |
| KIND | Nextdoor |   | Services & Goods | 2.04 | 46 | 0.00% | 10.27% |
| PSFE | Paysafe | | Technology | 14.22 | 35 | -2.94% | 10.23% |
| SLQT | SelectQuote | | Financials | 1.51 | 31 | -7.93% | 10.22% |
| MODN | Model N | | Technology | 29.65 | 49 | -0.03% | 10.10% |
| MWA | Mueller Water | | Industrials | 15.84 | 71 | -1.98% | 10.00% |
| UFCS | United Fire | | Financials | 22.09 | 25 | -0.14% | 9.79% |
| MTSI | MACOM | | Technology | 101.95 | 100 | -1.97% | 9.68% |
| MTDR | Matador Resources | | Energy | 62.30 | 61 | -5.82% | 9.57% |
| TPB | Turning Point | | Consumer Staples | 28.84 | 90 | 1.51% | 9.57% |
| ATKR | Atkore | | Industrials | 175.30 | 83 | -4.29% | 9.56% |
| PTGX | Protagonist | | Health Care | 25.11 | 44 | -1.76% | 9.51% |
| ENVA | Enova | | Financials | 60.53 | 58 | -1.94% | 9.34% |
| WHD | Cactus | | Energy | 49.64 | 74 | -5.41% | 9.34% |
| RBBN | Ribbon | | Technology | 3.17 | 71 | 0.32% | 9.31% |
| BHE | Benchmark Electronics | | Technology | 30.21 | 93 | -4.06% | 9.30% |
| CBT | Cabot | | Materials | 91.23 | 36 | -2.38% | 9.26% |
| GRND | Grindr | | Technology | 9.79 | 61 | -1.31% | 9.26% |
| BHR | Braemar Hotels | | Financials | 2.73 | 76 | -1.80% | 9.20% |
| URBN | Urban Outfitters | | Services & Goods | 38.96 | 48 | -2.87% | 9.16% |
| SXI | Standex | | Industrials | 172.88 | 85 | -1.91% | 9.16% |
| GVA | Granite Construction | | Industrials | 55.50 | 76 | -0.39% | 9.12% |
| USPH | U.S. Physical | | Health Care | 101.51 | 61 | -0.46% | 8.99% |
| KRT | Karat Packaging | | Services & Goods | 27.10 | 58 | -1.24% | 8.79% |
| STER | Sterling Check | | Technology | 15.14 | 71 | -1.94% | 8.69% |
| NX | Quanex Building | | Industrials | 33.22 | 44 | -1.77% | 8.67% |


| Too many stocks? View smallcap stocks filtered by marketcap & sector |
| Marketcap: All SmallCap Stocks (default-no microcap), Large, Mid-Range, Small |
| Smallcap Sector: Tech, Finance, Energy, Staples, Retail, Industrial, Materials, & Medical |
|
Get the most comprehensive stock market coverage daily at 12Stocks.com ➞ Best Stocks Today ➞ Best Stocks Weekly ➞ Best Stocks Year-to-Date ➞ Best Stocks Trends ➞  Best Stocks Today 12Stocks.com Best Nasdaq Stocks ➞ Best S&P 500 Stocks ➞ Best Tech Stocks ➞ Best Biotech Stocks ➞ |
| Detailed Overview of SmallCap Stocks |
| SmallCap Technical Overview, Leaders & Laggards, Top SmallCap ETF Funds & Detailed SmallCap Stocks List, Charts, Trends & More |
| Smallcap: Technical Analysis, Trends & YTD Performance | |
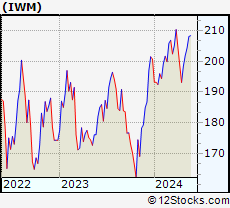
| SmallCap segment as represented by
IWM, an exchange-traded fund [ETF], holds basket of thousands of smallcap stocks from across all major sectors of the US stock market. The smallcap index (contains stocks like Riverbed & Sotheby's) is down by -2.4% and is currently underperforming the overall market by -7.2% year-to-date. Below is a quick view of technical charts and trends: | |
 IWM Weekly Chart |
|
| Long Term Trend: Good | |
| Medium Term Trend: Not Good | |
 IWM Daily Chart |
|
| Short Term Trend: Not Good | |
| Overall Trend Score: 41 | |
| YTD Performance: -2.4% | |
| **Trend Scores & Views Are Only For Educational Purposes And Not For Investing | |
| 12Stocks.com: Top Performing Small Cap Index Stocks | ||||||||||||||||||||||||||||||||||||||||||||||||
 The top performing Small Cap Index stocks year to date are
Now, more recently, over last week, the top performing Small Cap Index stocks on the move are


|
||||||||||||||||||||||||||||||||||||||||||||||||
| 12Stocks.com: Investing in Smallcap Index using Exchange Traded Funds | |
|
The following table shows list of key exchange traded funds (ETF) that
help investors track Smallcap index. The following list also includes leveraged ETF funds that track twice or thrice the daily returns of Smallcap indices. Short or inverse ETF funds move in the opposite direction to the index they track and are useful during market pullbacks or during bear markets. Quick View: Move mouse or cursor over ETF symbol (ticker) to view short-term technical chart and over ETF name to view long term chart. Click on ticker or stock name for detailed view. Click on to add stock symbol to your watchlist and to view watchlist. |
12Stocks.com List of ETFs that track Smallcap Index
| Ticker | ETF Name | Watchlist | Recent Price | Smart Investing & Trading Score | Change % | Week % | Year-to-date % |
| IWM | iShares Russell 2000 | | 195.90 | 41 | -2.03 | -1.26 | -2.4% |
| IJR | iShares Core S&P Small-Cap | | 104.39 | 86 | -1.90 | -1.19 | -3.57% |
| VTWO | Vanguard Russell 2000 ETF | | 79.16 | 81 | -2.01 | -1.32 | -2.39% |
| IWN | iShares Russell 2000 Value | | 149.04 | 86 | -1.98 | -1.39 | -4.05% |
| IWO | iShares Russell 2000 Growth | | 250.32 | 81 | -2.12 | -1.09 | -0.75% |
| IJS | iShares S&P Small-Cap 600 Value | | 96.08 | 68 | -1.91 | -1.14 | -6.78% |
| IJT | iShares S&P Small-Cap 600 Growth | | 124.60 | 88 | -1.86 | -1.18 | -0.43% |
| XSLV | PowerShares S&P SmallCap Low Volatil ETF | | 42.54 | 73 | -0.77 | -0.42 | -3.65% |
| SMLV | SPDR SSGA US Small Cap Low Volatil ETF | | 106.26 | 61 | -1.40 | -1.17 | -5.56% |
| SDD | ProShares UltraShort SmallCap600 | | 19.57 | 17 | 2.51 | 1.14 | 6.21% |
| SAA | ProShares Ultra SmallCap600 | | 22.60 | 81 | -2.88 | -1.91 | -9.42% |
| SBB | ProShares Short SmallCap600 | | 16.55 | 15 | 1.66 | 1.01 | 3.89% |
| 12Stocks.com: Charts, Trends, Fundamental Data and Performances of SmallCap Stocks | |
|
We now take in-depth look at all SmallCap stocks including charts, multi-period performances and overall trends (as measured by Smart Investing & Trading Score). One can sort SmallCap stocks (click link to choose) by Daily, Weekly and by Year-to-Date performances. Also, one can sort by size of the company or by market capitalization. |
| Select Your Default Chart Type: | |||||
| |||||
| Click on stock symbol or name for detailed view. Click on to add stock symbol to your watchlist and to view watchlist. Quick View: Move mouse or cursor over "Daily" to quickly view daily technical stock chart and over "Weekly" to view weekly technical stock chart. | |||||

 | KIND Nextdoor Holdings, Inc. |
| Sector: Services & Goods | |
| SubSector: Internet Content & Information | |
| MarketCap: 1170 Millions | |
| Recent Price: 2.04 Smart Investing & Trading Score: 46 | |
| Day Percent Change: 0.00% Day Change: 0.00 | |
| Week Change: 0.99% Year-to-date Change: 10.3% | |
| KIND Links: Profile News Message Board | |
| Charts:- Daily , Weekly | |
| Add KIND to Watchlist: View: Get Complete KIND Trend Analysis ➞ | |
 | PSFE Paysafe Limited |
| Sector: Technology | |
| SubSector: Software - Infrastructure | |
| MarketCap: 605 Millions | |
| Recent Price: 14.22 Smart Investing & Trading Score: 35 | |
| Day Percent Change: -2.94% Day Change: -0.43 | |
| Week Change: -1.66% Year-to-date Change: 10.2% | |
| PSFE Links: Profile News Message Board | |
| Charts:- Daily , Weekly | |
| Add PSFE to Watchlist: View: Get Complete PSFE Trend Analysis ➞ | |
 | SLQT SelectQuote, Inc. |
| Sector: Financials | |
| SubSector: Insurance Brokers | |
| MarketCap: 38257 Millions | |
| Recent Price: 1.51 Smart Investing & Trading Score: 31 | |
| Day Percent Change: -7.93% Day Change: -0.13 | |
| Week Change: -6.21% Year-to-date Change: 10.2% | |
| SLQT Links: Profile News Message Board | |
| Charts:- Daily , Weekly | |
| Add SLQT to Watchlist: View: Get Complete SLQT Trend Analysis ➞ | |
 | MODN Model N, Inc. |
| Sector: Technology | |
| SubSector: Application Software | |
| MarketCap: 670.162 Millions | |
| Recent Price: 29.65 Smart Investing & Trading Score: 49 | |
| Day Percent Change: -0.03% Day Change: -0.01 | |
| Week Change: 0.03% Year-to-date Change: 10.1% | |
| MODN Links: Profile News Message Board | |
| Charts:- Daily , Weekly | |
| Add MODN to Watchlist: View: Get Complete MODN Trend Analysis ➞ | |
 | MWA Mueller Water Products, Inc. |
| Sector: Industrials | |
| SubSector: Industrial Equipment & Components | |
| MarketCap: 1321.09 Millions | |
| Recent Price: 15.84 Smart Investing & Trading Score: 71 | |
| Day Percent Change: -1.98% Day Change: -0.32 | |
| Week Change: -0.88% Year-to-date Change: 10.0% | |
| MWA Links: Profile News Message Board | |
| Charts:- Daily , Weekly | |
| Add MWA to Watchlist: View: Get Complete MWA Trend Analysis ➞ | |
 | UFCS United Fire Group, Inc. |
| Sector: Financials | |
| SubSector: Property & Casualty Insurance | |
| MarketCap: 862.812 Millions | |
| Recent Price: 22.09 Smart Investing & Trading Score: 25 | |
| Day Percent Change: -0.14% Day Change: -0.03 | |
| Week Change: -0.63% Year-to-date Change: 9.8% | |
| UFCS Links: Profile News Message Board | |
| Charts:- Daily , Weekly | |
| Add UFCS to Watchlist: View: Get Complete UFCS Trend Analysis ➞ | |
 | MTSI MACOM Technology Solutions Holdings, Inc. |
| Sector: Technology | |
| SubSector: Semiconductor - Broad Line | |
| MarketCap: 1214.42 Millions | |
| Recent Price: 101.95 Smart Investing & Trading Score: 100 | |
| Day Percent Change: -1.97% Day Change: -2.05 | |
| Week Change: 0.24% Year-to-date Change: 9.7% | |
| MTSI Links: Profile News Message Board | |
| Charts:- Daily , Weekly | |
| Add MTSI to Watchlist: View: Get Complete MTSI Trend Analysis ➞ | |
 | MTDR Matador Resources Company |
| Sector: Energy | |
| SubSector: Independent Oil & Gas | |
| MarketCap: 196.593 Millions | |
| Recent Price: 62.30 Smart Investing & Trading Score: 61 | |
| Day Percent Change: -5.82% Day Change: -3.85 | |
| Week Change: -5.04% Year-to-date Change: 9.6% | |
| MTDR Links: Profile News Message Board | |
| Charts:- Daily , Weekly | |
| Add MTDR to Watchlist: View: Get Complete MTDR Trend Analysis ➞ | |
 | TPB Turning Point Brands, Inc. |
| Sector: Consumer Staples | |
| SubSector: Tobacco Products, Other | |
| MarketCap: 381.97 Millions | |
| Recent Price: 28.84 Smart Investing & Trading Score: 90 | |
| Day Percent Change: 1.51% Day Change: 0.43 | |
| Week Change: 2.12% Year-to-date Change: 9.6% | |
| TPB Links: Profile News Message Board | |
| Charts:- Daily , Weekly | |
| Add TPB to Watchlist: View: Get Complete TPB Trend Analysis ➞ | |
 | ATKR Atkore International Group Inc. |
| Sector: Industrials | |
| SubSector: Industrial Electrical Equipment | |
| MarketCap: 1086.79 Millions | |
| Recent Price: 175.30 Smart Investing & Trading Score: 83 | |
| Day Percent Change: -4.29% Day Change: -7.86 | |
| Week Change: -4.2% Year-to-date Change: 9.6% | |
| ATKR Links: Profile News Message Board | |
| Charts:- Daily , Weekly | |
| Add ATKR to Watchlist: View: Get Complete ATKR Trend Analysis ➞ | |
 | PTGX Protagonist Therapeutics, Inc. |
| Sector: Health Care | |
| SubSector: Biotechnology | |
| MarketCap: 165.285 Millions | |
| Recent Price: 25.11 Smart Investing & Trading Score: 44 | |
| Day Percent Change: -1.76% Day Change: -0.45 | |
| Week Change: -0.16% Year-to-date Change: 9.5% | |
| PTGX Links: Profile News Message Board | |
| Charts:- Daily , Weekly | |
| Add PTGX to Watchlist: View: Get Complete PTGX Trend Analysis ➞ | |
 | ENVA Enova International, Inc. |
| Sector: Financials | |
| SubSector: Credit Services | |
| MarketCap: 345.508 Millions | |
| Recent Price: 60.53 Smart Investing & Trading Score: 58 | |
| Day Percent Change: -1.94% Day Change: -1.20 | |
| Week Change: -4.27% Year-to-date Change: 9.3% | |
| ENVA Links: Profile News Message Board | |
| Charts:- Daily , Weekly | |
| Add ENVA to Watchlist: View: Get Complete ENVA Trend Analysis ➞ | |
 | WHD Cactus, Inc. |
| Sector: Energy | |
| SubSector: Oil & Gas Equipment & Services | |
| MarketCap: 920.261 Millions | |
| Recent Price: 49.64 Smart Investing & Trading Score: 74 | |
| Day Percent Change: -5.41% Day Change: -2.84 | |
| Week Change: -4.17% Year-to-date Change: 9.3% | |
| WHD Links: Profile News Message Board | |
| Charts:- Daily , Weekly | |
| Add WHD to Watchlist: View: Get Complete WHD Trend Analysis ➞ | |
 | RBBN Ribbon Communications Inc. |
| Sector: Technology | |
| SubSector: Telecom Services - Domestic | |
| MarketCap: 284.577 Millions | |
| Recent Price: 3.17 Smart Investing & Trading Score: 71 | |
| Day Percent Change: 0.32% Day Change: 0.01 | |
| Week Change: 1.28% Year-to-date Change: 9.3% | |
| RBBN Links: Profile News Message Board | |
| Charts:- Daily , Weekly | |
| Add RBBN to Watchlist: View: Get Complete RBBN Trend Analysis ➞ | |
 | BHE Benchmark Electronics, Inc. |
| Sector: Technology | |
| SubSector: Printed Circuit Boards | |
| MarketCap: 766.835 Millions | |
| Recent Price: 30.21 Smart Investing & Trading Score: 93 | |
| Day Percent Change: -4.06% Day Change: -1.28 | |
| Week Change: -3.67% Year-to-date Change: 9.3% | |
| BHE Links: Profile News Message Board | |
| Charts:- Daily , Weekly | |
| Add BHE to Watchlist: View: Get Complete BHE Trend Analysis ➞ | |
 | CBT Cabot Corporation |
| Sector: Materials | |
| SubSector: Specialty Chemicals | |
| MarketCap: 1261.47 Millions | |
| Recent Price: 91.23 Smart Investing & Trading Score: 36 | |
| Day Percent Change: -2.38% Day Change: -2.22 | |
| Week Change: -2.52% Year-to-date Change: 9.3% | |
| CBT Links: Profile News Message Board | |
| Charts:- Daily , Weekly | |
| Add CBT to Watchlist: View: Get Complete CBT Trend Analysis ➞ | |
 | GRND Grindr Inc. |
| Sector: Technology | |
| SubSector: Software - Application | |
| MarketCap: 929 Millions | |
| Recent Price: 9.79 Smart Investing & Trading Score: 61 | |
| Day Percent Change: -1.31% Day Change: -0.13 | |
| Week Change: -1.01% Year-to-date Change: 9.3% | |
| GRND Links: Profile News Message Board | |
| Charts:- Daily , Weekly | |
| Add GRND to Watchlist: View: Get Complete GRND Trend Analysis ➞ | |
 | BHR Braemar Hotels & Resorts, Inc. |
| Sector: Financials | |
| SubSector: REIT - Hotel/Motel | |
| MarketCap: 88.9434 Millions | |
| Recent Price: 2.73 Smart Investing & Trading Score: 76 | |
| Day Percent Change: -1.80% Day Change: -0.05 | |
| Week Change: -2.15% Year-to-date Change: 9.2% | |
| BHR Links: Profile News Message Board | |
| Charts:- Daily , Weekly | |
| Add BHR to Watchlist: View: Get Complete BHR Trend Analysis ➞ | |
 | URBN Urban Outfitters, Inc. |
| Sector: Services & Goods | |
| SubSector: Apparel Stores | |
| MarketCap: 1638.08 Millions | |
| Recent Price: 38.96 Smart Investing & Trading Score: 48 | |
| Day Percent Change: -2.87% Day Change: -1.15 | |
| Week Change: -3.87% Year-to-date Change: 9.2% | |
| URBN Links: Profile News Message Board | |
| Charts:- Daily , Weekly | |
| Add URBN to Watchlist: View: Get Complete URBN Trend Analysis ➞ | |
 | SXI Standex International Corporation |
| Sector: Industrials | |
| SubSector: Industrial Equipment & Components | |
| MarketCap: 644.109 Millions | |
| Recent Price: 172.88 Smart Investing & Trading Score: 85 | |
| Day Percent Change: -1.91% Day Change: -3.37 | |
| Week Change: 0.04% Year-to-date Change: 9.2% | |
| SXI Links: Profile News Message Board | |
| Charts:- Daily , Weekly | |
| Add SXI to Watchlist: View: Get Complete SXI Trend Analysis ➞ | |
 | GVA Granite Construction Incorporated |
| Sector: Industrials | |
| SubSector: Heavy Construction | |
| MarketCap: 725.895 Millions | |
| Recent Price: 55.50 Smart Investing & Trading Score: 76 | |
| Day Percent Change: -0.39% Day Change: -0.22 | |
| Week Change: -0.05% Year-to-date Change: 9.1% | |
| GVA Links: Profile News Message Board | |
| Charts:- Daily , Weekly | |
| Add GVA to Watchlist: View: Get Complete GVA Trend Analysis ➞ | |
 | USPH U.S. Physical Therapy, Inc. |
| Sector: Health Care | |
| SubSector: Specialized Health Services | |
| MarketCap: 793.556 Millions | |
| Recent Price: 101.51 Smart Investing & Trading Score: 61 | |
| Day Percent Change: -0.46% Day Change: -0.47 | |
| Week Change: 0.89% Year-to-date Change: 9.0% | |
| USPH Links: Profile News Message Board | |
| Charts:- Daily , Weekly | |
| Add USPH to Watchlist: View: Get Complete USPH Trend Analysis ➞ | |
 | KRT Karat Packaging Inc. |
| Sector: Services & Goods | |
| SubSector: Packaging & Containers | |
| MarketCap: 357 Millions | |
| Recent Price: 27.10 Smart Investing & Trading Score: 58 | |
| Day Percent Change: -1.24% Day Change: -0.34 | |
| Week Change: -0.77% Year-to-date Change: 8.8% | |
| KRT Links: Profile News Message Board | |
| Charts:- Daily , Weekly | |
| Add KRT to Watchlist: View: Get Complete KRT Trend Analysis ➞ | |
 | STER Sterling Check Corp. |
| Sector: Technology | |
| SubSector: Software - Infrastructure | |
| MarketCap: 1180 Millions | |
| Recent Price: 15.14 Smart Investing & Trading Score: 71 | |
| Day Percent Change: -1.94% Day Change: -0.30 | |
| Week Change: -1.11% Year-to-date Change: 8.7% | |
| STER Links: Profile News Message Board | |
| Charts:- Daily , Weekly | |
| Add STER to Watchlist: View: Get Complete STER Trend Analysis ➞ | |
 | NX Quanex Building Products Corporation |
| Sector: Industrials | |
| SubSector: General Building Materials | |
| MarketCap: 315.453 Millions | |
| Recent Price: 33.22 Smart Investing & Trading Score: 44 | |
| Day Percent Change: -1.77% Day Change: -0.60 | |
| Week Change: -1.75% Year-to-date Change: 8.7% | |
| NX Links: Profile News Message Board | |
| Charts:- Daily , Weekly | |
| Add NX to Watchlist: View: Get Complete NX Trend Analysis ➞ | |
| Too many stocks? View smallcap stocks filtered by marketcap & sector |
| Marketcap: All SmallCap Stocks (default-no microcap), Large, Mid-Range, Small & MicroCap |
| Sector: Tech, Finance, Energy, Staples, Retail, Industrial, Materials, Utilities & Medical |
|
Best Stocks Today 12Stocks.com |
© 2024 12Stocks.com Terms & Conditions Privacy Contact Us
All Information Provided Only For Education And Not To Be Used For Investing or Trading. See Terms & Conditions


One More Thing ... Get Best Stocks Delivered Daily!
Never Ever Miss A Move With Our Top Ten Stocks Lists
Find Best Stocks In Any Market - Bull or Bear Market
Take A Peek At Our Top Ten Stocks Lists: Daily, Weekly, Year-to-Date & Top Trends
Find Best Stocks In Any Market - Bull or Bear Market
Take A Peek At Our Top Ten Stocks Lists: Daily, Weekly, Year-to-Date & Top Trends
Smallcap Stocks With Best Up Trends [0-bearish to 100-bullish]: Allegheny [100], Brinker [100], Day One[100], Heartland Financial[100], Carpenter [100], LTC Properties[100], Semtech [100], California Water[100], Impinj [100], Sensient [100], Costamare [100]
Best Smallcap Stocks Year-to-Date:
Janux [431.32%], Viking [327.62%], Longboard [248.61%], Alpine Immune[239.23%], Super Micro[202.12%], Bakkt [200.9%], Avidity Biosciences[166.92%], Cullinan Oncology[164.93%], Arcutis Bio[157.59%], Vera [155.36%], Hippo [134.8%] Best Smallcap Stocks This Week:
Deciphera [72.49%], Cue Biopharma[39.19%], GrowGeneration [34.68%], Phibro Animal[31.19%], LendingTree [27.36%], Janux [20.3%], Seres [20.07%], Eyenovia [19.55%], P3 Health[18.22%], Heartland Financial[17.89%], Harmonic [16.74%] Best Smallcap Stocks Daily:
Cue Biopharma[33.80%], GrowGeneration [30.00%], LendingTree [29.24%], SES AI[17.04%], Allegheny [15.03%], AnaptysBio [14.27%], Harmonic [14.26%], LSB Industries[13.14%], P3 Health[12.09%], Clearwater Paper[10.69%], Seres [8.98%]