
 Login Sign Up


| |||||
 |  | ||||

| 12Stocks.com Market Intelligence |
Best SmallCap Stocks
|
| In a hurry? Small Cap Stock Lists: Performance Trends Table, Stock Charts
Sort Small Cap stocks: Daily, Weekly, Year-to-Date, Market Cap & Trends. Filter Small Cap stocks list by sector: Show all, Tech, Finance, Energy, Staples, Retail, Industrial, Materials, Utilities and HealthCare Filter Small Cap stocks list by size: All Large Medium Small and MicroCap |
| 12Stocks.com Small Cap Stocks Performances & Trends Daily | |||||||||
|
|  The overall Smart Investing & Trading Score is 87 (0-bearish to 100-bullish) which puts Small Cap index in short term bullish trend. The Smart Investing & Trading Score from previous trading session is 82 and hence an improvement of trend.
| ||||||||
Here are the Smart Investing & Trading Scores of the most requested small cap stocks at 12Stocks.com (click stock name for detailed review):
|


| 12Stocks.com: Investing in Smallcap Index with Stocks | |
|
The following table helps investors and traders sort through current performance and trends (as measured by Smart Investing & Trading Score) of various
stocks in the Smallcap Index. Quick View: Move mouse or cursor over stock symbol (ticker) to view short-term technical chart and over stock name to view long term chart. Click on  to add stock symbol to your watchlist and to add stock symbol to your watchlist and  to view watchlist. Click on any ticker or stock name for detailed market intelligence report for that stock. to view watchlist. Click on any ticker or stock name for detailed market intelligence report for that stock. |
12Stocks.com Performance of Stocks in Smallcap Index
| Ticker | Stock Name | Watchlist | Category | Recent Price | Smart Investing & Trading Score | Change % | YTD Change% |
| IBCP | Independent Bank |   | Financials | 25.29 | 95 | 0.14% | -2.82% |
| IDCC | InterDigital | | Technology | 105.46 | 64 | 0.15% | -2.84% |
| FEAM | 5E Advanced | | Materials | 1.37 | 74 | -5.52% | -2.84% |
| ESRT | Empire State | | Financials | 9.41 | 57 | 0.32% | -2.89% |
| NRDS | NerdWallet | | Financials | 14.49 | 69 | 1.15% | -2.98% |
| THRM | Gentherm | | Consumer Staples | 50.78 | 50 | -0.52% | -3.01% |
| KVHI | KVH Industries | | Technology | 5.10 | 65 | 2.00% | -3.04% |
| BHVN | Biohaven Pharmaceutical | | Health Care | 41.47 | 64 | 0.68% | -3.11% |
| PNRG | PrimeEnergy Resources | | Energy | 102.98 | 56 | 0.00% | -3.17% |
| CRC | California Resources | | Energy | 52.94 | 58 | 0.47% | -3.18% |
| INVA | Innoviva | | Health Care | 15.53 | 95 | 0.52% | -3.18% |
| BL | BlackLine | | Technology | 60.45 | 90 | -0.43% | -3.19% |
| BLFY | Blue Foundry | | Financials | 9.32 | 64 | 1.91% | -3.22% |
| YEXT | Yext | | Technology | 5.70 | 74 | 1.79% | -3.23% |
| SHOO | Steven Madden | | Consumer Staples | 40.64 | 57 | 0.37% | -3.24% |
| GEF | Greif | | Consumer Staples | 63.46 | 74 | 0.28% | -3.25% |
| SHO | Sunstone Hotel | | Financials | 10.38 | 64 | 0.19% | -3.26% |
| AXSM | Axsome | | Health Care | 76.97 | 32 | 1.36% | -3.29% |
| RHP | Ryman Hospitality | | Financials | 106.42 | 57 | 1.10% | -3.31% |
| IVAC | Intevac | | Technology | 4.17 | 63 | -0.83% | -3.36% |
| JOE | St. Joe | | Financials | 58.09 | 78 | -1.29% | -3.47% |
| HROW | Harrow Health | | Health Care | 10.81 | 50 | 3.05% | -3.48% |
| AVDX | AvidXchange | | Technology | 11.98 | 45 | -1.32% | -3.50% |
| ARCH | Arch Coal | | Materials | 160.12 | 42 | -0.02% | -3.51% |
| PKOH | Park-Ohio | | Services & Goods | 26.01 | 37 | 1.60% | -3.52% |


| Too many stocks? View smallcap stocks filtered by marketcap & sector |
| Marketcap: All SmallCap Stocks (default-no microcap), Large, Mid-Range, Small |
| Smallcap Sector: Tech, Finance, Energy, Staples, Retail, Industrial, Materials, & Medical |
|
Get the most comprehensive stock market coverage daily at 12Stocks.com ➞ Best Stocks Today ➞ Best Stocks Weekly ➞ Best Stocks Year-to-Date ➞ Best Stocks Trends ➞  Best Stocks Today 12Stocks.com Best Nasdaq Stocks ➞ Best S&P 500 Stocks ➞ Best Tech Stocks ➞ Best Biotech Stocks ➞ |
| Detailed Overview of SmallCap Stocks |
| SmallCap Technical Overview, Leaders & Laggards, Top SmallCap ETF Funds & Detailed SmallCap Stocks List, Charts, Trends & More |
| Smallcap: Technical Analysis, Trends & YTD Performance | |
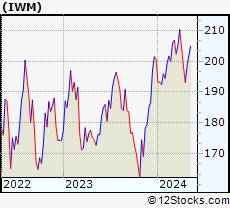
| SmallCap segment as represented by
IWM, an exchange-traded fund [ETF], holds basket of thousands of smallcap stocks from across all major sectors of the US stock market. The smallcap index (contains stocks like Riverbed & Sotheby's) is up by 2.12% and is currently underperforming the overall market by -6% year-to-date. Below is a quick view of technical charts and trends: | |
 IWM Weekly Chart |
|
| Long Term Trend: Very Good | |
| Medium Term Trend: Very Good | |
 IWM Daily Chart |
|
| Short Term Trend: Very Good | |
| Overall Trend Score: 87 | |
| YTD Performance: 2.12% | |
| **Trend Scores & Views Are Only For Educational Purposes And Not For Investing | |
| 12Stocks.com: Top Performing Small Cap Index Stocks | ||||||||||||||||||||||||||||||||||||||||||||||||
 The top performing Small Cap Index stocks year to date are
Now, more recently, over last week, the top performing Small Cap Index stocks on the move are


|
||||||||||||||||||||||||||||||||||||||||||||||||
| 12Stocks.com: Investing in Smallcap Index using Exchange Traded Funds | |
|
The following table shows list of key exchange traded funds (ETF) that
help investors track Smallcap index. The following list also includes leveraged ETF funds that track twice or thrice the daily returns of Smallcap indices. Short or inverse ETF funds move in the opposite direction to the index they track and are useful during market pullbacks or during bear markets. Quick View: Move mouse or cursor over ETF symbol (ticker) to view short-term technical chart and over ETF name to view long term chart. Click on ticker or stock name for detailed view. Click on to add stock symbol to your watchlist and to view watchlist. |
12Stocks.com List of ETFs that track Smallcap Index
| Ticker | ETF Name | Watchlist | Recent Price | Smart Investing & Trading Score | Change % | Week % | Year-to-date % |
| IWM | iShares Russell 2000 | | 204.97 | 87 | 0.22 | 1.52 | 2.12% |
| IJR | iShares Core S&P Small-Cap | | 108.62 | 100 | 0.33 | 1.39 | 0.34% |
| VTWO | Vanguard Russell 2000 ETF | | 82.85 | 82 | 0.23 | 1.52 | 2.16% |
| IWN | iShares Russell 2000 Value | | 155.63 | 100 | -0.01 | 0.92 | 0.19% |
| IWO | iShares Russell 2000 Growth | | 262.30 | 69 | 0.49 | 2.11 | 4% |
| IJS | iShares S&P Small-Cap 600 Value | | 99.68 | 82 | -0.07 | 0.97 | -3.29% |
| IJT | iShares S&P Small-Cap 600 Growth | | 130.16 | 95 | 0.81 | 1.88 | 4.01% |
| XSLV | PowerShares S&P SmallCap Low Volatil ETF | | 44.00 | 100 | 0.96 | 1.8 | -0.34% |
| SAA | ProShares Ultra SmallCap600 | | 24.39 | 95 | 1.16 | 3.39 | -2.24% |
| SMLV | SPDR SSGA US Small Cap Low Volatil ETF | | 110.48 | 82 | -0.10 | 0.72 | -1.81% |
| SBB | ProShares Short SmallCap600 | | 15.97 | 13 | -0.50 | -1.18 | 0.25% |
| SDD | ProShares UltraShort SmallCap600 | | 18.22 | 10 | -1.10 | -3.33 | -1.13% |
| 12Stocks.com: Charts, Trends, Fundamental Data and Performances of SmallCap Stocks | |
|
We now take in-depth look at all SmallCap stocks including charts, multi-period performances and overall trends (as measured by Smart Investing & Trading Score). One can sort SmallCap stocks (click link to choose) by Daily, Weekly and by Year-to-Date performances. Also, one can sort by size of the company or by market capitalization. |
| Select Your Default Chart Type: | |||||
| |||||
| Click on stock symbol or name for detailed view. Click on to add stock symbol to your watchlist and to view watchlist. Quick View: Move mouse or cursor over "Daily" to quickly view daily technical stock chart and over "Weekly" to view weekly technical stock chart. | |||||

 | IBCP Independent Bank Corporation |
| Sector: Financials | |
| SubSector: Regional - Midwest Banks | |
| MarketCap: 273.67 Millions | |
| Recent Price: 25.29 Smart Investing & Trading Score: 95 | |
| Day Percent Change: 0.14% Day Change: 0.04 | |
| Week Change: 0.34% Year-to-date Change: -2.8% | |
| IBCP Links: Profile News Message Board | |
| Charts:- Daily , Weekly | |
| Add IBCP to Watchlist: View: Get Complete IBCP Trend Analysis ➞ | |
 | IDCC InterDigital, Inc. |
| Sector: Technology | |
| SubSector: Wireless Communications | |
| MarketCap: 1225.27 Millions | |
| Recent Price: 105.46 Smart Investing & Trading Score: 64 | |
| Day Percent Change: 0.15% Day Change: 0.16 | |
| Week Change: 1.76% Year-to-date Change: -2.8% | |
| IDCC Links: Profile News Message Board | |
| Charts:- Daily , Weekly | |
| Add IDCC to Watchlist: View: Get Complete IDCC Trend Analysis ➞ | |
 | FEAM 5E Advanced Materials Inc. |
| Sector: Materials | |
| SubSector: Specialty Chemicals | |
| MarketCap: 247 Millions | |
| Recent Price: 1.37 Smart Investing & Trading Score: 74 | |
| Day Percent Change: -5.52% Day Change: -0.08 | |
| Week Change: 7.87% Year-to-date Change: -2.8% | |
| FEAM Links: Profile News Message Board | |
| Charts:- Daily , Weekly | |
| Add FEAM to Watchlist: View: Get Complete FEAM Trend Analysis ➞ | |
 | ESRT Empire State Realty Trust, Inc. |
| Sector: Financials | |
| SubSector: REIT - Diversified | |
| MarketCap: 1632.13 Millions | |
| Recent Price: 9.41 Smart Investing & Trading Score: 57 | |
| Day Percent Change: 0.32% Day Change: 0.03 | |
| Week Change: 1.18% Year-to-date Change: -2.9% | |
| ESRT Links: Profile News Message Board | |
| Charts:- Daily , Weekly | |
| Add ESRT to Watchlist: View: Get Complete ESRT Trend Analysis ➞ | |
 | NRDS NerdWallet, Inc. |
| Sector: Financials | |
| SubSector: Credit Services | |
| MarketCap: 759 Millions | |
| Recent Price: 14.49 Smart Investing & Trading Score: 69 | |
| Day Percent Change: 1.15% Day Change: 0.16 | |
| Week Change: 6.54% Year-to-date Change: -3.0% | |
| NRDS Links: Profile News Message Board | |
| Charts:- Daily , Weekly | |
| Add NRDS to Watchlist: View: Get Complete NRDS Trend Analysis ➞ | |
 | THRM Gentherm Incorporated |
| Sector: Consumer Staples | |
| SubSector: Auto Parts | |
| MarketCap: 1032.59 Millions | |
| Recent Price: 50.78 Smart Investing & Trading Score: 50 | |
| Day Percent Change: -0.52% Day Change: -0.27 | |
| Week Change: -0.87% Year-to-date Change: -3.0% | |
| THRM Links: Profile News Message Board | |
| Charts:- Daily , Weekly | |
| Add THRM to Watchlist: View: Get Complete THRM Trend Analysis ➞ | |
 | KVHI KVH Industries, Inc. |
| Sector: Technology | |
| SubSector: Communication Equipment | |
| MarketCap: 169.939 Millions | |
| Recent Price: 5.10 Smart Investing & Trading Score: 65 | |
| Day Percent Change: 2.00% Day Change: 0.10 | |
| Week Change: 2.2% Year-to-date Change: -3.0% | |
| KVHI Links: Profile News Message Board | |
| Charts:- Daily , Weekly | |
| Add KVHI to Watchlist: View: Get Complete KVHI Trend Analysis ➞ | |
 | BHVN Biohaven Pharmaceutical Holding Company Ltd. |
| Sector: Health Care | |
| SubSector: Biotechnology | |
| MarketCap: 2024.25 Millions | |
| Recent Price: 41.47 Smart Investing & Trading Score: 64 | |
| Day Percent Change: 0.68% Day Change: 0.28 | |
| Week Change: 1.92% Year-to-date Change: -3.1% | |
| BHVN Links: Profile News Message Board | |
| Charts:- Daily , Weekly | |
| Add BHVN to Watchlist: View: Get Complete BHVN Trend Analysis ➞ | |
 | PNRG PrimeEnergy Resources Corporation |
| Sector: Energy | |
| SubSector: Independent Oil & Gas | |
| MarketCap: 112.593 Millions | |
| Recent Price: 102.98 Smart Investing & Trading Score: 56 | |
| Day Percent Change: 0.00% Day Change: 0.00 | |
| Week Change: -0.45% Year-to-date Change: -3.2% | |
| PNRG Links: Profile News Message Board | |
| Charts:- Daily , Weekly | |
| Add PNRG to Watchlist: View: Get Complete PNRG Trend Analysis ➞ | |
 | CRC California Resources Corporation |
| Sector: Energy | |
| SubSector: Oil & Gas E&P | |
| MarketCap: 18247 Millions | |
| Recent Price: 52.94 Smart Investing & Trading Score: 58 | |
| Day Percent Change: 0.47% Day Change: 0.25 | |
| Week Change: 2.44% Year-to-date Change: -3.2% | |
| CRC Links: Profile News Message Board | |
| Charts:- Daily , Weekly | |
| Add CRC to Watchlist: View: Get Complete CRC Trend Analysis ➞ | |
 | INVA Innoviva, Inc. |
| Sector: Health Care | |
| SubSector: Biotechnology | |
| MarketCap: 1023.15 Millions | |
| Recent Price: 15.53 Smart Investing & Trading Score: 95 | |
| Day Percent Change: 0.52% Day Change: 0.08 | |
| Week Change: 2.17% Year-to-date Change: -3.2% | |
| INVA Links: Profile News Message Board | |
| Charts:- Daily , Weekly | |
| Add INVA to Watchlist: View: Get Complete INVA Trend Analysis ➞ | |
 | BL BlackLine, Inc. |
| Sector: Technology | |
| SubSector: Application Software | |
| MarketCap: 2972.62 Millions | |
| Recent Price: 60.45 Smart Investing & Trading Score: 90 | |
| Day Percent Change: -0.43% Day Change: -0.26 | |
| Week Change: -0.76% Year-to-date Change: -3.2% | |
| BL Links: Profile News Message Board | |
| Charts:- Daily , Weekly | |
| Add BL to Watchlist: View: Get Complete BL Trend Analysis ➞ | |
 | BLFY Blue Foundry Bancorp |
| Sector: Financials | |
| SubSector: Banks - Regional | |
| MarketCap: 264 Millions | |
| Recent Price: 9.32 Smart Investing & Trading Score: 64 | |
| Day Percent Change: 1.91% Day Change: 0.18 | |
| Week Change: 2.08% Year-to-date Change: -3.2% | |
| BLFY Links: Profile News Message Board | |
| Charts:- Daily , Weekly | |
| Add BLFY to Watchlist: View: Get Complete BLFY Trend Analysis ➞ | |
 | YEXT Yext, Inc. |
| Sector: Technology | |
| SubSector: Internet Software & Services | |
| MarketCap: 1414.91 Millions | |
| Recent Price: 5.70 Smart Investing & Trading Score: 74 | |
| Day Percent Change: 1.79% Day Change: 0.10 | |
| Week Change: 4.78% Year-to-date Change: -3.2% | |
| YEXT Links: Profile News Message Board | |
| Charts:- Daily , Weekly | |
| Add YEXT to Watchlist: View: Get Complete YEXT Trend Analysis ➞ | |
 | SHOO Steven Madden, Ltd. |
| Sector: Consumer Staples | |
| SubSector: Textile - Apparel Footwear & Accessories | |
| MarketCap: 1756.3 Millions | |
| Recent Price: 40.64 Smart Investing & Trading Score: 57 | |
| Day Percent Change: 0.37% Day Change: 0.15 | |
| Week Change: 2.65% Year-to-date Change: -3.2% | |
| SHOO Links: Profile News Message Board | |
| Charts:- Daily , Weekly | |
| Add SHOO to Watchlist: View: Get Complete SHOO Trend Analysis ➞ | |
 | GEF Greif, Inc. |
| Sector: Consumer Staples | |
| SubSector: Packaging & Containers | |
| MarketCap: 1563.03 Millions | |
| Recent Price: 63.46 Smart Investing & Trading Score: 74 | |
| Day Percent Change: 0.28% Day Change: 0.18 | |
| Week Change: 0.89% Year-to-date Change: -3.3% | |
| GEF Links: Profile News Message Board | |
| Charts:- Daily , Weekly | |
| Add GEF to Watchlist: View: Get Complete GEF Trend Analysis ➞ | |
 | SHO Sunstone Hotel Investors, Inc. |
| Sector: Financials | |
| SubSector: REIT - Hotel/Motel | |
| MarketCap: 1861.04 Millions | |
| Recent Price: 10.38 Smart Investing & Trading Score: 64 | |
| Day Percent Change: 0.19% Day Change: 0.02 | |
| Week Change: 1.86% Year-to-date Change: -3.3% | |
| SHO Links: Profile News Message Board | |
| Charts:- Daily , Weekly | |
| Add SHO to Watchlist: View: Get Complete SHO Trend Analysis ➞ | |
 | AXSM Axsome Therapeutics, Inc. |
| Sector: Health Care | |
| SubSector: Biotechnology | |
| MarketCap: 2284.25 Millions | |
| Recent Price: 76.97 Smart Investing & Trading Score: 32 | |
| Day Percent Change: 1.36% Day Change: 1.03 | |
| Week Change: 2.9% Year-to-date Change: -3.3% | |
| AXSM Links: Profile News Message Board | |
| Charts:- Daily , Weekly | |
| Add AXSM to Watchlist: View: Get Complete AXSM Trend Analysis ➞ | |
 | RHP Ryman Hospitality Properties, Inc. |
| Sector: Financials | |
| SubSector: REIT - Hotel/Motel | |
| MarketCap: 1519.74 Millions | |
| Recent Price: 106.42 Smart Investing & Trading Score: 57 | |
| Day Percent Change: 1.10% Day Change: 1.16 | |
| Week Change: 1.91% Year-to-date Change: -3.3% | |
| RHP Links: Profile News Message Board | |
| Charts:- Daily , Weekly | |
| Add RHP to Watchlist: View: Get Complete RHP Trend Analysis ➞ | |
 | IVAC Intevac, Inc. |
| Sector: Technology | |
| SubSector: Diversified Electronics | |
| MarketCap: 89.2396 Millions | |
| Recent Price: 4.17 Smart Investing & Trading Score: 63 | |
| Day Percent Change: -0.83% Day Change: -0.04 | |
| Week Change: -2% Year-to-date Change: -3.4% | |
| IVAC Links: Profile News Message Board | |
| Charts:- Daily , Weekly | |
| Add IVAC to Watchlist: View: Get Complete IVAC Trend Analysis ➞ | |
 | JOE The St. Joe Company |
| Sector: Financials | |
| SubSector: Real Estate Development | |
| MarketCap: 1029.39 Millions | |
| Recent Price: 58.09 Smart Investing & Trading Score: 78 | |
| Day Percent Change: -1.29% Day Change: -0.76 | |
| Week Change: -1.27% Year-to-date Change: -3.5% | |
| JOE Links: Profile News Message Board | |
| Charts:- Daily , Weekly | |
| Add JOE to Watchlist: View: Get Complete JOE Trend Analysis ➞ | |
 | HROW Harrow Health, Inc. |
| Sector: Health Care | |
| SubSector: Drug Manufacturers - Other | |
| MarketCap: 104.033 Millions | |
| Recent Price: 10.81 Smart Investing & Trading Score: 50 | |
| Day Percent Change: 3.05% Day Change: 0.32 | |
| Week Change: 4.14% Year-to-date Change: -3.5% | |
| HROW Links: Profile News Message Board | |
| Charts:- Daily , Weekly | |
| Add HROW to Watchlist: View: Get Complete HROW Trend Analysis ➞ | |
 | AVDX AvidXchange Holdings, Inc. |
| Sector: Technology | |
| SubSector: Software - Infrastructure | |
| MarketCap: 2120 Millions | |
| Recent Price: 11.98 Smart Investing & Trading Score: 45 | |
| Day Percent Change: -1.32% Day Change: -0.16 | |
| Week Change: -1.2% Year-to-date Change: -3.5% | |
| AVDX Links: Profile News Message Board | |
| Charts:- Daily , Weekly | |
| Add AVDX to Watchlist: View: Get Complete AVDX Trend Analysis ➞ | |
 | ARCH Arch Coal, Inc. |
| Sector: Materials | |
| SubSector: Industrial Metals & Minerals | |
| MarketCap: 547.21 Millions | |
| Recent Price: 160.12 Smart Investing & Trading Score: 42 | |
| Day Percent Change: -0.02% Day Change: -0.04 | |
| Week Change: -0.81% Year-to-date Change: -3.5% | |
| ARCH Links: Profile News Message Board | |
| Charts:- Daily , Weekly | |
| Add ARCH to Watchlist: View: Get Complete ARCH Trend Analysis ➞ | |
 | PKOH Park-Ohio Holdings Corp. |
| Sector: Services & Goods | |
| SubSector: Industrial Equipment Wholesale | |
| MarketCap: 214.358 Millions | |
| Recent Price: 26.01 Smart Investing & Trading Score: 37 | |
| Day Percent Change: 1.60% Day Change: 0.41 | |
| Week Change: -0.23% Year-to-date Change: -3.5% | |
| PKOH Links: Profile News Message Board | |
| Charts:- Daily , Weekly | |
| Add PKOH to Watchlist: View: Get Complete PKOH Trend Analysis ➞ | |
| Too many stocks? View smallcap stocks filtered by marketcap & sector |
| Marketcap: All SmallCap Stocks (default-no microcap), Large, Mid-Range, Small & MicroCap |
| Sector: Tech, Finance, Energy, Staples, Retail, Industrial, Materials, Utilities & Medical |
|
Best Stocks Today 12Stocks.com |
© 2024 12Stocks.com Terms & Conditions Privacy Contact Us
All Information Provided Only For Education And Not To Be Used For Investing or Trading. See Terms & Conditions


One More Thing ... Get Best Stocks Delivered Daily!
Never Ever Miss A Move With Our Top Ten Stocks Lists
Find Best Stocks In Any Market - Bull or Bear Market
Take A Peek At Our Top Ten Stocks Lists: Daily, Weekly, Year-to-Date & Top Trends
Find Best Stocks In Any Market - Bull or Bear Market
Take A Peek At Our Top Ten Stocks Lists: Daily, Weekly, Year-to-Date & Top Trends
Smallcap Stocks With Best Up Trends [0-bearish to 100-bullish]: Design [100], Ambac Financial[100], Summit [100], EverQuote [100], Zeta Global[100], Coca-Cola Consolidated[100], Origin Materials[100], J & J Snack Foods[100], Sterling Construction[100], Vanda [100], Semrush [100]
Best Smallcap Stocks Year-to-Date:
Janux [471.8%], Viking [327.92%], Longboard [261.21%], Alpine Immune[239.34%], Bakkt [227.35%], Vera [190.57%], Super Micro[188.3%], Cullinan Oncology[187.84%], Avidity Biosciences[180.97%], Y-mAbs [152.49%], Arcutis Bio[143.81%] Best Smallcap Stocks This Week:
Perficient [52.28%], Thoughtworks Holding[34.22%], Trupanion [28.82%], DASAN Zhone[26.29%], Great Lakes[26.01%], Design [23.42%], Workhorse Group[23.19%], Ambac Financial[22.97%], P3 Health[22.14%], Summit [20.73%], Sterling Construction[20.6%] Best Smallcap Stocks Daily:
Design [28.85%], Great Lakes[24.57%], Thoughtworks Holding[19.84%], Ambac Financial[19.31%], Summit [18.57%], EverQuote [18.40%], Zeta Global[18.35%], Coca-Cola Consolidated[17.76%], FibroGen [17.67%], Origin Materials[17.31%], J & J Snack Foods[16.43%]