
 Login Sign Up


| |||||
 |  | ||||

| 12Stocks.com Market Intelligence |
Best SmallCap Stocks
|
| In a hurry? Small Cap Stock Lists: Performance Trends Table, Stock Charts
Sort Small Cap stocks: Daily, Weekly, Year-to-Date, Market Cap & Trends. Filter Small Cap stocks list by sector: Show all, Tech, Finance, Energy, Staples, Retail, Industrial, Materials, Utilities and HealthCare Filter Small Cap stocks list by size: All Large Medium Small and MicroCap |
| 12Stocks.com Small Cap Stocks Performances & Trends Daily | |||||||||
|
|  The overall Smart Investing & Trading Score is 14 (0-bearish to 100-bullish) which puts Small Cap index in short term bearish trend. The Smart Investing & Trading Score from previous trading session is 41 and hence a deterioration of trend.
| ||||||||
Here are the Smart Investing & Trading Scores of the most requested small cap stocks at 12Stocks.com (click stock name for detailed review):
|


| 12Stocks.com: Investing in Smallcap Index with Stocks | |
|
The following table helps investors and traders sort through current performance and trends (as measured by Smart Investing & Trading Score) of various
stocks in the Smallcap Index. Quick View: Move mouse or cursor over stock symbol (ticker) to view short-term technical chart and over stock name to view long term chart. Click on  to add stock symbol to your watchlist and to add stock symbol to your watchlist and  to view watchlist. Click on any ticker or stock name for detailed market intelligence report for that stock. to view watchlist. Click on any ticker or stock name for detailed market intelligence report for that stock. |
12Stocks.com Performance of Stocks in Smallcap Index
| Ticker | Stock Name | Watchlist | Category | Recent Price | Smart Investing & Trading Score | Change % | YTD Change% |
| RM | Regional Management |   | Financials | 25.29 | 51 | 0.32% | 0.84% |
| AMRX | Amneal | | Health Care | 6.12 | 90 | 1.16% | 0.82% |
| SP | SP Plus | | Services & Goods | 51.66 | 62 | 1.18% | 0.80% |
| ASB | Associated Banc-Corp | | Financials | 21.56 | 80 | 2.33% | 0.79% |
| SITC | SITE Centers | | Financials | 13.73 | 83 | 1.78% | 0.73% |
| WOR | Worthington Industries | | Materials | 57.96 | 25 | 1.40% | 0.71% |
| AEL | American Equity | | Financials | 56.16 | 66 | 0.09% | 0.65% |
| JBLU | JetBlue Airways | | Transports | 5.59 | 15 | -1.67% | 0.63% |
| AKR | Acadia Realty | | Financials | 17.09 | 46 | -1.10% | 0.59% |
| CERE | Cerevel | | Health Care | 42.62 | 78 | -0.21% | 0.54% |
| CODI | Compass Diversified | | Industrials | 22.57 | 25 | 2.73% | 0.53% |
| UNIT | Uniti Group | | Financials | 5.81 | 62 | 1.04% | 0.52% |
| UTL | Unitil | | Utilities | 52.75 | 100 | 3.55% | 0.34% |
| TCMD | Tactile Systems | | Health Care | 14.34 | 25 | 4.14% | 0.28% |
| CTO | Consolidated-Tomoka Land | | Financials | 17.37 | 95 | 0.12% | 0.23% |
| RRR | Red Rock | | Transports | 53.45 | 10 | 0.62% | 0.23% |
| AMWD | American Woodmark | | Consumer Staples | 93.04 | 32 | 1.04% | 0.20% |
| TCBX | Third Coast | | Financials | 20.04 | 88 | 3.17% | 0.12% |
| HNI | HNI | | Consumer Staples | 41.87 | 15 | -0.19% | 0.10% |
| SGMO | Sangamo | | Health Care | 0.54 | 64 | 5.61% | 0.09% |
| LGND | Ligand | | Health Care | 71.42 | 37 | 2.19% | 0.00% |
| ITIC | Investors Title | | Financials | 162.08 | 88 | 1.03% | -0.04% |
| UVSP | Univest Financial | | Financials | 22.02 | 100 | 5.51% | -0.05% |
| IE | Ivanhoe Electric | | Materials | 10.13 | 43 | 0.30% | -0.05% |
| ABM | ABM Industries | | Services & Goods | 44.80 | 95 | 2.52% | -0.07% |


| Too many stocks? View smallcap stocks filtered by marketcap & sector |
| Marketcap: All SmallCap Stocks (default-no microcap), Large, Mid-Range, Small |
| Smallcap Sector: Tech, Finance, Energy, Staples, Retail, Industrial, Materials, & Medical |
|
Get the most comprehensive stock market coverage daily at 12Stocks.com ➞ Best Stocks Today ➞ Best Stocks Weekly ➞ Best Stocks Year-to-Date ➞ Best Stocks Trends ➞  Best Stocks Today 12Stocks.com Best Nasdaq Stocks ➞ Best S&P 500 Stocks ➞ Best Tech Stocks ➞ Best Biotech Stocks ➞ |
| Detailed Overview of SmallCap Stocks |
| SmallCap Technical Overview, Leaders & Laggards, Top SmallCap ETF Funds & Detailed SmallCap Stocks List, Charts, Trends & More |
| Smallcap: Technical Analysis, Trends & YTD Performance | |
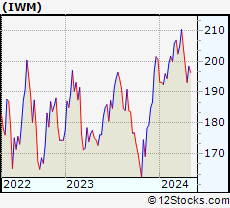
| SmallCap segment as represented by
IWM, an exchange-traded fund [ETF], holds basket of thousands of smallcap stocks from across all major sectors of the US stock market. The smallcap index (contains stocks like Riverbed & Sotheby's) is down by -2.19% and is currently underperforming the overall market by -6.73% year-to-date. Below is a quick view of technical charts and trends: | |
 IWM Weekly Chart |
|
| Long Term Trend: Not Good | |
| Medium Term Trend: Not Good | |
 IWM Daily Chart |
|
| Short Term Trend: Not Good | |
| Overall Trend Score: 14 | |
| YTD Performance: -2.19% | |
| **Trend Scores & Views Are Only For Educational Purposes And Not For Investing | |
| 12Stocks.com: Top Performing Small Cap Index Stocks | ||||||||||||||||||||||||||||||||||||||||||||||||
 The top performing Small Cap Index stocks year to date are
Now, more recently, over last week, the top performing Small Cap Index stocks on the move are


|
||||||||||||||||||||||||||||||||||||||||||||||||
| 12Stocks.com: Investing in Smallcap Index using Exchange Traded Funds | |
|
The following table shows list of key exchange traded funds (ETF) that
help investors track Smallcap index. The following list also includes leveraged ETF funds that track twice or thrice the daily returns of Smallcap indices. Short or inverse ETF funds move in the opposite direction to the index they track and are useful during market pullbacks or during bear markets. Quick View: Move mouse or cursor over ETF symbol (ticker) to view short-term technical chart and over ETF name to view long term chart. Click on ticker or stock name for detailed view. Click on to add stock symbol to your watchlist and to view watchlist. |
12Stocks.com List of ETFs that track Smallcap Index
| Ticker | ETF Name | Watchlist | Recent Price | Smart Investing & Trading Score | Change % | Week % | Year-to-date % |
| IWM | iShares Russell 2000 | | 196.31 | 14 | 0.21 | -1.05 | -2.19% |
| IJR | iShares Core S&P Small-Cap | | 104.74 | 22 | 0.34 | -0.86 | -3.24% |
| VTWO | Vanguard Russell 2000 ETF | | 79.36 | 14 | 0.25 | -1.07 | -2.15% |
| IWN | iShares Russell 2000 Value | | 149.82 | 22 | 0.52 | -0.87 | -3.55% |
| IJS | iShares S&P Small-Cap 600 Value | | 96.40 | 15 | 0.33 | -0.81 | -6.47% |
| IWO | iShares Russell 2000 Growth | | 249.58 | 7 | -0.30 | -1.39 | -1.05% |
| IJT | iShares S&P Small-Cap 600 Growth | | 124.94 | 15 | 0.27 | -0.91 | -0.16% |
| XSLV | PowerShares S&P SmallCap Low Volatil ETF | | 42.94 | 52 | 0.93 | 0.5 | -2.75% |
| SDD | ProShares UltraShort SmallCap600 | | 19.50 | 78 | -0.36 | 0.78 | 5.83% |
| SMLV | SPDR SSGA US Small Cap Low Volatil ETF | | 107.81 | 40 | 1.45 | 0.27 | -4.19% |
| SBB | ProShares Short SmallCap600 | | 16.50 | 71 | -0.30 | 0.7 | 3.58% |
| SAA | ProShares Ultra SmallCap600 | | 22.53 | 8 | -0.31 | -2.21 | -9.7% |
| 12Stocks.com: Charts, Trends, Fundamental Data and Performances of SmallCap Stocks | |
|
We now take in-depth look at all SmallCap stocks including charts, multi-period performances and overall trends (as measured by Smart Investing & Trading Score). One can sort SmallCap stocks (click link to choose) by Daily, Weekly and by Year-to-Date performances. Also, one can sort by size of the company or by market capitalization. |
| Select Your Default Chart Type: | |||||
| |||||
| Click on stock symbol or name for detailed view. Click on to add stock symbol to your watchlist and to view watchlist. Quick View: Move mouse or cursor over "Daily" to quickly view daily technical stock chart and over "Weekly" to view weekly technical stock chart. | |||||

 | RM Regional Management Corp. |
| Sector: Financials | |
| SubSector: Credit Services | |
| MarketCap: 148.008 Millions | |
| Recent Price: 25.29 Smart Investing & Trading Score: 51 | |
| Day Percent Change: 0.32% Day Change: 0.08 | |
| Week Change: -4.28% Year-to-date Change: 0.8% | |
| RM Links: Profile News Message Board | |
| Charts:- Daily , Weekly | |
| Add RM to Watchlist: View: Get Complete RM Trend Analysis ➞ | |
 | AMRX Amneal Pharmaceuticals, Inc. |
| Sector: Health Care | |
| SubSector: Drug Related Products | |
| MarketCap: 1218.13 Millions | |
| Recent Price: 6.12 Smart Investing & Trading Score: 90 | |
| Day Percent Change: 1.16% Day Change: 0.07 | |
| Week Change: 4.26% Year-to-date Change: 0.8% | |
| AMRX Links: Profile News Message Board | |
| Charts:- Daily , Weekly | |
| Add AMRX to Watchlist: View: Get Complete AMRX Trend Analysis ➞ | |
 | SP SP Plus Corporation |
| Sector: Services & Goods | |
| SubSector: Management Services | |
| MarketCap: 494.545 Millions | |
| Recent Price: 51.66 Smart Investing & Trading Score: 62 | |
| Day Percent Change: 1.18% Day Change: 0.60 | |
| Week Change: 1% Year-to-date Change: 0.8% | |
| SP Links: Profile News Message Board | |
| Charts:- Daily , Weekly | |
| Add SP to Watchlist: View: Get Complete SP Trend Analysis ➞ | |
 | ASB Associated Banc-Corp |
| Sector: Financials | |
| SubSector: Regional - Midwest Banks | |
| MarketCap: 1904.8 Millions | |
| Recent Price: 21.56 Smart Investing & Trading Score: 80 | |
| Day Percent Change: 2.33% Day Change: 0.49 | |
| Week Change: -0.05% Year-to-date Change: 0.8% | |
| ASB Links: Profile News Message Board | |
| Charts:- Daily , Weekly | |
| Add ASB to Watchlist: View: Get Complete ASB Trend Analysis ➞ | |
 | SITC SITE Centers Corp. |
| Sector: Financials | |
| SubSector: REIT - Retail | |
| MarketCap: 1449.54 Millions | |
| Recent Price: 13.73 Smart Investing & Trading Score: 83 | |
| Day Percent Change: 1.78% Day Change: 0.24 | |
| Week Change: 1.85% Year-to-date Change: 0.7% | |
| SITC Links: Profile News Message Board | |
| Charts:- Daily , Weekly | |
| Add SITC to Watchlist: View: Get Complete SITC Trend Analysis ➞ | |
 | WOR Worthington Industries, Inc. |
| Sector: Materials | |
| SubSector: Steel & Iron | |
| MarketCap: 1354.48 Millions | |
| Recent Price: 57.96 Smart Investing & Trading Score: 25 | |
| Day Percent Change: 1.40% Day Change: 0.80 | |
| Week Change: -0.77% Year-to-date Change: 0.7% | |
| WOR Links: Profile News Message Board | |
| Charts:- Daily , Weekly | |
| Add WOR to Watchlist: View: Get Complete WOR Trend Analysis ➞ | |
 | AEL American Equity Investment Life Holding Company |
| Sector: Financials | |
| SubSector: Life Insurance | |
| MarketCap: 1304.46 Millions | |
| Recent Price: 56.16 Smart Investing & Trading Score: 66 | |
| Day Percent Change: 0.09% Day Change: 0.05 | |
| Week Change: -0.27% Year-to-date Change: 0.7% | |
| AEL Links: Profile News Message Board | |
| Charts:- Daily , Weekly | |
| Add AEL to Watchlist: View: Get Complete AEL Trend Analysis ➞ | |
 | JBLU JetBlue Airways Corporation |
| Sector: Transports | |
| SubSector: Regional Airlines | |
| MarketCap: 2383.1 Millions | |
| Recent Price: 5.59 Smart Investing & Trading Score: 15 | |
| Day Percent Change: -1.67% Day Change: -0.09 | |
| Week Change: -3.37% Year-to-date Change: 0.6% | |
| JBLU Links: Profile News Message Board | |
| Charts:- Daily , Weekly | |
| Add JBLU to Watchlist: View: Get Complete JBLU Trend Analysis ➞ | |
 | AKR Acadia Realty Trust |
| Sector: Financials | |
| SubSector: Property Management | |
| MarketCap: 1367.42 Millions | |
| Recent Price: 17.09 Smart Investing & Trading Score: 46 | |
| Day Percent Change: -1.10% Day Change: -0.19 | |
| Week Change: -1.33% Year-to-date Change: 0.6% | |
| AKR Links: Profile News Message Board | |
| Charts:- Daily , Weekly | |
| Add AKR to Watchlist: View: Get Complete AKR Trend Analysis ➞ | |
 | CERE Cerevel Therapeutics Holdings, Inc. |
| Sector: Health Care | |
| SubSector: Biotechnology | |
| MarketCap: 21587 Millions | |
| Recent Price: 42.62 Smart Investing & Trading Score: 78 | |
| Day Percent Change: -0.21% Day Change: -0.09 | |
| Week Change: 0.35% Year-to-date Change: 0.5% | |
| CERE Links: Profile News Message Board | |
| Charts:- Daily , Weekly | |
| Add CERE to Watchlist: View: Get Complete CERE Trend Analysis ➞ | |
 | CODI Compass Diversified Holdings LLC |
| Sector: Industrials | |
| SubSector: Conglomerates | |
| MarketCap: 803.348 Millions | |
| Recent Price: 22.57 Smart Investing & Trading Score: 25 | |
| Day Percent Change: 2.73% Day Change: 0.60 | |
| Week Change: -0.22% Year-to-date Change: 0.5% | |
| CODI Links: Profile News Message Board | |
| Charts:- Daily , Weekly | |
| Add CODI to Watchlist: View: Get Complete CODI Trend Analysis ➞ | |
 | UNIT Uniti Group Inc. |
| Sector: Financials | |
| SubSector: REIT - Industrial | |
| MarketCap: 1363.09 Millions | |
| Recent Price: 5.81 Smart Investing & Trading Score: 62 | |
| Day Percent Change: 1.04% Day Change: 0.06 | |
| Week Change: 0.52% Year-to-date Change: 0.5% | |
| UNIT Links: Profile News Message Board | |
| Charts:- Daily , Weekly | |
| Add UNIT to Watchlist: View: Get Complete UNIT Trend Analysis ➞ | |
 | UTL Unitil Corporation |
| Sector: Utilities | |
| SubSector: Diversified Utilities | |
| MarketCap: 756.98 Millions | |
| Recent Price: 52.75 Smart Investing & Trading Score: 100 | |
| Day Percent Change: 3.55% Day Change: 1.81 | |
| Week Change: 5.63% Year-to-date Change: 0.3% | |
| UTL Links: Profile News Message Board | |
| Charts:- Daily , Weekly | |
| Add UTL to Watchlist: View: Get Complete UTL Trend Analysis ➞ | |
 | TCMD Tactile Systems Technology, Inc. |
| Sector: Health Care | |
| SubSector: Medical Instruments & Supplies | |
| MarketCap: 655.96 Millions | |
| Recent Price: 14.34 Smart Investing & Trading Score: 25 | |
| Day Percent Change: 4.14% Day Change: 0.57 | |
| Week Change: 0.28% Year-to-date Change: 0.3% | |
| TCMD Links: Profile News Message Board | |
| Charts:- Daily , Weekly | |
| Add TCMD to Watchlist: View: Get Complete TCMD Trend Analysis ➞ | |
 | CTO Consolidated-Tomoka Land Co. |
| Sector: Financials | |
| SubSector: Real Estate Development | |
| MarketCap: 205.119 Millions | |
| Recent Price: 17.37 Smart Investing & Trading Score: 95 | |
| Day Percent Change: 0.12% Day Change: 0.02 | |
| Week Change: 1.4% Year-to-date Change: 0.2% | |
| CTO Links: Profile News Message Board | |
| Charts:- Daily , Weekly | |
| Add CTO to Watchlist: View: Get Complete CTO Trend Analysis ➞ | |
 | RRR Red Rock Resorts, Inc. |
| Sector: Transports | |
| SubSector: Rental & Leasing Services | |
| MarketCap: 1144.04 Millions | |
| Recent Price: 53.45 Smart Investing & Trading Score: 10 | |
| Day Percent Change: 0.62% Day Change: 0.33 | |
| Week Change: -1.24% Year-to-date Change: 0.2% | |
| RRR Links: Profile News Message Board | |
| Charts:- Daily , Weekly | |
| Add RRR to Watchlist: View: Get Complete RRR Trend Analysis ➞ | |
 | AMWD American Woodmark Corporation |
| Sector: Consumer Staples | |
| SubSector: Home Furnishings & Fixtures | |
| MarketCap: 958.435 Millions | |
| Recent Price: 93.04 Smart Investing & Trading Score: 32 | |
| Day Percent Change: 1.04% Day Change: 0.96 | |
| Week Change: 0.13% Year-to-date Change: 0.2% | |
| AMWD Links: Profile News Message Board | |
| Charts:- Daily , Weekly | |
| Add AMWD to Watchlist: View: Get Complete AMWD Trend Analysis ➞ | |
 | TCBX Third Coast Bancshares, Inc. |
| Sector: Financials | |
| SubSector: Banks - Regional | |
| MarketCap: 212 Millions | |
| Recent Price: 20.04 Smart Investing & Trading Score: 88 | |
| Day Percent Change: 3.17% Day Change: 0.61 | |
| Week Change: 0.68% Year-to-date Change: 0.1% | |
| TCBX Links: Profile News Message Board | |
| Charts:- Daily , Weekly | |
| Add TCBX to Watchlist: View: Get Complete TCBX Trend Analysis ➞ | |
 | HNI HNI Corporation |
| Sector: Consumer Staples | |
| SubSector: Business Equipment | |
| MarketCap: 1053.67 Millions | |
| Recent Price: 41.87 Smart Investing & Trading Score: 15 | |
| Day Percent Change: -0.19% Day Change: -0.08 | |
| Week Change: -1.48% Year-to-date Change: 0.1% | |
| HNI Links: Profile News Message Board | |
| Charts:- Daily , Weekly | |
| Add HNI to Watchlist: View: Get Complete HNI Trend Analysis ➞ | |
 | SGMO Sangamo Therapeutics, Inc. |
| Sector: Health Care | |
| SubSector: Biotechnology | |
| MarketCap: 779.285 Millions | |
| Recent Price: 0.54 Smart Investing & Trading Score: 64 | |
| Day Percent Change: 5.61% Day Change: 0.03 | |
| Week Change: 5.02% Year-to-date Change: 0.1% | |
| SGMO Links: Profile News Message Board | |
| Charts:- Daily , Weekly | |
| Add SGMO to Watchlist: View: Get Complete SGMO Trend Analysis ➞ | |
 | LGND Ligand Pharmaceuticals Incorporated |
| Sector: Health Care | |
| SubSector: Biotechnology | |
| MarketCap: 1344.45 Millions | |
| Recent Price: 71.42 Smart Investing & Trading Score: 37 | |
| Day Percent Change: 2.19% Day Change: 1.53 | |
| Week Change: 1.2% Year-to-date Change: 0.0% | |
| LGND Links: Profile News Message Board | |
| Charts:- Daily , Weekly | |
| Add LGND to Watchlist: View: Get Complete LGND Trend Analysis ➞ | |
 | ITIC Investors Title Company |
| Sector: Financials | |
| SubSector: Surety & Title Insurance | |
| MarketCap: 219.518 Millions | |
| Recent Price: 162.08 Smart Investing & Trading Score: 88 | |
| Day Percent Change: 1.03% Day Change: 1.65 | |
| Week Change: 1.71% Year-to-date Change: 0.0% | |
| ITIC Links: Profile News Message Board | |
| Charts:- Daily , Weekly | |
| Add ITIC to Watchlist: View: Get Complete ITIC Trend Analysis ➞ | |
 | UVSP Univest Financial Corporation |
| Sector: Financials | |
| SubSector: Regional - Northeast Banks | |
| MarketCap: 467.999 Millions | |
| Recent Price: 22.02 Smart Investing & Trading Score: 100 | |
| Day Percent Change: 5.51% Day Change: 1.15 | |
| Week Change: 3.72% Year-to-date Change: -0.1% | |
| UVSP Links: Profile News Message Board | |
| Charts:- Daily , Weekly | |
| Add UVSP to Watchlist: View: Get Complete UVSP Trend Analysis ➞ | |
 | IE Ivanhoe Electric Inc. |
| Sector: Materials | |
| SubSector: Copper | |
| MarketCap: 1200 Millions | |
| Recent Price: 10.13 Smart Investing & Trading Score: 43 | |
| Day Percent Change: 0.30% Day Change: 0.03 | |
| Week Change: -5.15% Year-to-date Change: -0.1% | |
| IE Links: Profile News Message Board | |
| Charts:- Daily , Weekly | |
| Add IE to Watchlist: View: Get Complete IE Trend Analysis ➞ | |
 | ABM ABM Industries Incorporated |
| Sector: Services & Goods | |
| SubSector: Business Services | |
| MarketCap: 1706.72 Millions | |
| Recent Price: 44.80 Smart Investing & Trading Score: 95 | |
| Day Percent Change: 2.52% Day Change: 1.10 | |
| Week Change: 1.73% Year-to-date Change: -0.1% | |
| ABM Links: Profile News Message Board | |
| Charts:- Daily , Weekly | |
| Add ABM to Watchlist: View: Get Complete ABM Trend Analysis ➞ | |
| Too many stocks? View smallcap stocks filtered by marketcap & sector |
| Marketcap: All SmallCap Stocks (default-no microcap), Large, Mid-Range, Small & MicroCap |
| Sector: Tech, Finance, Energy, Staples, Retail, Industrial, Materials, Utilities & Medical |
|
Best Stocks Today 12Stocks.com |
© 2024 12Stocks.com Terms & Conditions Privacy Contact Us
All Information Provided Only For Education And Not To Be Used For Investing or Trading. See Terms & Conditions


One More Thing ... Get Best Stocks Delivered Daily!
Never Ever Miss A Move With Our Top Ten Stocks Lists
Find Best Stocks In Any Market - Bull or Bear Market
Take A Peek At Our Top Ten Stocks Lists: Daily, Weekly, Year-to-Date & Top Trends
Find Best Stocks In Any Market - Bull or Bear Market
Take A Peek At Our Top Ten Stocks Lists: Daily, Weekly, Year-to-Date & Top Trends
Smallcap Stocks With Best Up Trends [0-bearish to 100-bullish]: Surmodics [100], Rocky Brands[100], TransMedics Group[100], LendingClub [100], Summit [100], A10 s[100], Carpenter [100], UFP [100], PROCEPT BioRobotics[100], Xencor [100], Trinity Industries[100]
Best Smallcap Stocks Year-to-Date:
Janux [441.55%], Viking [310.69%], Longboard [259.25%], Alpine Immune[239.26%], Avidity Biosciences[185.4%], Bakkt [182.96%], Cullinan Oncology[175.33%], Arcutis Bio[173.68%], Vera [173.32%], Super Micro[159.73%], Y-mAbs [141.79%] Best Smallcap Stocks This Week:
Deciphera [73.11%], Eyenovia [44.86%], Cue Biopharma[39.56%], Seres [30.91%], Poseida [30.52%], P3 Health[29.62%], Phibro Animal[28.44%], TransMedics Group[27.72%], Surmodics [27.36%], LendingTree [26.36%], Rocky Brands[24.92%] Best Smallcap Stocks Daily:
Surmodics [29.74%], Rocky Brands[28.41%], TransMedics Group[24.93%], Ventyx Biosciences[24.63%], Eyenovia [21.17%], LendingClub [19.68%], Summit [19.59%], Powell Industries[18.89%], MiMedx Group[18.67%], CareDx [18.30%], A10 s[17.69%]