
 Login Sign Up


| |||||
 |  | ||||

| 12Stocks.com Market Intelligence |
Best SmallCap Stocks
|
| In a hurry? Small Cap Stock Lists: Performance Trends Table, Stock Charts
Sort Small Cap stocks: Daily, Weekly, Year-to-Date, Market Cap & Trends. Filter Small Cap stocks list by sector: Show all, Tech, Finance, Energy, Staples, Retail, Industrial, Materials, Utilities and HealthCare Filter Small Cap stocks list by size: All Large Medium Small and MicroCap |
| 12Stocks.com Small Cap Stocks Performances & Trends Daily | |||||||||
|
|  The overall Smart Investing & Trading Score is 39 (0-bearish to 100-bullish) which puts Small Cap index in short term bearish to neutral trend. The Smart Investing & Trading Score from previous trading session is 14 and hence an improvement of trend.
| ||||||||
Here are the Smart Investing & Trading Scores of the most requested small cap stocks at 12Stocks.com (click stock name for detailed review):
|


| 12Stocks.com: Investing in Smallcap Index with Stocks | |
|
The following table helps investors and traders sort through current performance and trends (as measured by Smart Investing & Trading Score) of various
stocks in the Smallcap Index. Quick View: Move mouse or cursor over stock symbol (ticker) to view short-term technical chart and over stock name to view long term chart. Click on  to add stock symbol to your watchlist and to add stock symbol to your watchlist and  to view watchlist. Click on any ticker or stock name for detailed market intelligence report for that stock. to view watchlist. Click on any ticker or stock name for detailed market intelligence report for that stock. |
12Stocks.com Performance of Stocks in Smallcap Index
| Ticker | Stock Name | Watchlist | Category | Recent Price | Smart Investing & Trading Score | Change % | YTD Change% |
| PHAT | Phathom |   | Health Care | 9.71 | 44 | 4.91% | 6.41% |
| MTSI | MACOM | | Technology | 98.88 | 33 | -0.24% | 6.38% |
| NR | Newpark Resources | | Energy | 7.06 | 36 | 1.88% | 6.33% |
| AVD | American Vanguard | | Materials | 11.66 | 83 | -0.26% | 6.29% |
| FSS | Federal Signal | | Industrials | 81.52 | 13 | 1.47% | 6.23% |
| GTLS | Chart Industries | | Industrials | 144.79 | 46 | -0.14% | 6.21% |
| BHR | Braemar Hotels | | Financials | 2.65 | 61 | -1.30% | 6.20% |
| DBI | Designer Brands | | Services & Goods | 9.39 | 22 | 2.23% | 6.16% |
| GRBK | Green Brick | | Financials | 55.09 | 17 | 0.07% | 6.06% |
| NGVC | Natural Grocers | | Services & Goods | 16.97 | 52 | 2.69% | 6.03% |
| LYTS | LSI Industries | | Industrials | 14.92 | 48 | 1.36% | 5.97% |
| KBH | KB Home | | Industrials | 66.18 | 52 | 0.82% | 5.96% |
| MYRG | MYR Group | | Industrials | 153.22 | 0 | -7.03% | 5.94% |
| VMD | Viemed Healthcare | | Health Care | 8.31 | 54 | -0.48% | 5.86% |
| OII | Oceaneering | | Energy | 22.52 | 33 | 1.35% | 5.83% |
| FCFS | FirstCash | | Financials | 114.68 | 23 | -0.04% | 5.80% |
| ITOS | iTeos | | Health Care | 11.57 | 85 | -1.78% | 5.76% |
| SGHT | Sight Sciences | | Health Care | 5.46 | 43 | -1.62% | 5.71% |
| BANC | Banc of California | | Financials | 14.20 | 49 | 2.05% | 5.70% |
| STC | Stewart Information | | Financials | 62.09 | 22 | 0.63% | 5.69% |
| IRT | Independence Realty | | Financials | 16.17 | 68 | 2.60% | 5.69% |
| LTC | LTC Properties | | Financials | 33.94 | 100 | 1.31% | 5.67% |
| DJCO | Daily Journal | | Services & Goods | 360.15 | 88 | 1.85% | 5.67% |
| IIIV | i3 Verticals | | Technology | 22.36 | 36 | 0.49% | 5.62% |
| CHRD | Chord Energy | | Energy | 176.22 | 46 | 1.99% | 5.60% |


| Too many stocks? View smallcap stocks filtered by marketcap & sector |
| Marketcap: All SmallCap Stocks (default-no microcap), Large, Mid-Range, Small |
| Smallcap Sector: Tech, Finance, Energy, Staples, Retail, Industrial, Materials, & Medical |
|
Get the most comprehensive stock market coverage daily at 12Stocks.com ➞ Best Stocks Today ➞ Best Stocks Weekly ➞ Best Stocks Year-to-Date ➞ Best Stocks Trends ➞  Best Stocks Today 12Stocks.com Best Nasdaq Stocks ➞ Best S&P 500 Stocks ➞ Best Tech Stocks ➞ Best Biotech Stocks ➞ |
| Detailed Overview of SmallCap Stocks |
| SmallCap Technical Overview, Leaders & Laggards, Top SmallCap ETF Funds & Detailed SmallCap Stocks List, Charts, Trends & More |
| Smallcap: Technical Analysis, Trends & YTD Performance | |
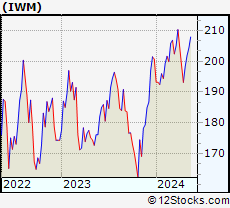
| SmallCap segment as represented by
IWM, an exchange-traded fund [ETF], holds basket of thousands of smallcap stocks from across all major sectors of the US stock market. The smallcap index (contains stocks like Riverbed & Sotheby's) is down by -0.42% and is currently underperforming the overall market by -6.01% year-to-date. Below is a quick view of technical charts and trends: | |
 IWM Weekly Chart |
|
| Long Term Trend: Not Good | |
| Medium Term Trend: Not Good | |
 IWM Daily Chart |
|
| Short Term Trend: Deteriorating | |
| Overall Trend Score: 39 | |
| YTD Performance: -0.42% | |
| **Trend Scores & Views Are Only For Educational Purposes And Not For Investing | |
| 12Stocks.com: Top Performing Small Cap Index Stocks | ||||||||||||||||||||||||||||||||||||||||||||||||
 The top performing Small Cap Index stocks year to date are
Now, more recently, over last week, the top performing Small Cap Index stocks on the move are


|
||||||||||||||||||||||||||||||||||||||||||||||||
| 12Stocks.com: Investing in Smallcap Index using Exchange Traded Funds | |
|
The following table shows list of key exchange traded funds (ETF) that
help investors track Smallcap index. The following list also includes leveraged ETF funds that track twice or thrice the daily returns of Smallcap indices. Short or inverse ETF funds move in the opposite direction to the index they track and are useful during market pullbacks or during bear markets. Quick View: Move mouse or cursor over ETF symbol (ticker) to view short-term technical chart and over ETF name to view long term chart. Click on ticker or stock name for detailed view. Click on to add stock symbol to your watchlist and to view watchlist. |
12Stocks.com List of ETFs that track Smallcap Index
| Ticker | ETF Name | Watchlist | Recent Price | Smart Investing & Trading Score | Change % | Week % | Year-to-date % |
| IWM | iShares Russell 2000 | | 199.87 | 39 | 1.81 | 0.75 | -0.42% |
| IJR | iShares Core S&P Small-Cap | | 106.30 | 50 | 1.49 | 0.62 | -1.8% |
| VTWO | Vanguard Russell 2000 ETF | | 80.62 | 7 | 1.59 | 0.5 | -0.59% |
| IWN | iShares Russell 2000 Value | | 152.63 | 50 | 1.87 | 0.98 | -1.74% |
| IWO | iShares Russell 2000 Growth | | 253.75 | 17 | 1.67 | 0.26 | 0.61% |
| IJS | iShares S&P Small-Cap 600 Value | | 97.92 | 13 | 1.58 | 0.75 | -5% |
| IJT | iShares S&P Small-Cap 600 Growth | | 126.18 | 20 | 0.99 | 0.07 | 0.83% |
| XSLV | PowerShares S&P SmallCap Low Volatil ETF | | 43.15 | 42 | 0.75 | 1.01 | -2.27% |
| SDD | ProShares UltraShort SmallCap600 | | 19.31 | 61 | -2.02 | -0.21 | 4.79% |
| SAA | ProShares Ultra SmallCap600 | | 22.93 | 25 | 1.56 | -0.46 | -8.08% |
| SMLV | SPDR SSGA US Small Cap Low Volatil ETF | | 108.63 | 30 | 1.11 | 1.04 | -3.45% |
| SBB | ProShares Short SmallCap600 | | 16.56 | 71 | 0.00 | 1.06 | 3.94% |
| 12Stocks.com: Charts, Trends, Fundamental Data and Performances of SmallCap Stocks | |
|
We now take in-depth look at all SmallCap stocks including charts, multi-period performances and overall trends (as measured by Smart Investing & Trading Score). One can sort SmallCap stocks (click link to choose) by Daily, Weekly and by Year-to-Date performances. Also, one can sort by size of the company or by market capitalization. |
| Select Your Default Chart Type: | |||||
| |||||
| Click on stock symbol or name for detailed view. Click on to add stock symbol to your watchlist and to view watchlist. Quick View: Move mouse or cursor over "Daily" to quickly view daily technical stock chart and over "Weekly" to view weekly technical stock chart. | |||||

 | PHAT Phathom Pharmaceuticals, Inc. |
| Sector: Health Care | |
| SubSector: Biotechnology | |
| MarketCap: 728.785 Millions | |
| Recent Price: 9.71 Smart Investing & Trading Score: 44 | |
| Day Percent Change: 4.91% Day Change: 0.46 | |
| Week Change: 5.83% Year-to-date Change: 6.4% | |
| PHAT Links: Profile News Message Board | |
| Charts:- Daily , Weekly | |
| Add PHAT to Watchlist: View: Get Complete PHAT Trend Analysis ➞ | |
 | MTSI MACOM Technology Solutions Holdings, Inc. |
| Sector: Technology | |
| SubSector: Semiconductor - Broad Line | |
| MarketCap: 1214.42 Millions | |
| Recent Price: 98.88 Smart Investing & Trading Score: 33 | |
| Day Percent Change: -0.24% Day Change: -0.24 | |
| Week Change: -2.78% Year-to-date Change: 6.4% | |
| MTSI Links: Profile News Message Board | |
| Charts:- Daily , Weekly | |
| Add MTSI to Watchlist: View: Get Complete MTSI Trend Analysis ➞ | |
 | NR Newpark Resources, Inc. |
| Sector: Energy | |
| SubSector: Oil & Gas Equipment & Services | |
| MarketCap: 109.261 Millions | |
| Recent Price: 7.06 Smart Investing & Trading Score: 36 | |
| Day Percent Change: 1.88% Day Change: 0.13 | |
| Week Change: -2.89% Year-to-date Change: 6.3% | |
| NR Links: Profile News Message Board | |
| Charts:- Daily , Weekly | |
| Add NR to Watchlist: View: Get Complete NR Trend Analysis ➞ | |
 | AVD American Vanguard Corporation |
| Sector: Materials | |
| SubSector: Agricultural Chemicals | |
| MarketCap: 419.329 Millions | |
| Recent Price: 11.66 Smart Investing & Trading Score: 83 | |
| Day Percent Change: -0.26% Day Change: -0.03 | |
| Week Change: 1.66% Year-to-date Change: 6.3% | |
| AVD Links: Profile News Message Board | |
| Charts:- Daily , Weekly | |
| Add AVD to Watchlist: View: Get Complete AVD Trend Analysis ➞ | |
 | FSS Federal Signal Corporation |
| Sector: Industrials | |
| SubSector: Pollution & Treatment Controls | |
| MarketCap: 1694.05 Millions | |
| Recent Price: 81.52 Smart Investing & Trading Score: 13 | |
| Day Percent Change: 1.47% Day Change: 1.18 | |
| Week Change: -2.81% Year-to-date Change: 6.2% | |
| FSS Links: Profile News Message Board | |
| Charts:- Daily , Weekly | |
| Add FSS to Watchlist: View: Get Complete FSS Trend Analysis ➞ | |
 | GTLS Chart Industries, Inc. |
| Sector: Industrials | |
| SubSector: Metal Fabrication | |
| MarketCap: 751.15 Millions | |
| Recent Price: 144.79 Smart Investing & Trading Score: 46 | |
| Day Percent Change: -0.14% Day Change: -0.20 | |
| Week Change: -3.47% Year-to-date Change: 6.2% | |
| GTLS Links: Profile News Message Board | |
| Charts:- Daily , Weekly | |
| Add GTLS to Watchlist: View: Get Complete GTLS Trend Analysis ➞ | |
 | BHR Braemar Hotels & Resorts, Inc. |
| Sector: Financials | |
| SubSector: REIT - Hotel/Motel | |
| MarketCap: 88.9434 Millions | |
| Recent Price: 2.65 Smart Investing & Trading Score: 61 | |
| Day Percent Change: -1.30% Day Change: -0.04 | |
| Week Change: -4.84% Year-to-date Change: 6.2% | |
| BHR Links: Profile News Message Board | |
| Charts:- Daily , Weekly | |
| Add BHR to Watchlist: View: Get Complete BHR Trend Analysis ➞ | |
 | DBI Designer Brands Inc. |
| Sector: Services & Goods | |
| SubSector: Apparel Stores | |
| MarketCap: 467.308 Millions | |
| Recent Price: 9.39 Smart Investing & Trading Score: 22 | |
| Day Percent Change: 2.23% Day Change: 0.21 | |
| Week Change: -2.74% Year-to-date Change: 6.2% | |
| DBI Links: Profile News Message Board | |
| Charts:- Daily , Weekly | |
| Add DBI to Watchlist: View: Get Complete DBI Trend Analysis ➞ | |
 | GRBK Green Brick Partners, Inc. |
| Sector: Financials | |
| SubSector: Real Estate Development | |
| MarketCap: 341.819 Millions | |
| Recent Price: 55.09 Smart Investing & Trading Score: 17 | |
| Day Percent Change: 0.07% Day Change: 0.04 | |
| Week Change: -0.9% Year-to-date Change: 6.1% | |
| GRBK Links: Profile News Message Board | |
| Charts:- Daily , Weekly | |
| Add GRBK to Watchlist: View: Get Complete GRBK Trend Analysis ➞ | |
 | NGVC Natural Grocers by Vitamin Cottage, Inc. |
| Sector: Services & Goods | |
| SubSector: Grocery Stores | |
| MarketCap: 185.475 Millions | |
| Recent Price: 16.97 Smart Investing & Trading Score: 52 | |
| Day Percent Change: 2.69% Day Change: 0.45 | |
| Week Change: 0.5% Year-to-date Change: 6.0% | |
| NGVC Links: Profile News Message Board | |
| Charts:- Daily , Weekly | |
| Add NGVC to Watchlist: View: Get Complete NGVC Trend Analysis ➞ | |
 | LYTS LSI Industries Inc. |
| Sector: Industrials | |
| SubSector: Industrial Electrical Equipment | |
| MarketCap: 85.7879 Millions | |
| Recent Price: 14.92 Smart Investing & Trading Score: 48 | |
| Day Percent Change: 1.36% Day Change: 0.20 | |
| Week Change: 1.02% Year-to-date Change: 6.0% | |
| LYTS Links: Profile News Message Board | |
| Charts:- Daily , Weekly | |
| Add LYTS to Watchlist: View: Get Complete LYTS Trend Analysis ➞ | |
 | KBH KB Home |
| Sector: Industrials | |
| SubSector: Residential Construction | |
| MarketCap: 1249.66 Millions | |
| Recent Price: 66.18 Smart Investing & Trading Score: 52 | |
| Day Percent Change: 0.82% Day Change: 0.54 | |
| Week Change: 0.88% Year-to-date Change: 6.0% | |
| KBH Links: Profile News Message Board | |
| Charts:- Daily , Weekly | |
| Add KBH to Watchlist: View: Get Complete KBH Trend Analysis ➞ | |
 | MYRG MYR Group Inc. |
| Sector: Industrials | |
| SubSector: General Contractors | |
| MarketCap: 405.363 Millions | |
| Recent Price: 153.22 Smart Investing & Trading Score: 0 | |
| Day Percent Change: -7.03% Day Change: -11.59 | |
| Week Change: -8.88% Year-to-date Change: 5.9% | |
| MYRG Links: Profile News Message Board | |
| Charts:- Daily , Weekly | |
| Add MYRG to Watchlist: View: Get Complete MYRG Trend Analysis ➞ | |
 | VMD Viemed Healthcare, Inc. |
| Sector: Health Care | |
| SubSector: Medical Appliances & Equipment | |
| MarketCap: 177.28 Millions | |
| Recent Price: 8.31 Smart Investing & Trading Score: 54 | |
| Day Percent Change: -0.48% Day Change: -0.04 | |
| Week Change: 0% Year-to-date Change: 5.9% | |
| VMD Links: Profile News Message Board | |
| Charts:- Daily , Weekly | |
| Add VMD to Watchlist: View: Get Complete VMD Trend Analysis ➞ | |
 | OII Oceaneering International, Inc. |
| Sector: Energy | |
| SubSector: Oil & Gas Equipment & Services | |
| MarketCap: 324.061 Millions | |
| Recent Price: 22.52 Smart Investing & Trading Score: 33 | |
| Day Percent Change: 1.35% Day Change: 0.30 | |
| Week Change: -9.56% Year-to-date Change: 5.8% | |
| OII Links: Profile News Message Board | |
| Charts:- Daily , Weekly | |
| Add OII to Watchlist: View: Get Complete OII Trend Analysis ➞ | |
 | FCFS FirstCash, Inc. |
| Sector: Financials | |
| SubSector: Credit Services | |
| MarketCap: 2795.48 Millions | |
| Recent Price: 114.68 Smart Investing & Trading Score: 23 | |
| Day Percent Change: -0.04% Day Change: -0.05 | |
| Week Change: -0.89% Year-to-date Change: 5.8% | |
| FCFS Links: Profile News Message Board | |
| Charts:- Daily , Weekly | |
| Add FCFS to Watchlist: View: Get Complete FCFS Trend Analysis ➞ | |
 | ITOS iTeos Therapeutics, Inc. |
| Sector: Health Care | |
| SubSector: Biotechnology | |
| MarketCap: 10487 Millions | |
| Recent Price: 11.57 Smart Investing & Trading Score: 85 | |
| Day Percent Change: -1.78% Day Change: -0.21 | |
| Week Change: 7.13% Year-to-date Change: 5.8% | |
| ITOS Links: Profile News Message Board | |
| Charts:- Daily , Weekly | |
| Add ITOS to Watchlist: View: Get Complete ITOS Trend Analysis ➞ | |
 | SGHT Sight Sciences, Inc. |
| Sector: Health Care | |
| SubSector: Medical Devices | |
| MarketCap: 381 Millions | |
| Recent Price: 5.46 Smart Investing & Trading Score: 43 | |
| Day Percent Change: -1.62% Day Change: -0.09 | |
| Week Change: 3.41% Year-to-date Change: 5.7% | |
| SGHT Links: Profile News Message Board | |
| Charts:- Daily , Weekly | |
| Add SGHT to Watchlist: View: Get Complete SGHT Trend Analysis ➞ | |
 | BANC Banc of California, Inc. |
| Sector: Financials | |
| SubSector: Regional - Pacific Banks | |
| MarketCap: 459.929 Millions | |
| Recent Price: 14.20 Smart Investing & Trading Score: 49 | |
| Day Percent Change: 2.05% Day Change: 0.29 | |
| Week Change: -0.87% Year-to-date Change: 5.7% | |
| BANC Links: Profile News Message Board | |
| Charts:- Daily , Weekly | |
| Add BANC to Watchlist: View: Get Complete BANC Trend Analysis ➞ | |
 | STC Stewart Information Services Corporation |
| Sector: Financials | |
| SubSector: Property & Casualty Insurance | |
| MarketCap: 629.912 Millions | |
| Recent Price: 62.09 Smart Investing & Trading Score: 22 | |
| Day Percent Change: 0.63% Day Change: 0.39 | |
| Week Change: -0.58% Year-to-date Change: 5.7% | |
| STC Links: Profile News Message Board | |
| Charts:- Daily , Weekly | |
| Add STC to Watchlist: View: Get Complete STC Trend Analysis ➞ | |
 | IRT Independence Realty Trust, Inc. |
| Sector: Financials | |
| SubSector: REIT - Residential | |
| MarketCap: 980.161 Millions | |
| Recent Price: 16.17 Smart Investing & Trading Score: 68 | |
| Day Percent Change: 2.60% Day Change: 0.41 | |
| Week Change: 1.95% Year-to-date Change: 5.7% | |
| IRT Links: Profile News Message Board | |
| Charts:- Daily , Weekly | |
| Add IRT to Watchlist: View: Get Complete IRT Trend Analysis ➞ | |
 | LTC LTC Properties, Inc. |
| Sector: Financials | |
| SubSector: REIT - Healthcare Facilities | |
| MarketCap: 1369.24 Millions | |
| Recent Price: 33.94 Smart Investing & Trading Score: 100 | |
| Day Percent Change: 1.31% Day Change: 0.44 | |
| Week Change: 4.24% Year-to-date Change: 5.7% | |
| LTC Links: Profile News Message Board | |
| Charts:- Daily , Weekly | |
| Add LTC to Watchlist: View: Get Complete LTC Trend Analysis ➞ | |
 | DJCO Daily Journal Corporation |
| Sector: Services & Goods | |
| SubSector: Publishing - Newspapers | |
| MarketCap: 306.822 Millions | |
| Recent Price: 360.15 Smart Investing & Trading Score: 88 | |
| Day Percent Change: 1.85% Day Change: 6.55 | |
| Week Change: 3.85% Year-to-date Change: 5.7% | |
| DJCO Links: Profile News Message Board | |
| Charts:- Daily , Weekly | |
| Add DJCO to Watchlist: View: Get Complete DJCO Trend Analysis ➞ | |
 | IIIV i3 Verticals, Inc. |
| Sector: Technology | |
| SubSector: Business Software & Services | |
| MarketCap: 448.458 Millions | |
| Recent Price: 22.36 Smart Investing & Trading Score: 36 | |
| Day Percent Change: 0.49% Day Change: 0.11 | |
| Week Change: -3.2% Year-to-date Change: 5.6% | |
| IIIV Links: Profile News Message Board | |
| Charts:- Daily , Weekly | |
| Add IIIV to Watchlist: View: Get Complete IIIV Trend Analysis ➞ | |
 | CHRD Chord Energy Corporation |
| Sector: Energy | |
| SubSector: Oil & Gas E&P | |
| MarketCap: 6280 Millions | |
| Recent Price: 176.22 Smart Investing & Trading Score: 46 | |
| Day Percent Change: 1.99% Day Change: 3.44 | |
| Week Change: -5.08% Year-to-date Change: 5.6% | |
| CHRD Links: Profile News Message Board | |
| Charts:- Daily , Weekly | |
| Add CHRD to Watchlist: View: Get Complete CHRD Trend Analysis ➞ | |
| Too many stocks? View smallcap stocks filtered by marketcap & sector |
| Marketcap: All SmallCap Stocks (default-no microcap), Large, Mid-Range, Small & MicroCap |
| Sector: Tech, Finance, Energy, Staples, Retail, Industrial, Materials, Utilities & Medical |
|
Best Stocks Today 12Stocks.com |
© 2024 12Stocks.com Terms & Conditions Privacy Contact Us
All Information Provided Only For Education And Not To Be Used For Investing or Trading. See Terms & Conditions


One More Thing ... Get Best Stocks Delivered Daily!
Never Ever Miss A Move With Our Top Ten Stocks Lists
Find Best Stocks In Any Market - Bull or Bear Market
Take A Peek At Our Top Ten Stocks Lists: Daily, Weekly, Year-to-Date & Top Trends
Find Best Stocks In Any Market - Bull or Bear Market
Take A Peek At Our Top Ten Stocks Lists: Daily, Weekly, Year-to-Date & Top Trends
Smallcap Stocks With Best Up Trends [0-bearish to 100-bullish]: Emergent BioSolutions[100], Aspen Aerogels[100], Perdoceo Education[100], Gannett Co[100], Pitney Bowes[100], Origin Materials[100], Benchmark Electronics[100], Blueprint Medicines[100], FormFactor [100], Lantheus [100], Tronox [100]
Best Smallcap Stocks Year-to-Date:
Janux [440.16%], Viking [306.07%], Longboard [258.92%], Alpine Immune[239.44%], Bakkt [187.89%], Avidity Biosciences[184.07%], Arcutis Bio[171.83%], Vera [170.74%], Cullinan Oncology[169.74%], Super Micro[159.59%], Y-mAbs [153.08%] Best Smallcap Stocks This Week:
Deciphera [73.24%], Emergent BioSolutions[69.53%], Aspen Aerogels[47.24%], Eyenovia [45.27%], P3 Health[38.51%], Carvana Co[37.82%], Origin Materials[36.24%], Poseida [34.98%], Cue Biopharma[34.07%], Surmodics [33.44%], TransMedics Group[33.23%] Best Smallcap Stocks Daily:
Emergent BioSolutions[68.65%], Aspen Aerogels[55.75%], Carvana Co[33.42%], Enovix [31.06%], Perdoceo Education[28.82%], Office Properties[28.50%], Gannett Co[26.14%], Pitney Bowes[23.99%], Sunnova Energy[23.23%], Pulmonx [20.21%], CommScope Holding[19.80%]