
 Login Sign Up


| |||||
 |  | ||||

| 12Stocks.com Market Intelligence |
Best Tech Stocks
| In a hurry? Tech Stocks Lists: Performance & Trends, Stock Charts, FANG Stocks
Sort Tech stocks: Daily, Weekly, Year-to-Date, Market Cap & Trends. Filter Tech stocks list by size:All Tech Large Mid-Range Small and MicroCap |
| 12Stocks.com Tech Stocks Performances & Trends Daily | |||||||||
|
|  The overall Smart Investing & Trading Score is 58 (0-bearish to 100-bullish) which puts Technology sector in short term neutral trend. The Smart Investing & Trading Score from previous trading session is 38 and hence an improvement of trend.
| ||||||||
Here are the Smart Investing & Trading Scores of the most requested Technology stocks at 12Stocks.com (click stock name for detailed review):
|


| 12Stocks.com: Investing in Technology sector with Stocks | |
|
The following table helps investors and traders sort through current performance and trends (as measured by Smart Investing & Trading Score) of various
stocks in the Tech sector. Quick View: Move mouse or cursor over stock symbol (ticker) to view short-term technical chart and over stock name to view long term chart. Click on  to add stock symbol to your watchlist and to add stock symbol to your watchlist and  to view watchlist. Click on any ticker or stock name for detailed market intelligence report for that stock. to view watchlist. Click on any ticker or stock name for detailed market intelligence report for that stock. |
12Stocks.com Performance of Stocks in Tech Sector
| Ticker | Stock Name | Watchlist | Category | Recent Price | Smart Investing & Trading Score | Change % | Weekly Change% |
| MSFT | Microsoft |   | Software | 406.32 | 51 | 1.82% | 1.80% |
| ARQQ | Arqit Quantum | | Software - Infrastructure | 0.48 | 68 | 0.10% | 1.80% |
| RAMP | LiveRamp | | IT | 32.64 | 27 | 2.03% | 1.78% |
| VNT | Vontier | | Instruments | 41.09 | 58 | 1.53% | 1.73% |
| NABL | N-able | | IT | 12.40 | 32 | 1.47% | 1.72% |
| EVTC | EVERTEC | | Software | 38.43 | 67 | 0.42% | 1.69% |
| MLNK | MeridianLink | | Software - | 17.50 | 24 | 0.63% | 1.69% |
| TRNS | Transcat | | Instruments | 109.83 | 95 | -0.01% | 1.66% |
| ONTF | ON24 | | Software - | 6.74 | 47 | 1.20% | 1.66% |
| DAKT | Daktronics | | Computer Based | 9.29 | 51 | 0.00% | 1.64% |
| PSFE | Paysafe | | Software - Infrastructure | 14.46 | 42 | -0.28% | 1.62% |
| VICR | Vicor | | Electronics | 34.41 | 17 | 2.78% | 1.59% |
| GSAT | Globalstar | | Wireless | 1.29 | 27 | -0.77% | 1.57% |
| ERIC | Telefonaktiebolaget LM | | Communication | 5.18 | 42 | -1.15% | 1.57% |
| UI | Ubiquiti | | Communication | 108.30 | 42 | 0.44% | 1.53% |
| AGYS | Agilysys | | Software | 83.00 | 87 | -0.54% | 1.49% |
| UEIC | Universal Electronics | | Electronic | 10.23 | 43 | 5.36% | 1.49% |
| BRC | Brady | | Security Software | 59.52 | 57 | -0.80% | 1.48% |
| ALTR | Altair Engineering | | Semiconductor | 83.58 | 42 | 0.49% | 1.48% |
| YEXT | Yext | | Internet | 5.54 | 7 | 2.21% | 1.47% |
| T | AT&T | | Telecom | 16.75 | 47 | 1.03% | 1.45% |
| CRM | salesforce.com | | Software | 274.29 | 25 | 0.42% | 1.45% |
| SCSC | ScanSource | | Software | 41.97 | 93 | 0.17% | 1.43% |
| LYFT | Lyft | | Software | 16.37 | 48 | 2.03% | 1.43% |
| COMM | CommScope Holding | | Communication | 0.94 | 27 | 2.32% | 1.41% |
| For chart view version of above stock list: Chart View ➞ 0 - 25 , 25 - 50 , 50 - 75 , 75 - 100 , 100 - 125 , 125 - 150 , 150 - 175 , 175 - 200 , 200 - 225 , 225 - 250 , 250 - 275 , 275 - 300 , 300 - 325 , 325 - 350 , 350 - 375 , 375 - 400 , 400 - 425 , 425 - 450 , 450 - 475 , 475 - 500 , 500 - 525 , 525 - 550 , 550 - 575 , 575 - 600 , 600 - 625 , 625 - 650 | ||
 | Click To Change The Sort Order: By Market Cap or Company Size Performance: Year-to-date, Week and Day |  |
|
Get the most comprehensive stock market coverage daily at 12Stocks.com ➞ Best Stocks Today ➞ Best Stocks Weekly ➞ Best Stocks Year-to-Date ➞ Best Stocks Trends ➞  Best Stocks Today 12Stocks.com Best Nasdaq Stocks ➞ Best S&P 500 Stocks ➞ Best Tech Stocks ➞ Best Biotech Stocks ➞ |
| Detailed Overview of Tech Stocks |
| Tech Technical Overview, Leaders & Laggards, Top Tech ETF Funds & Detailed Tech Stocks List, Charts, Trends & More |
| Tech Sector: Technical Analysis, Trends & YTD Performance | |
| Technology sector is composed of stocks
from semiconductors, software, web, social media
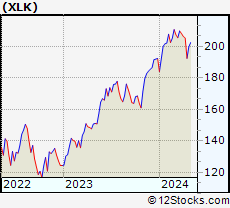
and services subsectors. Technology sector, as represented by XLK, an exchange-traded fund [ETF] that holds basket of tech stocks (e.g, Intel, Google) is up by 3.82% and is currently underperforming the overall market by -2.32% year-to-date. Below is a quick view of technical charts and trends: |
|
 XLK Weekly Chart |
|
| Long Term Trend: Good | |
| Medium Term Trend: Not Good | |
 XLK Daily Chart |
|
| Short Term Trend: Very Good | |
| Overall Trend Score: 58 | |
| YTD Performance: 3.82% | |
| **Trend Scores & Views Are Only For Educational Purposes And Not For Investing | |
| 12Stocks.com: Top Performing Technology Sector Stocks | ||||||||||||||||||||||||||||||||||||||||||||||||
 The top performing Technology sector stocks year to date are
Now, more recently, over last week, the top performing Technology sector stocks on the move are


|
||||||||||||||||||||||||||||||||||||||||||||||||
| 12Stocks.com: Investing in Tech Sector using Exchange Traded Funds | |
|
The following table shows list of key exchange traded funds (ETF) that
help investors track Tech Index. For detailed view, check out our ETF Funds section of our website. Quick View: Move mouse or cursor over ETF symbol (ticker) to view short-term technical chart and over ETF name to view long term chart. Click on ticker or stock name for detailed view. Click on to add stock symbol to your watchlist and to view watchlist. |
12Stocks.com List of ETFs that track Tech Index
| Ticker | ETF Name | Watchlist | Recent Price | Smart Investing & Trading Score | Change % | Week % | Year-to-date % |
| XLK | Technology | | 199.83 | 58 | 1.13 | 3.79 | 3.82% |
| QQQ | QQQ | | 431.00 | 58 | 1.54 | 3.94 | 5.25% |
| IYW | Technology | | 130.95 | 58 | 2.15 | 4.97 | 6.68% |
| VGT | Information Technology | | 503.94 | 45 | 1.72 | 5.01 | 4.12% |
| IXN | Global Tech | | 71.80 | 43 | 1.48 | 4.48 | 5.31% |
| IGV | Tech-Software | | 81.09 | 32 | 1.12 | 3.26 | -0.05% |
| XSD | Semiconductor | | 224.69 | 37 | 1.84 | 10.38 | -0.04% |
| TQQQ | QQQ | | 55.28 | 58 | 4.60 | 11.72 | 9.03% |
| SQQQ | Short QQQ | | 11.43 | 32 | -4.75 | -10.98 | -15.02% |
| SOXL | Semicondct Bull 3X | | 39.75 | 63 | 6.26 | 29.1 | 26.59% |
| SOXS | Semicondct Bear 3X | | 35.10 | 51 | -6.25 | -23.91 | 503.09% |
| SOXX | PHLX Semiconductor | | 216.90 | 65 | 2.11 | 9.33 | 12.95% |
| QTEC | First -100-Tech | | 183.99 | 65 | 1.55 | 5.78 | 4.86% |
| SMH | Semiconductor | | 217.64 | 63 | 2.56 | 9.25 | 24.46% |
| 12Stocks.com: Charts, Trends, Fundamental Data and Performances of Tech Stocks | |
|
We now take in-depth look at all Tech stocks including charts, multi-period performances and overall trends (as measured by Smart Investing & Trading Score). One can sort Tech stocks (click link to choose) by Daily, Weekly and by Year-to-Date performances. Also, one can sort by size of the company or by market capitalization. |
| Select Your Default Chart Type: | |||||
| |||||
| Click on stock symbol or name for detailed view. Click on to add stock symbol to your watchlist and to view watchlist. Quick View: Move mouse or cursor over "Daily" to quickly view daily technical stock chart and over "Weekly" to view weekly technical stock chart. | |||||


 | MSFT Microsoft Corporation |
| Sector: Technology | |
| SubSector: Business Software & Services | |
| MarketCap: 1154150 Millions | |
| Recent Price: 406.32 Smart Investing & Trading Score: 51 | |
| Day Percent Change: 1.82% Day Change: 7.28 | |
| Week Change: 1.8% Year-to-date Change: 8.1% | |
| MSFT Links: Profile News Message Board | |
| Charts:- Daily , Weekly | |
| Add MSFT to Watchlist: View: Get Complete MSFT Trend Analysis ➞ | |
 | ARQQ Arqit Quantum Inc. |
| Sector: Technology | |
| SubSector: Software - Infrastructure | |
| MarketCap: 165 Millions | |
| Recent Price: 0.48 Smart Investing & Trading Score: 68 | |
| Day Percent Change: 0.10% Day Change: 0.00 | |
| Week Change: 1.8% Year-to-date Change: 5.0% | |
| ARQQ Links: Profile News Message Board | |
| Charts:- Daily , Weekly | |
| Add ARQQ to Watchlist: View: Get Complete ARQQ Trend Analysis ➞ | |
 | RAMP LiveRamp Holdings, Inc. |
| Sector: Technology | |
| SubSector: Information Technology Services | |
| MarketCap: 2124.38 Millions | |
| Recent Price: 32.64 Smart Investing & Trading Score: 27 | |
| Day Percent Change: 2.03% Day Change: 0.65 | |
| Week Change: 1.78% Year-to-date Change: -13.8% | |
| RAMP Links: Profile News Message Board | |
| Charts:- Daily , Weekly | |
| Add RAMP to Watchlist: View: Get Complete RAMP Trend Analysis ➞ | |
 | VNT Vontier Corporation |
| Sector: Technology | |
| SubSector: Scientific & Technical Instruments | |
| MarketCap: 53787 Millions | |
| Recent Price: 41.09 Smart Investing & Trading Score: 58 | |
| Day Percent Change: 1.53% Day Change: 0.62 | |
| Week Change: 1.73% Year-to-date Change: 18.9% | |
| VNT Links: Profile News Message Board | |
| Charts:- Daily , Weekly | |
| Add VNT to Watchlist: View: Get Complete VNT Trend Analysis ➞ | |
 | NABL N-able, Inc. |
| Sector: Technology | |
| SubSector: Information Technology Services | |
| MarketCap: 2590 Millions | |
| Recent Price: 12.40 Smart Investing & Trading Score: 32 | |
| Day Percent Change: 1.47% Day Change: 0.18 | |
| Week Change: 1.72% Year-to-date Change: -6.8% | |
| NABL Links: Profile News Message Board | |
| Charts:- Daily , Weekly | |
| Add NABL to Watchlist: View: Get Complete NABL Trend Analysis ➞ | |
 | EVTC EVERTEC, Inc. |
| Sector: Technology | |
| SubSector: Business Software & Services | |
| MarketCap: 1646.08 Millions | |
| Recent Price: 38.43 Smart Investing & Trading Score: 67 | |
| Day Percent Change: 0.42% Day Change: 0.16 | |
| Week Change: 1.69% Year-to-date Change: -6.1% | |
| EVTC Links: Profile News Message Board | |
| Charts:- Daily , Weekly | |
| Add EVTC to Watchlist: View: Get Complete EVTC Trend Analysis ➞ | |
 | MLNK MeridianLink, Inc. |
| Sector: Technology | |
| SubSector: Software - Application | |
| MarketCap: 1630 Millions | |
| Recent Price: 17.50 Smart Investing & Trading Score: 24 | |
| Day Percent Change: 0.63% Day Change: 0.11 | |
| Week Change: 1.69% Year-to-date Change: -29.4% | |
| MLNK Links: Profile News Message Board | |
| Charts:- Daily , Weekly | |
| Add MLNK to Watchlist: View: Get Complete MLNK Trend Analysis ➞ | |
 | TRNS Transcat, Inc. |
| Sector: Technology | |
| SubSector: Scientific & Technical Instruments | |
| MarketCap: 216.653 Millions | |
| Recent Price: 109.83 Smart Investing & Trading Score: 95 | |
| Day Percent Change: -0.01% Day Change: -0.01 | |
| Week Change: 1.66% Year-to-date Change: 0.5% | |
| TRNS Links: Profile News Message Board | |
| Charts:- Daily , Weekly | |
| Add TRNS to Watchlist: View: Get Complete TRNS Trend Analysis ➞ | |
 | ONTF ON24, Inc. |
| Sector: Technology | |
| SubSector: Software - Application | |
| MarketCap: 386 Millions | |
| Recent Price: 6.74 Smart Investing & Trading Score: 47 | |
| Day Percent Change: 1.20% Day Change: 0.08 | |
| Week Change: 1.66% Year-to-date Change: -14.5% | |
| ONTF Links: Profile News Message Board | |
| Charts:- Daily , Weekly | |
| Add ONTF to Watchlist: View: Get Complete ONTF Trend Analysis ➞ | |
 | DAKT Daktronics, Inc. |
| Sector: Technology | |
| SubSector: Computer Based Systems | |
| MarketCap: 223.539 Millions | |
| Recent Price: 9.29 Smart Investing & Trading Score: 51 | |
| Day Percent Change: 0.00% Day Change: 0.00 | |
| Week Change: 1.64% Year-to-date Change: 9.6% | |
| DAKT Links: Profile News Message Board | |
| Charts:- Daily , Weekly | |
| Add DAKT to Watchlist: View: Get Complete DAKT Trend Analysis ➞ | |
 | PSFE Paysafe Limited |
| Sector: Technology | |
| SubSector: Software - Infrastructure | |
| MarketCap: 605 Millions | |
| Recent Price: 14.46 Smart Investing & Trading Score: 42 | |
| Day Percent Change: -0.28% Day Change: -0.04 | |
| Week Change: 1.62% Year-to-date Change: 12.1% | |
| PSFE Links: Profile News Message Board | |
| Charts:- Daily , Weekly | |
| Add PSFE to Watchlist: View: Get Complete PSFE Trend Analysis ➞ | |
 | VICR Vicor Corporation |
| Sector: Technology | |
| SubSector: Diversified Electronics | |
| MarketCap: 1526.76 Millions | |
| Recent Price: 34.41 Smart Investing & Trading Score: 17 | |
| Day Percent Change: 2.78% Day Change: 0.93 | |
| Week Change: 1.59% Year-to-date Change: -23.4% | |
| VICR Links: Profile News Message Board | |
| Charts:- Daily , Weekly | |
| Add VICR to Watchlist: View: Get Complete VICR Trend Analysis ➞ | |
 | GSAT Globalstar, Inc. |
| Sector: Technology | |
| SubSector: Wireless Communications | |
| MarketCap: 485.127 Millions | |
| Recent Price: 1.29 Smart Investing & Trading Score: 27 | |
| Day Percent Change: -0.77% Day Change: -0.01 | |
| Week Change: 1.57% Year-to-date Change: -33.5% | |
| GSAT Links: Profile News Message Board | |
| Charts:- Daily , Weekly | |
| Add GSAT to Watchlist: View: Get Complete GSAT Trend Analysis ➞ | |
 | ERIC Telefonaktiebolaget LM Ericsson (publ) |
| Sector: Technology | |
| SubSector: Communication Equipment | |
| MarketCap: 27041.1 Millions | |
| Recent Price: 5.18 Smart Investing & Trading Score: 42 | |
| Day Percent Change: -1.15% Day Change: -0.06 | |
| Week Change: 1.57% Year-to-date Change: -17.8% | |
| ERIC Links: Profile News Message Board | |
| Charts:- Daily , Weekly | |
| Add ERIC to Watchlist: View: Get Complete ERIC Trend Analysis ➞ | |
 | UI Ubiquiti Inc. |
| Sector: Technology | |
| SubSector: Communication Equipment | |
| MarketCap: 9526.89 Millions | |
| Recent Price: 108.30 Smart Investing & Trading Score: 42 | |
| Day Percent Change: 0.44% Day Change: 0.47 | |
| Week Change: 1.53% Year-to-date Change: -22.4% | |
| UI Links: Profile News Message Board | |
| Charts:- Daily , Weekly | |
| Add UI to Watchlist: View: Get Complete UI Trend Analysis ➞ | |
 | AGYS Agilysys, Inc. |
| Sector: Technology | |
| SubSector: Application Software | |
| MarketCap: 391.862 Millions | |
| Recent Price: 83.00 Smart Investing & Trading Score: 87 | |
| Day Percent Change: -0.54% Day Change: -0.45 | |
| Week Change: 1.49% Year-to-date Change: -2.2% | |
| AGYS Links: Profile News Message Board | |
| Charts:- Daily , Weekly | |
| Add AGYS to Watchlist: View: Get Complete AGYS Trend Analysis ➞ | |
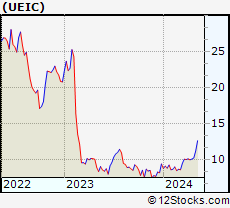 | UEIC Universal Electronics Inc. |
| Sector: Technology | |
| SubSector: Electronic Equipment | |
| MarketCap: 482.7 Millions | |
| Recent Price: 10.23 Smart Investing & Trading Score: 43 | |
| Day Percent Change: 5.36% Day Change: 0.52 | |
| Week Change: 1.49% Year-to-date Change: 9.0% | |
| UEIC Links: Profile News Message Board | |
| Charts:- Daily , Weekly | |
| Add UEIC to Watchlist: View: Get Complete UEIC Trend Analysis ➞ | |
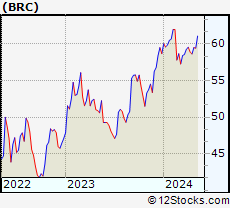 | BRC Brady Corporation |
| Sector: Technology | |
| SubSector: Security Software & Services | |
| MarketCap: 2266.57 Millions | |
| Recent Price: 59.52 Smart Investing & Trading Score: 57 | |
| Day Percent Change: -0.80% Day Change: -0.48 | |
| Week Change: 1.48% Year-to-date Change: 1.4% | |
| BRC Links: Profile News Message Board | |
| Charts:- Daily , Weekly | |
| Add BRC to Watchlist: View: Get Complete BRC Trend Analysis ➞ | |
 | ALTR Altair Engineering Inc. |
| Sector: Technology | |
| SubSector: Semiconductor - Specialized | |
| MarketCap: 2072.2 Millions | |
| Recent Price: 83.58 Smart Investing & Trading Score: 42 | |
| Day Percent Change: 0.49% Day Change: 0.41 | |
| Week Change: 1.48% Year-to-date Change: -0.7% | |
| ALTR Links: Profile News Message Board | |
| Charts:- Daily , Weekly | |
| Add ALTR to Watchlist: View: Get Complete ALTR Trend Analysis ➞ | |
 | YEXT Yext, Inc. |
| Sector: Technology | |
| SubSector: Internet Software & Services | |
| MarketCap: 1414.91 Millions | |
| Recent Price: 5.54 Smart Investing & Trading Score: 7 | |
| Day Percent Change: 2.21% Day Change: 0.12 | |
| Week Change: 1.47% Year-to-date Change: -5.9% | |
| YEXT Links: Profile News Message Board | |
| Charts:- Daily , Weekly | |
| Add YEXT to Watchlist: View: Get Complete YEXT Trend Analysis ➞ | |
 | T AT&T Inc. |
| Sector: Technology | |
| SubSector: Telecom Services - Domestic | |
| MarketCap: 224847 Millions | |
| Recent Price: 16.75 Smart Investing & Trading Score: 47 | |
| Day Percent Change: 1.03% Day Change: 0.17 | |
| Week Change: 1.45% Year-to-date Change: -0.2% | |
| T Links: Profile News Message Board | |
| Charts:- Daily , Weekly | |
| Add T to Watchlist: View: Get Complete T Trend Analysis ➞ | |
 | CRM salesforce.com, inc. |
| Sector: Technology | |
| SubSector: Application Software | |
| MarketCap: 137120 Millions | |
| Recent Price: 274.29 Smart Investing & Trading Score: 25 | |
| Day Percent Change: 0.42% Day Change: 1.15 | |
| Week Change: 1.45% Year-to-date Change: 4.2% | |
| CRM Links: Profile News Message Board | |
| Charts:- Daily , Weekly | |
| Add CRM to Watchlist: View: Get Complete CRM Trend Analysis ➞ | |
 | SCSC ScanSource, Inc. |
| Sector: Technology | |
| SubSector: Technical & System Software | |
| MarketCap: 541 Millions | |
| Recent Price: 41.97 Smart Investing & Trading Score: 93 | |
| Day Percent Change: 0.17% Day Change: 0.07 | |
| Week Change: 1.43% Year-to-date Change: 6.0% | |
| SCSC Links: Profile News Message Board | |
| Charts:- Daily , Weekly | |
| Add SCSC to Watchlist: View: Get Complete SCSC Trend Analysis ➞ | |
 | LYFT Lyft, Inc. |
| Sector: Technology | |
| SubSector: Application Software | |
| MarketCap: 7923.22 Millions | |
| Recent Price: 16.37 Smart Investing & Trading Score: 48 | |
| Day Percent Change: 2.03% Day Change: 0.32 | |
| Week Change: 1.43% Year-to-date Change: 9.2% | |
| LYFT Links: Profile News Message Board | |
| Charts:- Daily , Weekly | |
| Add LYFT to Watchlist: View: Get Complete LYFT Trend Analysis ➞ | |
 | COMM CommScope Holding Company, Inc. |
| Sector: Technology | |
| SubSector: Communication Equipment | |
| MarketCap: 1614.29 Millions | |
| Recent Price: 0.94 Smart Investing & Trading Score: 27 | |
| Day Percent Change: 2.32% Day Change: 0.02 | |
| Week Change: 1.41% Year-to-date Change: -66.8% | |
| COMM Links: Profile News Message Board | |
| Charts:- Daily , Weekly | |
| Add COMM to Watchlist: View: Get Complete COMM Trend Analysis ➞ | |
| For tabular summary view of above stock list: Summary View ➞ 0 - 25 , 25 - 50 , 50 - 75 , 75 - 100 , 100 - 125 , 125 - 150 , 150 - 175 , 175 - 200 , 200 - 225 , 225 - 250 , 250 - 275 , 275 - 300 , 300 - 325 , 325 - 350 , 350 - 375 , 375 - 400 , 400 - 425 , 425 - 450 , 450 - 475 , 475 - 500 , 500 - 525 , 525 - 550 , 550 - 575 , 575 - 600 , 600 - 625 , 625 - 650 | ||
| Click To Change The Sort Order: By Market Cap or Company Size Performance: Year-to-date, Week and Day | |
| Select Chart Type: | ||
|
Best Stocks Today 12Stocks.com |
© 2024 12Stocks.com Terms & Conditions Privacy Contact Us
All Information Provided Only For Education And Not To Be Used For Investing or Trading. See Terms & Conditions


One More Thing ... Get Best Stocks Delivered Daily!
Never Ever Miss A Move With Our Top Ten Stocks Lists
Find Best Stocks In Any Market - Bull or Bear Market
Take A Peek At Our Top Ten Stocks Lists: Daily, Weekly, Year-to-Date & Top Trends
Find Best Stocks In Any Market - Bull or Bear Market
Take A Peek At Our Top Ten Stocks Lists: Daily, Weekly, Year-to-Date & Top Trends
Technology Stocks With Best Up Trends [0-bearish to 100-bullish]: NextNav [100], Alphabet [100], WiMi Hologram[100], Alphabet [100], Amesite [100], JD.com [100], ZoomInfo [100], KLA [100], Teradyne [100], Full Truck[100], Allegro MicroSystems[100]
Best Technology Stocks Year-to-Date:
MediaCo Holding[292.02%], Super Micro[201.64%], CXApp [185.71%], Smith Micro[180.87%], Uxin [159.63%], CuriosityStream [109.22%], NextNav [106.52%], SoundHound AI[105.84%], MicroStrategy [103.03%], GigaCloud [93.17%], Cheetah Mobile[86.84%] Best Technology Stocks This Week:
Matterport [170.98%], Amesite [69.2%], WiMi Hologram[46.93%], HashiCorp [36.05%], Snap [30.38%], Impinj [29.74%], IonQ [26.52%], Vacasa [25.96%], SoundHound AI[24.08%], GDS [22.78%], on [22.71%] Best Technology Stocks Daily:
Snap [27.63%], Maxeon Solar[20.17%], Ouster [19.68%], OptimizeRx [14.84%], AppFolio [12.05%], NextNav [11.19%], Mynaric AG[10.61%], Rogers [10.49%], Stem [10.24%], Alphabet [10.22%], PowerFleet [10.11%]