
 Login Sign Up


| |||||
 |  | ||||

| 12Stocks.com Market Intelligence |
Best Tech Stocks
| In a hurry? Tech Stocks Lists: Performance & Trends, Stock Charts, FANG Stocks
Sort Tech stocks: Daily, Weekly, Year-to-Date, Market Cap & Trends. Filter Tech stocks list by size:All Tech Large Mid-Range Small and MicroCap |
| 12Stocks.com Tech Stocks Performances & Trends Daily | |||||||||
|
|  The overall Smart Investing & Trading Score is 13 (0-bearish to 100-bullish) which puts Technology sector in short term bearish trend. The Smart Investing & Trading Score from previous trading session is 26 and a deterioration of trend continues.
| ||||||||
Here are the Smart Investing & Trading Scores of the most requested Technology stocks at 12Stocks.com (click stock name for detailed review):
|


| 12Stocks.com: Investing in Technology sector with Stocks | |
|
The following table helps investors and traders sort through current performance and trends (as measured by Smart Investing & Trading Score) of various
stocks in the Tech sector. Quick View: Move mouse or cursor over stock symbol (ticker) to view short-term technical chart and over stock name to view long term chart. Click on  to add stock symbol to your watchlist and to add stock symbol to your watchlist and  to view watchlist. Click on any ticker or stock name for detailed market intelligence report for that stock. to view watchlist. Click on any ticker or stock name for detailed market intelligence report for that stock. |
12Stocks.com Performance of Stocks in Tech Sector
| Ticker | Stock Name | Watchlist | Category | Recent Price | Smart Investing & Trading Score | Change % | Weekly Change% |
| WKME | WalkMe |   | Software - | 7.78 | 20 | -0.51% | -1.89% |
| ATEN | A10 Networks | | Communication | 12.85 | 28 | 0.39% | -1.91% |
| ITI | Iteris | | Communication | 4.60 | 25 | -0.86% | -1.92% |
| AFRM | Affirm | | Software - Infrastructure | 32.00 | 42 | 3.64% | -1.92% |
| CGNT | Cognyte Software | | Software - Infrastructure | 6.60 | 20 | -0.60% | -1.93% |
| QMCO | Quantum | | Data Storage | 0.46 | 56 | 12.20% | -1.94% |
| NFLX | Netflix | | CATV | 610.62 | 41 | -0.50% | -1.96% |
| BIDU | Baidu | | Internet | 95.63 | 17 | 1.29% | -1.96% |
| CCCS | CCC Intelligent | | Software - Infrastructure | 11.48 | 43 | 0.44% | -1.96% |
| META | Meta Platforms | | Internet Content & Information | 501.84 | 78 | 1.55% | -1.97% |
| DDOG | Datadog | | Software | 125.00 | 26 | 1.17% | -1.97% |
| ESTC | Elastic N.V | | Software | 95.31 | 15 | 0.74% | -1.98% |
| BASE | Couchbase | | Software - Infrastructure | 24.18 | 25 | 1.38% | -1.99% |
| KT | KT | | Telecom | 12.17 | 10 | 0.41% | -2.01% |
| ROKU | Roku | | CATV | 58.69 | 27 | 1.91% | -2.02% |
| STX | Seagate | | Data Storage | 83.45 | 18 | -0.89% | -2.04% |
| INTU | Intuit | | Software | 608.35 | 18 | -0.79% | -2.05% |
| CLS | Celestica | | Circuit Boards | 43.81 | 31 | -1.82% | -2.08% |
| HUBS | HubSpot | | Software | 649.58 | 78 | 2.55% | -2.08% |
| CHKP | Check Point | | Security Software | 158.35 | 45 | 0.16% | -2.09% |
| TWKS | Thoughtworks Holding | | IT | 2.34 | 52 | 4.00% | -2.09% |
| IRM | Iron Mountain | | Software | 74.42 | 51 | -0.97% | -2.10% |
| TTGT | TechTarget | | Internet | 27.30 | 35 | -0.47% | -2.12% |
| OTEX | Open Text | | Software | 34.76 | 25 | 0.46% | -2.14% |
| UIS | Unisys | | IT | 5.49 | 57 | -0.72% | -2.14% |
| For chart view version of above stock list: Chart View ➞ 0 - 25 , 25 - 50 , 50 - 75 , 75 - 100 , 100 - 125 , 125 - 150 , 150 - 175 , 175 - 200 , 200 - 225 , 225 - 250 , 250 - 275 , 275 - 300 , 300 - 325 , 325 - 350 , 350 - 375 , 375 - 400 , 400 - 425 , 425 - 450 , 450 - 475 , 475 - 500 , 500 - 525 , 525 - 550 , 550 - 575 , 575 - 600 , 600 - 625 , 625 - 650 | ||
 | Click To Change The Sort Order: By Market Cap or Company Size Performance: Year-to-date, Week and Day |  |
|
Get the most comprehensive stock market coverage daily at 12Stocks.com ➞ Best Stocks Today ➞ Best Stocks Weekly ➞ Best Stocks Year-to-Date ➞ Best Stocks Trends ➞  Best Stocks Today 12Stocks.com Best Nasdaq Stocks ➞ Best S&P 500 Stocks ➞ Best Tech Stocks ➞ Best Biotech Stocks ➞ |
| Detailed Overview of Tech Stocks |
| Tech Technical Overview, Leaders & Laggards, Top Tech ETF Funds & Detailed Tech Stocks List, Charts, Trends & More |
| Tech Sector: Technical Analysis, Trends & YTD Performance | |
| Technology sector is composed of stocks
from semiconductors, software, web, social media
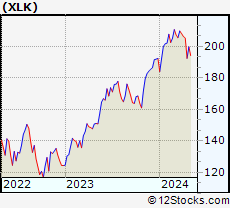
and services subsectors. Technology sector, as represented by XLK, an exchange-traded fund [ETF] that holds basket of tech stocks (e.g, Intel, Google) is up by 2.13% and is currently underperforming the overall market by -2.06% year-to-date. Below is a quick view of technical charts and trends: |
|
 XLK Weekly Chart |
|
| Long Term Trend: Not Good | |
| Medium Term Trend: Not Good | |
 XLK Daily Chart |
|
| Short Term Trend: Not Good | |
| Overall Trend Score: 13 | |
| YTD Performance: 2.13% | |
| **Trend Scores & Views Are Only For Educational Purposes And Not For Investing | |
| 12Stocks.com: Top Performing Technology Sector Stocks | ||||||||||||||||||||||||||||||||||||||||||||||||
 The top performing Technology sector stocks year to date are
Now, more recently, over last week, the top performing Technology sector stocks on the move are


|
||||||||||||||||||||||||||||||||||||||||||||||||
| 12Stocks.com: Investing in Tech Sector using Exchange Traded Funds | |
|
The following table shows list of key exchange traded funds (ETF) that
help investors track Tech Index. For detailed view, check out our ETF Funds section of our website. Quick View: Move mouse or cursor over ETF symbol (ticker) to view short-term technical chart and over ETF name to view long term chart. Click on ticker or stock name for detailed view. Click on to add stock symbol to your watchlist and to view watchlist. |
12Stocks.com List of ETFs that track Tech Index
| Ticker | ETF Name | Watchlist | Recent Price | Smart Investing & Trading Score | Change % | Week % | Year-to-date % |
| XLK | Technology | | 196.58 | 13 | -1.14 | -4.3 | 2.13% |
| QQQ | QQQ | | 423.38 | 26 | -0.58 | -3.4 | 3.39% |
| IYW | Technology | | 128.41 | 26 | -0.72 | -4.14 | 4.61% |
| VGT | Information Technology | | 492.97 | 13 | -0.95 | -4.22 | 1.85% |
| IXN | Global Tech | | 70.59 | 36 | -1.01 | -4.35 | 3.53% |
| IGV | Tech-Software | | 79.50 | 10 | -0.70 | -3.94 | -2.01% |
| XSD | Semiconductor | | 210.17 | 36 | -1.99 | -5.82 | -6.5% |
| TQQQ | QQQ | | 52.74 | 13 | -1.81 | -10.18 | 4.02% |
| SQQQ | Short QQQ | | 12.10 | 69 | 1.98 | 11.07 | -10.07% |
| SOXL | Semicondct Bull 3X | | 34.91 | 26 | -5.80 | -15.9 | 11.18% |
| SOXS | Semicondct Bear 3X | | 41.27 | 90 | 5.42 | 1072.44 | 609.11% |
| SOXX | PHLX Semiconductor | | 206.54 | 26 | -1.82 | -5.29 | 7.55% |
| QTEC | First -100-Tech | | 178.13 | 13 | -0.89 | -4.24 | 1.51% |
| SMH | Semiconductor | | 208.68 | 26 | -1.75 | -5.44 | 19.33% |
| 12Stocks.com: Charts, Trends, Fundamental Data and Performances of Tech Stocks | |
|
We now take in-depth look at all Tech stocks including charts, multi-period performances and overall trends (as measured by Smart Investing & Trading Score). One can sort Tech stocks (click link to choose) by Daily, Weekly and by Year-to-Date performances. Also, one can sort by size of the company or by market capitalization. |
| Select Your Default Chart Type: | |||||
| |||||
| Click on stock symbol or name for detailed view. Click on to add stock symbol to your watchlist and to view watchlist. Quick View: Move mouse or cursor over "Daily" to quickly view daily technical stock chart and over "Weekly" to view weekly technical stock chart. | |||||


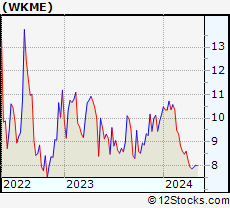 | WKME WalkMe Ltd. |
| Sector: Technology | |
| SubSector: Software - Application | |
| MarketCap: 833 Millions | |
| Recent Price: 7.78 Smart Investing & Trading Score: 20 | |
| Day Percent Change: -0.51% Day Change: -0.04 | |
| Week Change: -1.89% Year-to-date Change: -23.2% | |
| WKME Links: Profile News Message Board | |
| Charts:- Daily , Weekly | |
| Add WKME to Watchlist: View: Get Complete WKME Trend Analysis ➞ | |
 | ATEN A10 Networks, Inc. |
| Sector: Technology | |
| SubSector: Communication Equipment | |
| MarketCap: 363.739 Millions | |
| Recent Price: 12.85 Smart Investing & Trading Score: 28 | |
| Day Percent Change: 0.39% Day Change: 0.05 | |
| Week Change: -1.91% Year-to-date Change: -2.4% | |
| ATEN Links: Profile News Message Board | |
| Charts:- Daily , Weekly | |
| Add ATEN to Watchlist: View: Get Complete ATEN Trend Analysis ➞ | |
 | ITI Iteris, Inc. |
| Sector: Technology | |
| SubSector: Communication Equipment | |
| MarketCap: 129.939 Millions | |
| Recent Price: 4.60 Smart Investing & Trading Score: 25 | |
| Day Percent Change: -0.86% Day Change: -0.04 | |
| Week Change: -1.92% Year-to-date Change: -11.5% | |
| ITI Links: Profile News Message Board | |
| Charts:- Daily , Weekly | |
| Add ITI to Watchlist: View: Get Complete ITI Trend Analysis ➞ | |
 | AFRM Affirm Holdings, Inc. |
| Sector: Technology | |
| SubSector: Software - Infrastructure | |
| MarketCap: 4560 Millions | |
| Recent Price: 32.00 Smart Investing & Trading Score: 42 | |
| Day Percent Change: 3.64% Day Change: 1.13 | |
| Week Change: -1.92% Year-to-date Change: -34.7% | |
| AFRM Links: Profile News Message Board | |
| Charts:- Daily , Weekly | |
| Add AFRM to Watchlist: View: Get Complete AFRM Trend Analysis ➞ | |
 | CGNT Cognyte Software Ltd. |
| Sector: Technology | |
| SubSector: Software - Infrastructure | |
| MarketCap: 397 Millions | |
| Recent Price: 6.60 Smart Investing & Trading Score: 20 | |
| Day Percent Change: -0.60% Day Change: -0.04 | |
| Week Change: -1.93% Year-to-date Change: 2.6% | |
| CGNT Links: Profile News Message Board | |
| Charts:- Daily , Weekly | |
| Add CGNT to Watchlist: View: Get Complete CGNT Trend Analysis ➞ | |
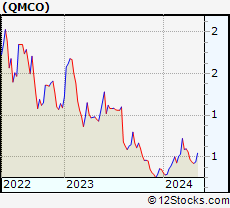 | QMCO Quantum Corporation |
| Sector: Technology | |
| SubSector: Data Storage Devices | |
| MarketCap: 104.499 Millions | |
| Recent Price: 0.46 Smart Investing & Trading Score: 56 | |
| Day Percent Change: 12.20% Day Change: 0.05 | |
| Week Change: -1.94% Year-to-date Change: 31.8% | |
| QMCO Links: Profile News Message Board | |
| Charts:- Daily , Weekly | |
| Add QMCO to Watchlist: View: Get Complete QMCO Trend Analysis ➞ | |
 | NFLX Netflix, Inc. |
| Sector: Technology | |
| SubSector: CATV Systems | |
| MarketCap: 162108 Millions | |
| Recent Price: 610.62 Smart Investing & Trading Score: 41 | |
| Day Percent Change: -0.50% Day Change: -3.08 | |
| Week Change: -1.96% Year-to-date Change: 25.4% | |
| NFLX Links: Profile News Message Board | |
| Charts:- Daily , Weekly | |
| Add NFLX to Watchlist: View: Get Complete NFLX Trend Analysis ➞ | |
 | BIDU Baidu, Inc. |
| Sector: Technology | |
| SubSector: Internet Information Providers | |
| MarketCap: 33525.9 Millions | |
| Recent Price: 95.63 Smart Investing & Trading Score: 17 | |
| Day Percent Change: 1.29% Day Change: 1.22 | |
| Week Change: -1.96% Year-to-date Change: -19.7% | |
| BIDU Links: Profile News Message Board | |
| Charts:- Daily , Weekly | |
| Add BIDU to Watchlist: View: Get Complete BIDU Trend Analysis ➞ | |
 | CCCS CCC Intelligent Solutions Holdings Inc. |
| Sector: Technology | |
| SubSector: Software - Infrastructure | |
| MarketCap: 6990 Millions | |
| Recent Price: 11.48 Smart Investing & Trading Score: 43 | |
| Day Percent Change: 0.44% Day Change: 0.05 | |
| Week Change: -1.96% Year-to-date Change: 1.2% | |
| CCCS Links: Profile News Message Board | |
| Charts:- Daily , Weekly | |
| Add CCCS to Watchlist: View: Get Complete CCCS Trend Analysis ➞ | |
 | META Meta Platforms, Inc. |
| Sector: Technology | |
| SubSector: Internet Content & Information | |
| MarketCap: 732990 Millions | |
| Recent Price: 501.84 Smart Investing & Trading Score: 78 | |
| Day Percent Change: 1.55% Day Change: 7.66 | |
| Week Change: -1.97% Year-to-date Change: 41.8% | |
| META Links: Profile News Message Board | |
| Charts:- Daily , Weekly | |
| Add META to Watchlist: View: Get Complete META Trend Analysis ➞ | |
 | DDOG Datadog, Inc. |
| Sector: Technology | |
| SubSector: Application Software | |
| MarketCap: 10653.2 Millions | |
| Recent Price: 125.00 Smart Investing & Trading Score: 26 | |
| Day Percent Change: 1.17% Day Change: 1.45 | |
| Week Change: -1.97% Year-to-date Change: 3.0% | |
| DDOG Links: Profile News Message Board | |
| Charts:- Daily , Weekly | |
| Add DDOG to Watchlist: View: Get Complete DDOG Trend Analysis ➞ | |
 | ESTC Elastic N.V. |
| Sector: Technology | |
| SubSector: Application Software | |
| MarketCap: 4420.92 Millions | |
| Recent Price: 95.31 Smart Investing & Trading Score: 15 | |
| Day Percent Change: 0.74% Day Change: 0.70 | |
| Week Change: -1.98% Year-to-date Change: -15.4% | |
| ESTC Links: Profile News Message Board | |
| Charts:- Daily , Weekly | |
| Add ESTC to Watchlist: View: Get Complete ESTC Trend Analysis ➞ | |
 | BASE Couchbase, Inc. |
| Sector: Technology | |
| SubSector: Software - Infrastructure | |
| MarketCap: 724 Millions | |
| Recent Price: 24.18 Smart Investing & Trading Score: 25 | |
| Day Percent Change: 1.38% Day Change: 0.33 | |
| Week Change: -1.99% Year-to-date Change: 6.1% | |
| BASE Links: Profile News Message Board | |
| Charts:- Daily , Weekly | |
| Add BASE to Watchlist: View: Get Complete BASE Trend Analysis ➞ | |
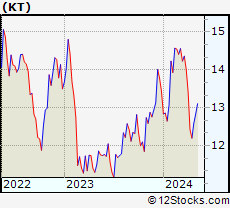 | KT KT Corporation |
| Sector: Technology | |
| SubSector: Telecom Services - Foreign | |
| MarketCap: 4216.89 Millions | |
| Recent Price: 12.17 Smart Investing & Trading Score: 10 | |
| Day Percent Change: 0.41% Day Change: 0.05 | |
| Week Change: -2.01% Year-to-date Change: -9.5% | |
| KT Links: Profile News Message Board | |
| Charts:- Daily , Weekly | |
| Add KT to Watchlist: View: Get Complete KT Trend Analysis ➞ | |
 | ROKU Roku, Inc. |
| Sector: Technology | |
| SubSector: CATV Systems | |
| MarketCap: 10503.6 Millions | |
| Recent Price: 58.69 Smart Investing & Trading Score: 27 | |
| Day Percent Change: 1.91% Day Change: 1.10 | |
| Week Change: -2.02% Year-to-date Change: -36.0% | |
| ROKU Links: Profile News Message Board | |
| Charts:- Daily , Weekly | |
| Add ROKU to Watchlist: View: Get Complete ROKU Trend Analysis ➞ | |
 | STX Seagate Technology plc |
| Sector: Technology | |
| SubSector: Data Storage Devices | |
| MarketCap: 10814.7 Millions | |
| Recent Price: 83.45 Smart Investing & Trading Score: 18 | |
| Day Percent Change: -0.89% Day Change: -0.75 | |
| Week Change: -2.04% Year-to-date Change: -2.3% | |
| STX Links: Profile News Message Board | |
| Charts:- Daily , Weekly | |
| Add STX to Watchlist: View: Get Complete STX Trend Analysis ➞ | |
 | INTU Intuit Inc. |
| Sector: Technology | |
| SubSector: Application Software | |
| MarketCap: 577035 Millions | |
| Recent Price: 608.35 Smart Investing & Trading Score: 18 | |
| Day Percent Change: -0.79% Day Change: -4.86 | |
| Week Change: -2.05% Year-to-date Change: -2.7% | |
| INTU Links: Profile News Message Board | |
| Charts:- Daily , Weekly | |
| Add INTU to Watchlist: View: Get Complete INTU Trend Analysis ➞ | |
 | CLS Celestica Inc. |
| Sector: Technology | |
| SubSector: Printed Circuit Boards | |
| MarketCap: 474.235 Millions | |
| Recent Price: 43.81 Smart Investing & Trading Score: 31 | |
| Day Percent Change: -1.82% Day Change: -0.81 | |
| Week Change: -2.08% Year-to-date Change: 49.6% | |
| CLS Links: Profile News Message Board | |
| Charts:- Daily , Weekly | |
| Add CLS to Watchlist: View: Get Complete CLS Trend Analysis ➞ | |
 | HUBS HubSpot, Inc. |
| Sector: Technology | |
| SubSector: Application Software | |
| MarketCap: 5715.12 Millions | |
| Recent Price: 649.58 Smart Investing & Trading Score: 78 | |
| Day Percent Change: 2.55% Day Change: 16.13 | |
| Week Change: -2.08% Year-to-date Change: 11.9% | |
| HUBS Links: Profile News Message Board | |
| Charts:- Daily , Weekly | |
| Add HUBS to Watchlist: View: Get Complete HUBS Trend Analysis ➞ | |
 | CHKP Check Point Software Technologies Ltd. |
| Sector: Technology | |
| SubSector: Security Software & Services | |
| MarketCap: 15112.2 Millions | |
| Recent Price: 158.35 Smart Investing & Trading Score: 45 | |
| Day Percent Change: 0.16% Day Change: 0.26 | |
| Week Change: -2.09% Year-to-date Change: 3.6% | |
| CHKP Links: Profile News Message Board | |
| Charts:- Daily , Weekly | |
| Add CHKP to Watchlist: View: Get Complete CHKP Trend Analysis ➞ | |
 | TWKS Thoughtworks Holding, Inc. |
| Sector: Technology | |
| SubSector: Information Technology Services | |
| MarketCap: 2370 Millions | |
| Recent Price: 2.34 Smart Investing & Trading Score: 52 | |
| Day Percent Change: 4.00% Day Change: 0.09 | |
| Week Change: -2.09% Year-to-date Change: -51.9% | |
| TWKS Links: Profile News Message Board | |
| Charts:- Daily , Weekly | |
| Add TWKS to Watchlist: View: Get Complete TWKS Trend Analysis ➞ | |
 | IRM Iron Mountain Incorporated |
| Sector: Technology | |
| SubSector: Business Software & Services | |
| MarketCap: 7339.18 Millions | |
| Recent Price: 74.42 Smart Investing & Trading Score: 51 | |
| Day Percent Change: -0.97% Day Change: -0.73 | |
| Week Change: -2.1% Year-to-date Change: 6.3% | |
| IRM Links: Profile News Message Board | |
| Charts:- Daily , Weekly | |
| Add IRM to Watchlist: View: Get Complete IRM Trend Analysis ➞ | |
 | TTGT TechTarget, Inc. |
| Sector: Technology | |
| SubSector: Internet Information Providers | |
| MarketCap: 560.78 Millions | |
| Recent Price: 27.30 Smart Investing & Trading Score: 35 | |
| Day Percent Change: -0.47% Day Change: -0.13 | |
| Week Change: -2.12% Year-to-date Change: -21.7% | |
| TTGT Links: Profile News Message Board | |
| Charts:- Daily , Weekly | |
| Add TTGT to Watchlist: View: Get Complete TTGT Trend Analysis ➞ | |
 | OTEX Open Text Corporation |
| Sector: Technology | |
| SubSector: Application Software | |
| MarketCap: 9291.92 Millions | |
| Recent Price: 34.76 Smart Investing & Trading Score: 25 | |
| Day Percent Change: 0.46% Day Change: 0.16 | |
| Week Change: -2.14% Year-to-date Change: -17.3% | |
| OTEX Links: Profile News Message Board | |
| Charts:- Daily , Weekly | |
| Add OTEX to Watchlist: View: Get Complete OTEX Trend Analysis ➞ | |
 | UIS Unisys Corporation |
| Sector: Technology | |
| SubSector: Information Technology Services | |
| MarketCap: 803.868 Millions | |
| Recent Price: 5.49 Smart Investing & Trading Score: 57 | |
| Day Percent Change: -0.72% Day Change: -0.04 | |
| Week Change: -2.14% Year-to-date Change: -2.3% | |
| UIS Links: Profile News Message Board | |
| Charts:- Daily , Weekly | |
| Add UIS to Watchlist: View: Get Complete UIS Trend Analysis ➞ | |
| For tabular summary view of above stock list: Summary View ➞ 0 - 25 , 25 - 50 , 50 - 75 , 75 - 100 , 100 - 125 , 125 - 150 , 150 - 175 , 175 - 200 , 200 - 225 , 225 - 250 , 250 - 275 , 275 - 300 , 300 - 325 , 325 - 350 , 350 - 375 , 375 - 400 , 400 - 425 , 425 - 450 , 450 - 475 , 475 - 500 , 500 - 525 , 525 - 550 , 550 - 575 , 575 - 600 , 600 - 625 , 625 - 650 | ||
| Click To Change The Sort Order: By Market Cap or Company Size Performance: Year-to-date, Week and Day | |
| Select Chart Type: | ||
|
Best Stocks Today 12Stocks.com |
© 2024 12Stocks.com Terms & Conditions Privacy Contact Us
All Information Provided Only For Education And Not To Be Used For Investing or Trading. See Terms & Conditions


One More Thing ... Get Best Stocks Delivered Daily!
Never Ever Miss A Move With Our Top Ten Stocks Lists
Find Best Stocks In Any Market - Bull or Bear Market
Take A Peek At Our Top Ten Stocks Lists: Daily, Weekly, Year-to-Date & Top Trends
Find Best Stocks In Any Market - Bull or Bear Market
Take A Peek At Our Top Ten Stocks Lists: Daily, Weekly, Year-to-Date & Top Trends
Technology Stocks With Best Up Trends [0-bearish to 100-bullish]: Badger Meter[100], Smith Micro[100], GigaCloud [100], NextNav [100], EchoStar [93], Alphabet [90], Alphabet [90], GDS [88], Payoneer Global[86], Global Business[86], Snap One[86]
Best Technology Stocks Year-to-Date:
MediaCo Holding[522.07%], Super Micro[226.74%], Smith Micro[157.87%], CXApp [144.79%], Uxin [136.8%], GigaCloud [100.82%], D-Wave Quantum[100.02%], MicroStrategy [91.28%], SoundHound AI[87.62%], CuriosityStream [87%], NextNav [82.47%] Best Technology Stocks This Week:
Snap One[29.73%], Expensify [18.37%], Badger Meter[16.72%], Mynaric AG[11.76%], SYLA [10.53%], Encore Wire[10.07%], NextNav [9.58%], GigaCloud [8.8%], Bentley Systems[8.14%], Zuora [7.79%], Luna Innovations[7.69%] Best Technology Stocks Daily:
VIA optronics[22.14%], Badger Meter[16.65%], Expensify [15.23%], Quantum [12.20%], Sequans [9.47%], Smith Micro[9.23%], Cheetah Mobile[9.06%], SYLA [8.89%], FiscalNote [8.61%], Quhuo [8.36%], Markforged Holding[8.26%]