12Stocks.com
Market
Intelligence

Stock Charts, Performance & Trend Analysis for QTEC
First Trust NASDAQ-100 Equal Weighted Technology

QTEC
Year-to-Date: 6.7%
This Week: 0.8%
QTEC Stock Charts
See Daily ➞
See Weekly ➞
See Monthly ➞

QTEC
Year-to-Date (YTD) Return: 6.66%
 
All about FANG Stocks ➞
Popular Trends!AAPL ➞ MSFT ➞ TSLA ➞
S&P 500 ➞ AMZN ➞ GOOGL ➞ FB ➞
Long Term Trend: Good
Medium Term Trend: Not Good
Short Term Trend: Not Good
First
Overall Trend Score:
38 Out Of 100
Bottomline: Bearish to Neutral Trend


Get YOUR Stock Review:

March 19, 2024 - The year-to-date (YTD) performance of First -100 (QTEC) ETF is up 6.66% but is underperforming the overall stock market by -0.84%.

Recently, the weekly returns of First -100 (QTEC) is up 0.76% and is outperforming the overall market by 0.25%.

New! 12Stocks.com introduces Big Monthly, Weekly & Daily Charts
View QTEC Stock Charts      Daily    Weekly    Monthly

Although long term trend for First Trust NASDAQ-100 Equal Weighted Technology looks good, the mid term and short term trends are faltering.

The overall 12Stocks.com Smart Investing & Trading Score is 38 (measures stock trend from 0-bearish to 100-bullish) which puts QTEC in short term bearish to neutral trend.

The Smart Investing & Trading Score from previous trading session is 31 and hence a minor improvement of trend. Scroll down for key technical charts, support & resistance levels and analysis for First.

Stock Analysis for QTEC
Name: First Trust NASDAQ-100 Equal Weighted Technology
Sector:
SubSector:
In A Glance
QTEC Technical Trend Chart View

Daily QTEC Technical Chart
Add QTEC To Watch List   View List
12Stocks.com
Short Term Trend Analysis for
38 / 100
The current technical trend score is 38 in a scale where 0 is bearish and 100 is bullish.
The technical trend score from previous session is 31.
Trend score updated daily. Not to be used for investing.
Recent Price: 187.16    
MarketCap: Millions
Day Percent Change: 0.76%
Day Change: 1.41
Week Change: 0.76%
Year-to-date Change: 6.66%

Technical Levels: For the trading inclined, the following are the key levels of resistance (ceiling) and support (floor) for QTEC. Ceiling and floor levels are stock prices at which the stock trend gets resistance or support respectively and traders have an eye on them. Long term levels are more important. Stocks that have broken thru their resistance or supports convincingly tend to have stronger trends (confirm with charts above visually).
Key Levels for QTEC
 Short TermWeeklyLong Term
Resistance (Ceiling)187.42192.85192.18
Support (Floor)185.71185.71179.1

The table below shows stocks similar to First Trust NASDAQ-100 Equal Weighted Technology, i.e, from same subsector or sector along with year-to-date (YTD), weekly & daily performaces for comparison. Usually, stocks from similar sector tend to move together but companies that have innovative products, services or good management tend to outperform. Quick View: Move mouse or cursor over stock symbol (ticker) to view short-term technical chart and over stock name to view long term chart. Click on ticker or stock name for detailed view. Click on to add stock symbol to your watchlist and to view watchlist.
TickerStock NameWatchlistCategoryRecent PriceChange %Weekly Change%YTD Change%
MSFTMicrosoft Corporation Software417.320.220.2210.98%
AAPLApple Inc. Electronics173.720.640.64-9.77%
GOOGLAlphabet Inc. Tech Services147.684.604.65.72%
METAMeta Platforms, Inc.  Internet Content & Information496.982.662.6640.39%
GOOGAlphabet Inc. Tech Services148.484.444.445.36%
INTUIntuit Inc. Software630.390.780.780.86%
TSMTaiwan Semiconductor Manufacturing Company Limited Semiconductor136.64-0.25-0.2531.38%
VZVerizon Communications Inc. Telecom39.931.111.115.92%
TAT&T Inc. Telecom17.301.471.473.1%
INTCIntel Corporation Semiconductor42.710.160.16-15%
CSCOCisco Systems, Inc. Networking49.270.690.69-2.47%
ORCLOracle Corporation Software127.801.801.821.22%
NFLXNetflix, Inc. Media618.392.062.0627.01%
ADBEAdobe Inc. Software513.864.354.35-13.87%
NVDANVIDIA Corporation Semiconductor884.550.700.778.62%
CRMsalesforce.com, inc. Software300.512.102.114.2%
SAPSAP SE Software186.77-0.82-0.8220.82%
ACNAccenture plc Tech Services372.67-0.52-0.526.2%
ASMLASML Holding N.V. Semiconductor941.340.120.1224.36%
TXNTexas Instruments Incorporated Semiconductor169.21-1.92-1.92-0.73%
BSYBentley Systems, Incorporated Technology48.870.160.16-6.33%
KCKingsoft Cloud Holdings Limited Technology3.379.779.77-10.96%
IBMInternational Business Machines Corporation Tech Services191.690.320.3217.21%
AMSTAmesite Inc. Technology2.416.646.644.78%
MAXNMaxeon Solar Technologies, Ltd. Technology3.01-7.10-7.1-58.08%
You can find complete coverage in the following
Related Pages: 2024 Best Performing Stocks, 2024 Best Performing ETF Funds

Technical Levels: For the trading inclined, the following are the key levels of resistance (ceiling) and support (floor) for QTEC. Ceiling and floor levels are stock prices at which the stock trend gets resistance or support respectively. Stocks & their trends tend to pause at these levels and hence traders have an eye on them.

Long term levels are more important. Stocks that have broken thru their resistance or support levels convincingly tend to have stronger trends (confirm with charts above visually).
Key Technical Levels for QTEC
 Short TermWeeklyLong Term
Resistance (Ceiling)187.42192.85192.18
Support (Floor)185.71185.71179.1

        
RELATIVE PERFORMANCE OF
First Trust NASDAQ-100 Equal Weighted Technology
Vs
THE MARKET
Relative performance of First Trust NASDAQ-100 Equal Weighted Technology
How is QTEC faring versus the market [S&P 500] ? Is it lagging or leading ? How is its relative performance ?
Symbol Day Change Week Change Year-to-Date Change
VTI 0.51% 0.51% 7.5%
QTEC 0.76% 0.76% 6.66%

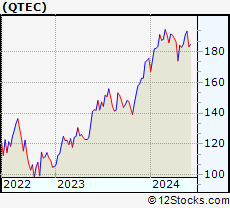
QTEC Daily Chart

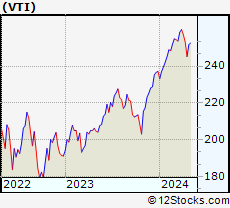
Total Market Daily Chart
Year to date returns QTEC is underperforming the market by -0.84%
This week, QTEC is outperforming the market by 0.25%


List Of ETF Funds Similar To First Trust NASDAQ-100 Equal Weighted Technology

The table below shows ETFs (Exchange Traded Funds) similar to First Trust NASDAQ-100 Equal Weighted Technology, i.e, from same sector along with year-to-date (YTD), weekly & daily performaces for comparison. Usually, ETFs and associated stocks from similar sector tend to move together but companies that have innovative products, services or good management tend to outperform. Move mouse or cursor over ETF symbol to view short-term technical chart and over ETF name to view long term chart. Click on to add ETF symbol to your watchlist and to view watchlist.
TickerStock NameWatchlistCategoryRecent PriceChange %Weekly Change%YTD Change%
XLKTechnology SPDR Technology206.300.330.337.18%
QQQNASDAQ 100  General437.480.810.816.83%
SOCLGlobal X Social Media Index Technology40.121.361.36-0.62%
SMHSemiconductor HOLDRs Technology218.280.200.224.82%
USDProShares Ultra Semiconductors  Technology93.670.450.4572.12%
LTLUltra Telecom Technology59.761.00117.83%
ROMProShares Ultra Technology  Technology59.750.960.9612.57%
QIDProShares Double Short QQQ Technology9.36-1.89-1.89-11.78%
QLDProShares Ultra QQQ Technology85.221.891.8912.13%
SOXSTriple Bear Semicondutors Technology3.590.000-38.32%
SOXLTriple Bull Semiconductors  Technology42.54-0.47-0.4735.48%
REWProShares UltraShort Technology  Technology7.01-0.99-0.99-13.43%
SSGProShares UltraShort Semiconductors  Technology2.61-0.76-0.76-48.42%
PSQProShares Short QQQ Technology8.98-0.88-0.88-5.27%
QQEWFirst Trust NASDAQ-100 Equal Weighted Technology121.730.670.673.64%
ONEQFidelity Nasdaq Composite Index Technology63.330.800.86.9%
IYZiShares US Telecom Technology21.730.510.51-4.53%
Get the most comprehensive stock market coverage daily at 12Stocks.com ➞
Best Stocks Today ➞
Best Stocks Weekly ➞
Best Stocks Year-to-Date ➞
Best Stocks Trends ➞


Best Stocks Today
12Stocks.com


Best Nasdaq Stocks ➞
Best S&P 500 Stocks ➞
Best Tech Stocks ➞
Best Biotech Stocks ➞
 

© 2024 12Stocks.com       Terms & Conditions   Privacy   Contact Us
All Information Provided Only For Education And Not To Be Used For Investing or Trading. See Terms & Conditions

 WatchListmy12Stocks
Best Stocks Today