
 Login Sign Up


| |||||
 |  | ||||

| 12Stocks.com Market Intelligence |
Best Tech Stocks
| In a hurry? Tech Stocks Lists: Performance & Trends, Stock Charts, FANG Stocks
Sort Tech stocks: Daily, Weekly, Year-to-Date, Market Cap & Trends. Filter Tech stocks list by size:All Tech Large Mid-Range Small and MicroCap |
| 12Stocks.com Tech Stocks Performances & Trends Daily | |||||||||
|
|  The overall Smart Investing & Trading Score is 26 (0-bearish to 100-bullish) which puts Technology sector in short term bearish to neutral trend. The Smart Investing & Trading Score from previous trading session is 33 and a deterioration of trend continues.
| ||||||||
Here are the Smart Investing & Trading Scores of the most requested Technology stocks at 12Stocks.com (click stock name for detailed review):
|


| 12Stocks.com: Investing in Technology sector with Stocks | |
|
The following table helps investors and traders sort through current performance and trends (as measured by Smart Investing & Trading Score) of various
stocks in the Tech sector. Quick View: Move mouse or cursor over stock symbol (ticker) to view short-term technical chart and over stock name to view long term chart. Click on  to add stock symbol to your watchlist and to add stock symbol to your watchlist and  to view watchlist. Click on any ticker or stock name for detailed market intelligence report for that stock. to view watchlist. Click on any ticker or stock name for detailed market intelligence report for that stock. |
12Stocks.com Performance of Stocks in Tech Sector
| Ticker | Stock Name | Watchlist | Category | Recent Price | Smart Investing & Trading Score | Change % | Weekly Change% |
| FRGE | Forge Global |   | Software - | 1.82 | 0 | 1.68% | -9.90% |
| KVHI | KVH Industries | | Communication | 4.86 | 23 | 0.00% | -9.92% |
| SSTI | ShotSpotter | | Software | 13.33 | 20 | -2.06% | -10.05% |
| FLYW | Flywire | | Software - Infrastructure | 20.42 | 0 | -1.78% | -10.12% |
| PERF | Perfect | | Software - | 2.39 | 43 | -3.63% | -10.15% |
| CDLX | Cardlytics | | Internet | 12.19 | 41 | -1.77% | -10.17% |
| SKYT | SkyWater | | Semiconductors | 8.76 | 26 | -4.21% | -10.21% |
| ATUS | Altice USA | | Telecom | 1.95 | 15 | 0.52% | -10.55% |
| AGMH | AGM | | Software | 1.43 | 0 | 0.00% | -10.63% |
| SMSI | Smith Micro | | Software | 1.92 | 75 | 2.13% | -10.70% |
| AIXI | Xiao-I | | Software - | 1.50 | 20 | 1.35% | -10.71% |
| BBAI | BigBear.ai | | IT | 1.56 | 17 | -2.50% | -10.86% |
| OPRX | OptimizeRx | | Healthcare Information | 9.53 | 10 | -4.32% | -11.43% |
| PRST | Presto Automation | | Software - | 0.17 | 25 | 0.40% | -11.64% |
| RDFN | Redfin | | Internet | 5.28 | 0 | -6.55% | -11.85% |
| AKTS | Akoustis | | Communication | 0.50 | 35 | -0.06% | -11.92% |
| UXIN | Uxin | | Internet | 1.63 | 10 | 2.52% | -12.83% |
| CRDO | Credo | | Communication | 18.59 | 0 | -4.08% | -13.29% |
| PWSC | PowerSchool | | Software - | 17.79 | 0 | -9.83% | -13.56% |
| ARRY | Array | | Solar | 11.17 | 76 | -2.02% | -13.68% |
| VLD | Velo3D | | Computer Hardware | 0.27 | 20 | -4.96% | -13.68% |
| CINT | CI&T | | Software - Infrastructure | 4.05 | 15 | 0.25% | -13.83% |
| CMTL | Comtech Tele | | Communication | 2.00 | 10 | -0.99% | -13.98% |
| SNCR | Synchronoss | | Software | 6.43 | 10 | -6.13% | -14.27% |
| WALD | Waldencast | | Software - | 5.37 | 10 | -4.28% | -14.35% |
| For chart view version of above stock list: Chart View ➞ 0 - 25 , 25 - 50 , 50 - 75 , 75 - 100 , 100 - 125 , 125 - 150 , 150 - 175 , 175 - 200 , 200 - 225 , 225 - 250 , 250 - 275 , 275 - 300 , 300 - 325 , 325 - 350 , 350 - 375 , 375 - 400 , 400 - 425 , 425 - 450 , 450 - 475 , 475 - 500 , 500 - 525 , 525 - 550 , 550 - 575 , 575 - 600 , 600 - 625 , 625 - 650 | ||
 | Click To Change The Sort Order: By Market Cap or Company Size Performance: Year-to-date, Week and Day |  |
|
Get the most comprehensive stock market coverage daily at 12Stocks.com ➞ Best Stocks Today ➞ Best Stocks Weekly ➞ Best Stocks Year-to-Date ➞ Best Stocks Trends ➞  Best Stocks Today 12Stocks.com Best Nasdaq Stocks ➞ Best S&P 500 Stocks ➞ Best Tech Stocks ➞ Best Biotech Stocks ➞ |
| Detailed Overview of Tech Stocks |
| Tech Technical Overview, Leaders & Laggards, Top Tech ETF Funds & Detailed Tech Stocks List, Charts, Trends & More |
| Tech Sector: Technical Analysis, Trends & YTD Performance | |
| Technology sector is composed of stocks
from semiconductors, software, web, social media
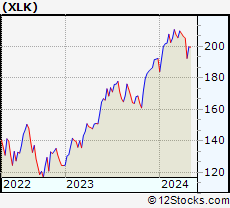
and services subsectors. Technology sector, as represented by XLK, an exchange-traded fund [ETF] that holds basket of tech stocks (e.g, Intel, Google) is up by 3.31% and is currently underperforming the overall market by -1.1% year-to-date. Below is a quick view of technical charts and trends: |
|
 XLK Weekly Chart |
|
| Long Term Trend: Good | |
| Medium Term Trend: Not Good | |
 XLK Daily Chart |
|
| Short Term Trend: Not Good | |
| Overall Trend Score: 26 | |
| YTD Performance: 3.31% | |
| **Trend Scores & Views Are Only For Educational Purposes And Not For Investing | |
| 12Stocks.com: Top Performing Technology Sector Stocks | ||||||||||||||||||||||||||||||||||||||||||||||||
 The top performing Technology sector stocks year to date are
Now, more recently, over last week, the top performing Technology sector stocks on the move are


|
||||||||||||||||||||||||||||||||||||||||||||||||
| 12Stocks.com: Investing in Tech Sector using Exchange Traded Funds | |
|
The following table shows list of key exchange traded funds (ETF) that
help investors track Tech Index. For detailed view, check out our ETF Funds section of our website. Quick View: Move mouse or cursor over ETF symbol (ticker) to view short-term technical chart and over ETF name to view long term chart. Click on ticker or stock name for detailed view. Click on to add stock symbol to your watchlist and to view watchlist. |
12Stocks.com List of ETFs that track Tech Index
| Ticker | ETF Name | Watchlist | Recent Price | Smart Investing & Trading Score | Change % | Week % | Year-to-date % |
| XLK | Technology | | 198.85 | 26 | -1.44 | -3.2 | 3.31% |
| QQQ | QQQ | | 429.70 | 26 | -0.42 | -1.96 | 4.93% |
| IYW | Technology | | 129.92 | 26 | -1.11 | -3.01 | 5.84% |
| VGT | Information Technology | | 501.63 | 26 | -0.69 | -2.53 | 3.64% |
| IXN | Global Tech | | 71.31 | 26 | -1.75 | -3.37 | 4.59% |
| IGV | Tech-Software | | 80.66 | 7 | -0.04 | -2.54 | -0.58% |
| XSD | Semiconductor | | 214.44 | 26 | -2.18 | -3.91 | -4.6% |
| TQQQ | QQQ | | 53.71 | 26 | -3.71 | -8.53 | 5.94% |
| SQQQ | Short QQQ | | 11.87 | 69 | 3.76 | 9 | -11.75% |
| SOXL | Semicondct Bull 3X | | 37.06 | 26 | -8.58 | -10.72 | 18.03% |
| SOXS | Semicondct Bear 3X | | 38.18 | 90 | 5.50 | 984.66 | 556.01% |
| SOXX | PHLX Semiconductor | | 212.67 | 31 | -1.71 | -2.48 | 10.75% |
| QTEC | First -100-Tech | | 181.46 | 26 | -0.99 | -2.45 | 3.41% |
| SMH | Semiconductor | | 212.41 | 31 | -3.08 | -3.75 | 21.46% |
| 12Stocks.com: Charts, Trends, Fundamental Data and Performances of Tech Stocks | |
|
We now take in-depth look at all Tech stocks including charts, multi-period performances and overall trends (as measured by Smart Investing & Trading Score). One can sort Tech stocks (click link to choose) by Daily, Weekly and by Year-to-Date performances. Also, one can sort by size of the company or by market capitalization. |
| Select Your Default Chart Type: | |||||
| |||||
| Click on stock symbol or name for detailed view. Click on to add stock symbol to your watchlist and to view watchlist. Quick View: Move mouse or cursor over "Daily" to quickly view daily technical stock chart and over "Weekly" to view weekly technical stock chart. | |||||


 | FRGE Forge Global Holdings, Inc. |
| Sector: Technology | |
| SubSector: Software - Application | |
| MarketCap: 426 Millions | |
| Recent Price: 1.82 Smart Investing & Trading Score: 0 | |
| Day Percent Change: 1.68% Day Change: 0.03 | |
| Week Change: -9.9% Year-to-date Change: -49.0% | |
| FRGE Links: Profile News Message Board | |
| Charts:- Daily , Weekly | |
| Add FRGE to Watchlist: View: Get Complete FRGE Trend Analysis ➞ | |
 | KVHI KVH Industries, Inc. |
| Sector: Technology | |
| SubSector: Communication Equipment | |
| MarketCap: 169.939 Millions | |
| Recent Price: 4.86 Smart Investing & Trading Score: 23 | |
| Day Percent Change: 0.00% Day Change: 0.00 | |
| Week Change: -9.92% Year-to-date Change: -7.6% | |
| KVHI Links: Profile News Message Board | |
| Charts:- Daily , Weekly | |
| Add KVHI to Watchlist: View: Get Complete KVHI Trend Analysis ➞ | |
 | SSTI ShotSpotter, Inc. |
| Sector: Technology | |
| SubSector: Application Software | |
| MarketCap: 353.062 Millions | |
| Recent Price: 13.33 Smart Investing & Trading Score: 20 | |
| Day Percent Change: -2.06% Day Change: -0.28 | |
| Week Change: -10.05% Year-to-date Change: -47.8% | |
| SSTI Links: Profile News Message Board | |
| Charts:- Daily , Weekly | |
| Add SSTI to Watchlist: View: Get Complete SSTI Trend Analysis ➞ | |
 | FLYW Flywire Corporation |
| Sector: Technology | |
| SubSector: Software - Infrastructure | |
| MarketCap: 3390 Millions | |
| Recent Price: 20.42 Smart Investing & Trading Score: 0 | |
| Day Percent Change: -1.78% Day Change: -0.37 | |
| Week Change: -10.12% Year-to-date Change: -12.9% | |
| FLYW Links: Profile News Message Board | |
| Charts:- Daily , Weekly | |
| Add FLYW to Watchlist: View: Get Complete FLYW Trend Analysis ➞ | |
 | PERF Perfect Corp. |
| Sector: Technology | |
| SubSector: Software - Application | |
| MarketCap: 582 Millions | |
| Recent Price: 2.39 Smart Investing & Trading Score: 43 | |
| Day Percent Change: -3.63% Day Change: -0.09 | |
| Week Change: -10.15% Year-to-date Change: -22.9% | |
| PERF Links: Profile News Message Board | |
| Charts:- Daily , Weekly | |
| Add PERF to Watchlist: View: Get Complete PERF Trend Analysis ➞ | |
 | CDLX Cardlytics, Inc. |
| Sector: Technology | |
| SubSector: Internet Information Providers | |
| MarketCap: 855.48 Millions | |
| Recent Price: 12.19 Smart Investing & Trading Score: 41 | |
| Day Percent Change: -1.77% Day Change: -0.22 | |
| Week Change: -10.17% Year-to-date Change: 32.4% | |
| CDLX Links: Profile News Message Board | |
| Charts:- Daily , Weekly | |
| Add CDLX to Watchlist: View: Get Complete CDLX Trend Analysis ➞ | |
 | SKYT SkyWater Technology, Inc. |
| Sector: Technology | |
| SubSector: Semiconductors | |
| MarketCap: 394 Millions | |
| Recent Price: 8.76 Smart Investing & Trading Score: 26 | |
| Day Percent Change: -4.21% Day Change: -0.38 | |
| Week Change: -10.21% Year-to-date Change: -9.2% | |
| SKYT Links: Profile News Message Board | |
| Charts:- Daily , Weekly | |
| Add SKYT to Watchlist: View: Get Complete SKYT Trend Analysis ➞ | |
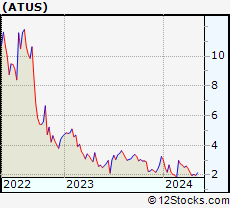 | ATUS Altice USA, Inc. |
| Sector: Technology | |
| SubSector: Telecom Services - Domestic | |
| MarketCap: 13108.3 Millions | |
| Recent Price: 1.95 Smart Investing & Trading Score: 15 | |
| Day Percent Change: 0.52% Day Change: 0.01 | |
| Week Change: -10.55% Year-to-date Change: -40.0% | |
| ATUS Links: Profile News Message Board | |
| Charts:- Daily , Weekly | |
| Add ATUS to Watchlist: View: Get Complete ATUS Trend Analysis ➞ | |
 | AGMH AGM Group Holdings Inc. |
| Sector: Technology | |
| SubSector: Application Software | |
| MarketCap: 320.362 Millions | |
| Recent Price: 1.43 Smart Investing & Trading Score: 0 | |
| Day Percent Change: 0.00% Day Change: 0.00 | |
| Week Change: -10.63% Year-to-date Change: -21.0% | |
| AGMH Links: Profile News Message Board | |
| Charts:- Daily , Weekly | |
| Add AGMH to Watchlist: View: Get Complete AGMH Trend Analysis ➞ | |
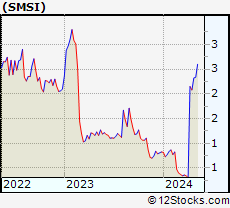 | SMSI Smith Micro Software, Inc. |
| Sector: Technology | |
| SubSector: Application Software | |
| MarketCap: 162.962 Millions | |
| Recent Price: 1.92 Smart Investing & Trading Score: 75 | |
| Day Percent Change: 2.13% Day Change: 0.04 | |
| Week Change: -10.7% Year-to-date Change: 132.5% | |
| SMSI Links: Profile News Message Board | |
| Charts:- Daily , Weekly | |
| Add SMSI to Watchlist: View: Get Complete SMSI Trend Analysis ➞ | |
 | AIXI Xiao-I Corporation |
| Sector: Technology | |
| SubSector: Software - Application | |
| MarketCap: 431 Millions | |
| Recent Price: 1.50 Smart Investing & Trading Score: 20 | |
| Day Percent Change: 1.35% Day Change: 0.02 | |
| Week Change: -10.71% Year-to-date Change: -33.3% | |
| AIXI Links: Profile News Message Board | |
| Charts:- Daily , Weekly | |
| Add AIXI to Watchlist: View: Get Complete AIXI Trend Analysis ➞ | |
 | BBAI BigBear.ai Holdings, Inc. |
| Sector: Technology | |
| SubSector: Information Technology Services | |
| MarketCap: 339 Millions | |
| Recent Price: 1.56 Smart Investing & Trading Score: 17 | |
| Day Percent Change: -2.50% Day Change: -0.04 | |
| Week Change: -10.86% Year-to-date Change: -26.8% | |
| BBAI Links: Profile News Message Board | |
| Charts:- Daily , Weekly | |
| Add BBAI to Watchlist: View: Get Complete BBAI Trend Analysis ➞ | |
 | OPRX OptimizeRx Corporation |
| Sector: Technology | |
| SubSector: Healthcare Information Services | |
| MarketCap: 107.155 Millions | |
| Recent Price: 9.53 Smart Investing & Trading Score: 10 | |
| Day Percent Change: -4.32% Day Change: -0.43 | |
| Week Change: -11.43% Year-to-date Change: -33.4% | |
| OPRX Links: Profile News Message Board | |
| Charts:- Daily , Weekly | |
| Add OPRX to Watchlist: View: Get Complete OPRX Trend Analysis ➞ | |
 | PRST Presto Automation Inc. |
| Sector: Technology | |
| SubSector: Software - Application | |
| MarketCap: 238 Millions | |
| Recent Price: 0.17 Smart Investing & Trading Score: 25 | |
| Day Percent Change: 0.40% Day Change: 0.00 | |
| Week Change: -11.64% Year-to-date Change: -67.1% | |
| PRST Links: Profile News Message Board | |
| Charts:- Daily , Weekly | |
| Add PRST to Watchlist: View: Get Complete PRST Trend Analysis ➞ | |
 | RDFN Redfin Corporation |
| Sector: Technology | |
| SubSector: Internet Information Providers | |
| MarketCap: 1356.2 Millions | |
| Recent Price: 5.28 Smart Investing & Trading Score: 0 | |
| Day Percent Change: -6.55% Day Change: -0.37 | |
| Week Change: -11.85% Year-to-date Change: -48.8% | |
| RDFN Links: Profile News Message Board | |
| Charts:- Daily , Weekly | |
| Add RDFN to Watchlist: View: Get Complete RDFN Trend Analysis ➞ | |
 | AKTS Akoustis Technologies, Inc. |
| Sector: Technology | |
| SubSector: Communication Equipment | |
| MarketCap: 197.039 Millions | |
| Recent Price: 0.50 Smart Investing & Trading Score: 35 | |
| Day Percent Change: -0.06% Day Change: 0.00 | |
| Week Change: -11.92% Year-to-date Change: -39.5% | |
| AKTS Links: Profile News Message Board | |
| Charts:- Daily , Weekly | |
| Add AKTS to Watchlist: View: Get Complete AKTS Trend Analysis ➞ | |
 | UXIN Uxin Limited |
| Sector: Technology | |
| SubSector: Internet Information Providers | |
| MarketCap: 414.58 Millions | |
| Recent Price: 1.63 Smart Investing & Trading Score: 10 | |
| Day Percent Change: 2.52% Day Change: 0.04 | |
| Week Change: -12.83% Year-to-date Change: 132.5% | |
| UXIN Links: Profile News Message Board | |
| Charts:- Daily , Weekly | |
| Add UXIN to Watchlist: View: Get Complete UXIN Trend Analysis ➞ | |
 | CRDO Credo Technology Group Holding Ltd |
| Sector: Technology | |
| SubSector: Communication Equipment | |
| MarketCap: 2590 Millions | |
| Recent Price: 18.59 Smart Investing & Trading Score: 0 | |
| Day Percent Change: -4.08% Day Change: -0.79 | |
| Week Change: -13.29% Year-to-date Change: -5.0% | |
| CRDO Links: Profile News Message Board | |
| Charts:- Daily , Weekly | |
| Add CRDO to Watchlist: View: Get Complete CRDO Trend Analysis ➞ | |
 | PWSC PowerSchool Holdings, Inc. |
| Sector: Technology | |
| SubSector: Software - Application | |
| MarketCap: 3870 Millions | |
| Recent Price: 17.79 Smart Investing & Trading Score: 0 | |
| Day Percent Change: -9.83% Day Change: -1.94 | |
| Week Change: -13.56% Year-to-date Change: -24.8% | |
| PWSC Links: Profile News Message Board | |
| Charts:- Daily , Weekly | |
| Add PWSC to Watchlist: View: Get Complete PWSC Trend Analysis ➞ | |
 | ARRY Array Technologies, Inc. |
| Sector: Technology | |
| SubSector: Solar | |
| MarketCap: 45887 Millions | |
| Recent Price: 11.17 Smart Investing & Trading Score: 76 | |
| Day Percent Change: -2.02% Day Change: -0.23 | |
| Week Change: -13.68% Year-to-date Change: -33.5% | |
| ARRY Links: Profile News Message Board | |
| Charts:- Daily , Weekly | |
| Add ARRY to Watchlist: View: Get Complete ARRY Trend Analysis ➞ | |
 | VLD Velo3D, Inc. |
| Sector: Technology | |
| SubSector: Computer Hardware | |
| MarketCap: 404 Millions | |
| Recent Price: 0.27 Smart Investing & Trading Score: 20 | |
| Day Percent Change: -4.96% Day Change: -0.01 | |
| Week Change: -13.68% Year-to-date Change: -30.3% | |
| VLD Links: Profile News Message Board | |
| Charts:- Daily , Weekly | |
| Add VLD to Watchlist: View: Get Complete VLD Trend Analysis ➞ | |
 | CINT CI&T Inc |
| Sector: Technology | |
| SubSector: Software - Infrastructure | |
| MarketCap: 806 Millions | |
| Recent Price: 4.05 Smart Investing & Trading Score: 15 | |
| Day Percent Change: 0.25% Day Change: 0.01 | |
| Week Change: -13.83% Year-to-date Change: -23.9% | |
| CINT Links: Profile News Message Board | |
| Charts:- Daily , Weekly | |
| Add CINT to Watchlist: View: Get Complete CINT Trend Analysis ➞ | |
 | CMTL Comtech Telecommunications Corp. |
| Sector: Technology | |
| SubSector: Communication Equipment | |
| MarketCap: 399.539 Millions | |
| Recent Price: 2.00 Smart Investing & Trading Score: 10 | |
| Day Percent Change: -0.99% Day Change: -0.02 | |
| Week Change: -13.98% Year-to-date Change: -76.3% | |
| CMTL Links: Profile News Message Board | |
| Charts:- Daily , Weekly | |
| Add CMTL to Watchlist: View: Get Complete CMTL Trend Analysis ➞ | |
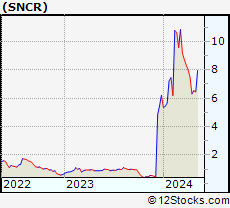 | SNCR Synchronoss Technologies, Inc. |
| Sector: Technology | |
| SubSector: Application Software | |
| MarketCap: 232.262 Millions | |
| Recent Price: 6.43 Smart Investing & Trading Score: 10 | |
| Day Percent Change: -6.13% Day Change: -0.42 | |
| Week Change: -14.27% Year-to-date Change: 3.5% | |
| SNCR Links: Profile News Message Board | |
| Charts:- Daily , Weekly | |
| Add SNCR to Watchlist: View: Get Complete SNCR Trend Analysis ➞ | |
 | WALD Waldencast plc |
| Sector: Technology | |
| SubSector: Software - Application | |
| MarketCap: 897 Millions | |
| Recent Price: 5.37 Smart Investing & Trading Score: 10 | |
| Day Percent Change: -4.28% Day Change: -0.24 | |
| Week Change: -14.35% Year-to-date Change: -52.5% | |
| WALD Links: Profile News Message Board | |
| Charts:- Daily , Weekly | |
| Add WALD to Watchlist: View: Get Complete WALD Trend Analysis ➞ | |
| For tabular summary view of above stock list: Summary View ➞ 0 - 25 , 25 - 50 , 50 - 75 , 75 - 100 , 100 - 125 , 125 - 150 , 150 - 175 , 175 - 200 , 200 - 225 , 225 - 250 , 250 - 275 , 275 - 300 , 300 - 325 , 325 - 350 , 350 - 375 , 375 - 400 , 400 - 425 , 425 - 450 , 450 - 475 , 475 - 500 , 500 - 525 , 525 - 550 , 550 - 575 , 575 - 600 , 600 - 625 , 625 - 650 | ||
| Click To Change The Sort Order: By Market Cap or Company Size Performance: Year-to-date, Week and Day | |
| Select Chart Type: | ||
|
Best Stocks Today 12Stocks.com |
© 2024 12Stocks.com Terms & Conditions Privacy Contact Us
All Information Provided Only For Education And Not To Be Used For Investing or Trading. See Terms & Conditions


One More Thing ... Get Best Stocks Delivered Daily!
Never Ever Miss A Move With Our Top Ten Stocks Lists
Find Best Stocks In Any Market - Bull or Bear Market
Take A Peek At Our Top Ten Stocks Lists: Daily, Weekly, Year-to-Date & Top Trends
Find Best Stocks In Any Market - Bull or Bear Market
Take A Peek At Our Top Ten Stocks Lists: Daily, Weekly, Year-to-Date & Top Trends
Technology Stocks With Best Up Trends [0-bearish to 100-bullish]: NextNav [100], GigaCloud [95], Universal Electronics[95], Allegro MicroSystems[93], Snap One[93], Encore Wire[93], Liberty Latin[90], Liberty Latin[90], CXApp [88], Turkcell Iletisim[88], SYNNEX [88]
Best Technology Stocks Year-to-Date:
MicroCloud Hologram[541.73%], MediaCo Holding[538.5%], Super Micro[237.79%], CXApp [223.55%], Uxin [132.52%], Smith Micro[132.45%], CuriosityStream [92.56%], GigaCloud [90.77%], D-Wave Quantum[90.34%], MicroStrategy [88.27%], SoundHound AI[85.28%] Best Technology Stocks This Week:
Snap One[29.85%], Mynaric AG[11.76%], Encore Wire[10.09%], Zuora [10%], Luna Innovations[8.08%], Super Micro[6.87%], Applied Optoelectronics[6.23%], NextNav [5.13%], Inspire Medical[5.08%], Sea [4.41%], Bentley Systems[4.01%] Best Technology Stocks Daily:
Zuora [11.69%], Inspire Medical[9.87%], MediaCo Holding[8.80%], Maxeon Solar[7.67%], CXApp [7.16%], FiscalNote [7.02%], Luna Innovations[6.44%], Digital Turbine[5.04%], Sunrun [5.03%], Snap [4.71%], Quantum [4.28%]