
 Login Sign Up


| |||||
 |  | ||||

| 12Stocks.com Market Intelligence |
Best Tech Stocks
| In a hurry? Tech Stocks Lists: Performance & Trends, Stock Charts, FANG Stocks
Sort Tech stocks: Daily, Weekly, Year-to-Date, Market Cap & Trends. Filter Tech stocks list by size:All Tech Large Mid-Range Small and MicroCap |
| 12Stocks.com Tech Stocks Performances & Trends Daily | |||||||||
|
|  The overall Smart Investing & Trading Score is 0 (0-bearish to 100-bullish) which puts Technology sector in short term bearish trend. The Smart Investing & Trading Score from previous trading session is 13 and hence a deterioration of trend.
| ||||||||
Here are the Smart Investing & Trading Scores of the most requested Technology stocks at 12Stocks.com (click stock name for detailed review):
|


| 12Stocks.com: Investing in Technology sector with Stocks | |
|
The following table helps investors and traders sort through current performance and trends (as measured by Smart Investing & Trading Score) of various
stocks in the Tech sector. Quick View: Move mouse or cursor over stock symbol (ticker) to view short-term technical chart and over stock name to view long term chart. Click on  to add stock symbol to your watchlist and to add stock symbol to your watchlist and  to view watchlist. Click on any ticker or stock name for detailed market intelligence report for that stock. to view watchlist. Click on any ticker or stock name for detailed market intelligence report for that stock. |
12Stocks.com Performance of Stocks in Tech Sector
| Ticker | Stock Name | Watchlist | Category | Recent Price | Smart Investing & Trading Score | Change % | Weekly Change% |
| SYNA | Synaptics |   | Software | 81.04 | 0 | -0.80% | -10.95% |
| UCTT | Ultra Clean | | Semiconductor | 38.99 | 31 | -3.73% | -10.96% |
| LOGI | Logitech | | Computer | 77.31 | 10 | -0.99% | -10.97% |
| AIP | Arteris | | Semiconductors | 6.39 | 31 | -4.77% | -11.00% |
| DAO | Youdao | | Internet | 3.55 | 31 | -0.56% | -11.03% |
| LSCC | Lattice Semiconductor | | Semiconductor | 66.51 | 26 | -3.17% | -11.04% |
| FORM | FormFactor | | Semiconductor | 40.76 | 26 | -3.16% | -11.14% |
| AMBA | Ambarella | | Semiconductor | 40.99 | 0 | -3.42% | -11.26% |
| UCL | uCloudlink | | Telecom | 1.38 | 5 | -2.79% | -11.35% |
| JBL | Jabil | | Circuit Boards | 118.75 | 0 | -8.36% | -11.43% |
| STEM | Stem | | Software - Infrastructure | 1.55 | 20 | -6.06% | -11.43% |
| MRVL | Marvell | | Semiconductor | 62.13 | 0 | -4.77% | -11.45% |
| MAXN | Maxeon Solar | | Solar | 1.88 | 20 | -1.83% | -11.56% |
| APP | AppLovin | | Software - | 66.80 | 36 | -5.69% | -11.61% |
| IONQ | IonQ | | Computer Hardware | 7.09 | 10 | -6.34% | -11.71% |
| CEVA | CEVA | | Semiconductor | 18.66 | 0 | -2.61% | -11.73% |
| MKSI | MKS | | Instruments | 108.17 | 26 | -3.50% | -11.85% |
| RUN | Sunrun | | Semiconductor | 10.25 | 18 | 1.38% | -11.94% |
| AMKR | Amkor | | Semiconductor | 28.50 | 0 | -1.62% | -11.96% |
| PGY | Pagaya | | Software - Infrastructure | 9.45 | 36 | -6.99% | -12.01% |
| ACMR | ACM Research | | Semiconductor | 25.02 | 26 | -8.70% | -12.55% |
| PERI | Perion Network | | Software | 10.98 | 10 | -2.75% | -12.72% |
| MU | Micron | | Semiconductor- | 106.77 | 31 | -4.61% | -12.86% |
| ARRY | Array | | Solar | 11.27 | 76 | 2.73% | -12.91% |
| WALD | Waldencast | | Software - | 5.46 | 17 | 1.87% | -12.92% |
| For chart view version of above stock list: Chart View ➞ 0 - 25 , 25 - 50 , 50 - 75 , 75 - 100 , 100 - 125 , 125 - 150 , 150 - 175 , 175 - 200 , 200 - 225 , 225 - 250 , 250 - 275 , 275 - 300 , 300 - 325 , 325 - 350 , 350 - 375 , 375 - 400 , 400 - 425 , 425 - 450 , 450 - 475 , 475 - 500 , 500 - 525 , 525 - 550 , 550 - 575 , 575 - 600 , 600 - 625 , 625 - 650 | ||
 | Click To Change The Sort Order: By Market Cap or Company Size Performance: Year-to-date, Week and Day |  |
|
Get the most comprehensive stock market coverage daily at 12Stocks.com ➞ Best Stocks Today ➞ Best Stocks Weekly ➞ Best Stocks Year-to-Date ➞ Best Stocks Trends ➞  Best Stocks Today 12Stocks.com Best Nasdaq Stocks ➞ Best S&P 500 Stocks ➞ Best Tech Stocks ➞ Best Biotech Stocks ➞ |
| Detailed Overview of Tech Stocks |
| Tech Technical Overview, Leaders & Laggards, Top Tech ETF Funds & Detailed Tech Stocks List, Charts, Trends & More |
| Tech Sector: Technical Analysis, Trends & YTD Performance | |
| Technology sector is composed of stocks
from semiconductors, software, web, social media
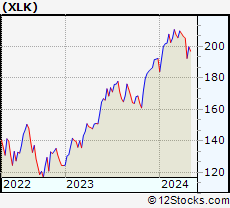
and services subsectors. Technology sector, as represented by XLK, an exchange-traded fund [ETF] that holds basket of tech stocks (e.g, Intel, Google) is up by 0.03% and is currently underperforming the overall market by -3.35% year-to-date. Below is a quick view of technical charts and trends: |
|
 XLK Weekly Chart |
|
| Long Term Trend: Not Good | |
| Medium Term Trend: Not Good | |
 XLK Daily Chart |
|
| Short Term Trend: Not Good | |
| Overall Trend Score: 0 | |
| YTD Performance: 0.03% | |
| **Trend Scores & Views Are Only For Educational Purposes And Not For Investing | |
| 12Stocks.com: Top Performing Technology Sector Stocks | ||||||||||||||||||||||||||||||||||||||||||||||||
 The top performing Technology sector stocks year to date are
Now, more recently, over last week, the top performing Technology sector stocks on the move are


|
||||||||||||||||||||||||||||||||||||||||||||||||
| 12Stocks.com: Investing in Tech Sector using Exchange Traded Funds | |
|
The following table shows list of key exchange traded funds (ETF) that
help investors track Tech Index. For detailed view, check out our ETF Funds section of our website. Quick View: Move mouse or cursor over ETF symbol (ticker) to view short-term technical chart and over ETF name to view long term chart. Click on ticker or stock name for detailed view. Click on to add stock symbol to your watchlist and to view watchlist. |
12Stocks.com List of ETFs that track Tech Index
| Ticker | ETF Name | Watchlist | Recent Price | Smart Investing & Trading Score | Change % | Week % | Year-to-date % |
| XLK | Technology | | 192.53 | 0 | -2.06 | -6.27 | 0.03% |
| QQQ | QQQ | | 414.65 | 13 | -2.07 | -5.39 | 1.25% |
| IYW | Technology | | 124.75 | 36 | -2.85 | -6.87 | 1.63% |
| VGT | Information Technology | | 479.90 | 23 | -2.65 | -6.76 | -0.85% |
| IXN | Global Tech | | 68.72 | 36 | -2.65 | -6.88 | 0.79% |
| IGV | Tech-Software | | 78.53 | 10 | -1.22 | -5.11 | -3.2% |
| XSD | Semiconductor | | 203.56 | 23 | -3.15 | -8.78 | -9.44% |
| TQQQ | QQQ | | 49.48 | 0 | -6.20 | -15.74 | -2.41% |
| SQQQ | Short QQQ | | 12.84 | 82 | 6.38 | 17.91 | -4.54% |
| SOXL | Semicondct Bull 3X | | 30.79 | 0 | -11.80 | -25.83 | -1.94% |
| SOXS | Semicondct Bear 3X | | 46.13 | 90 | 11.78 | 1210.51 | 692.61% |
| SOXX | PHLX Semiconductor | | 198.39 | 36 | -3.99 | -9.02 | 3.31% |
| QTEC | First -100-Tech | | 173.94 | 10 | -2.21 | -6.49 | -0.87% |
| SMH | Semiconductor | | 199.21 | 26 | -4.52 | -9.73 | 13.92% |
| 12Stocks.com: Charts, Trends, Fundamental Data and Performances of Tech Stocks | |
|
We now take in-depth look at all Tech stocks including charts, multi-period performances and overall trends (as measured by Smart Investing & Trading Score). One can sort Tech stocks (click link to choose) by Daily, Weekly and by Year-to-Date performances. Also, one can sort by size of the company or by market capitalization. |
| Select Your Default Chart Type: | |||||
| |||||
| Click on stock symbol or name for detailed view. Click on to add stock symbol to your watchlist and to view watchlist. Quick View: Move mouse or cursor over "Daily" to quickly view daily technical stock chart and over "Weekly" to view weekly technical stock chart. | |||||


 | SYNA Synaptics Incorporated |
| Sector: Technology | |
| SubSector: Application Software | |
| MarketCap: 1822.82 Millions | |
| Recent Price: 81.04 Smart Investing & Trading Score: 0 | |
| Day Percent Change: -0.80% Day Change: -0.65 | |
| Week Change: -10.95% Year-to-date Change: -29.0% | |
| SYNA Links: Profile News Message Board | |
| Charts:- Daily , Weekly | |
| Add SYNA to Watchlist: View: Get Complete SYNA Trend Analysis ➞ | |
 | UCTT Ultra Clean Holdings, Inc. |
| Sector: Technology | |
| SubSector: Semiconductor Equipment & Materials | |
| MarketCap: 528.518 Millions | |
| Recent Price: 38.99 Smart Investing & Trading Score: 31 | |
| Day Percent Change: -3.73% Day Change: -1.51 | |
| Week Change: -10.96% Year-to-date Change: 14.2% | |
| UCTT Links: Profile News Message Board | |
| Charts:- Daily , Weekly | |
| Add UCTT to Watchlist: View: Get Complete UCTT Trend Analysis ➞ | |
 | LOGI Logitech International S.A. |
| Sector: Technology | |
| SubSector: Computer Peripherals | |
| MarketCap: 7998.19 Millions | |
| Recent Price: 77.31 Smart Investing & Trading Score: 10 | |
| Day Percent Change: -0.99% Day Change: -0.77 | |
| Week Change: -10.97% Year-to-date Change: -18.7% | |
| LOGI Links: Profile News Message Board | |
| Charts:- Daily , Weekly | |
| Add LOGI to Watchlist: View: Get Complete LOGI Trend Analysis ➞ | |
 | AIP Arteris, Inc. |
| Sector: Technology | |
| SubSector: Semiconductors | |
| MarketCap: 234 Millions | |
| Recent Price: 6.39 Smart Investing & Trading Score: 31 | |
| Day Percent Change: -4.77% Day Change: -0.32 | |
| Week Change: -11% Year-to-date Change: 8.5% | |
| AIP Links: Profile News Message Board | |
| Charts:- Daily , Weekly | |
| Add AIP to Watchlist: View: Get Complete AIP Trend Analysis ➞ | |
 | DAO Youdao, Inc. |
| Sector: Technology | |
| SubSector: Internet Information Providers | |
| MarketCap: 2073.2 Millions | |
| Recent Price: 3.55 Smart Investing & Trading Score: 31 | |
| Day Percent Change: -0.56% Day Change: -0.02 | |
| Week Change: -11.03% Year-to-date Change: -9.9% | |
| DAO Links: Profile News Message Board | |
| Charts:- Daily , Weekly | |
| Add DAO to Watchlist: View: Get Complete DAO Trend Analysis ➞ | |
 | LSCC Lattice Semiconductor Corporation |
| Sector: Technology | |
| SubSector: Semiconductor - Specialized | |
| MarketCap: 2104 Millions | |
| Recent Price: 66.51 Smart Investing & Trading Score: 26 | |
| Day Percent Change: -3.17% Day Change: -2.18 | |
| Week Change: -11.04% Year-to-date Change: -3.6% | |
| LSCC Links: Profile News Message Board | |
| Charts:- Daily , Weekly | |
| Add LSCC to Watchlist: View: Get Complete LSCC Trend Analysis ➞ | |
 | FORM FormFactor, Inc. |
| Sector: Technology | |
| SubSector: Semiconductor - Broad Line | |
| MarketCap: 1426.42 Millions | |
| Recent Price: 40.76 Smart Investing & Trading Score: 26 | |
| Day Percent Change: -3.16% Day Change: -1.33 | |
| Week Change: -11.14% Year-to-date Change: -2.3% | |
| FORM Links: Profile News Message Board | |
| Charts:- Daily , Weekly | |
| Add FORM to Watchlist: View: Get Complete FORM Trend Analysis ➞ | |
 | AMBA Ambarella, Inc. |
| Sector: Technology | |
| SubSector: Semiconductor Equipment & Materials | |
| MarketCap: 1509.38 Millions | |
| Recent Price: 40.99 Smart Investing & Trading Score: 0 | |
| Day Percent Change: -3.42% Day Change: -1.45 | |
| Week Change: -11.26% Year-to-date Change: -33.1% | |
| AMBA Links: Profile News Message Board | |
| Charts:- Daily , Weekly | |
| Add AMBA to Watchlist: View: Get Complete AMBA Trend Analysis ➞ | |
 | UCL uCloudlink Group Inc. |
| Sector: Technology | |
| SubSector: Telecom Services | |
| MarketCap: 35837 Millions | |
| Recent Price: 1.38 Smart Investing & Trading Score: 5 | |
| Day Percent Change: -2.79% Day Change: -0.04 | |
| Week Change: -11.35% Year-to-date Change: -25.7% | |
| UCL Links: Profile News Message Board | |
| Charts:- Daily , Weekly | |
| Add UCL to Watchlist: View: Get Complete UCL Trend Analysis ➞ | |
 | JBL Jabil Inc. |
| Sector: Technology | |
| SubSector: Printed Circuit Boards | |
| MarketCap: 3272.15 Millions | |
| Recent Price: 118.75 Smart Investing & Trading Score: 0 | |
| Day Percent Change: -8.36% Day Change: -10.84 | |
| Week Change: -11.43% Year-to-date Change: -6.8% | |
| JBL Links: Profile News Message Board | |
| Charts:- Daily , Weekly | |
| Add JBL to Watchlist: View: Get Complete JBL Trend Analysis ➞ | |
 | STEM Stem, Inc. |
| Sector: Technology | |
| SubSector: Software - Infrastructure | |
| MarketCap: 836 Millions | |
| Recent Price: 1.55 Smart Investing & Trading Score: 20 | |
| Day Percent Change: -6.06% Day Change: -0.10 | |
| Week Change: -11.43% Year-to-date Change: -59.6% | |
| STEM Links: Profile News Message Board | |
| Charts:- Daily , Weekly | |
| Add STEM to Watchlist: View: Get Complete STEM Trend Analysis ➞ | |
 | MRVL Marvell Technology Group Ltd. |
| Sector: Technology | |
| SubSector: Semiconductor - Integrated Circuits | |
| MarketCap: 14090.4 Millions | |
| Recent Price: 62.13 Smart Investing & Trading Score: 0 | |
| Day Percent Change: -4.77% Day Change: -3.11 | |
| Week Change: -11.45% Year-to-date Change: 3.0% | |
| MRVL Links: Profile News Message Board | |
| Charts:- Daily , Weekly | |
| Add MRVL to Watchlist: View: Get Complete MRVL Trend Analysis ➞ | |
 | MAXN Maxeon Solar Technologies, Ltd. |
| Sector: Technology | |
| SubSector: Solar | |
| MarketCap: 88787 Millions | |
| Recent Price: 1.88 Smart Investing & Trading Score: 20 | |
| Day Percent Change: -1.83% Day Change: -0.03 | |
| Week Change: -11.56% Year-to-date Change: -73.9% | |
| MAXN Links: Profile News Message Board | |
| Charts:- Daily , Weekly | |
| Add MAXN to Watchlist: View: Get Complete MAXN Trend Analysis ➞ | |
 | APP AppLovin Corporation |
| Sector: Technology | |
| SubSector: Software - Application | |
| MarketCap: 9000 Millions | |
| Recent Price: 66.80 Smart Investing & Trading Score: 36 | |
| Day Percent Change: -5.69% Day Change: -4.03 | |
| Week Change: -11.61% Year-to-date Change: 67.9% | |
| APP Links: Profile News Message Board | |
| Charts:- Daily , Weekly | |
| Add APP to Watchlist: View: Get Complete APP Trend Analysis ➞ | |
 | IONQ IonQ, Inc. |
| Sector: Technology | |
| SubSector: Computer Hardware | |
| MarketCap: 2680 Millions | |
| Recent Price: 7.09 Smart Investing & Trading Score: 10 | |
| Day Percent Change: -6.34% Day Change: -0.48 | |
| Week Change: -11.71% Year-to-date Change: -43.1% | |
| IONQ Links: Profile News Message Board | |
| Charts:- Daily , Weekly | |
| Add IONQ to Watchlist: View: Get Complete IONQ Trend Analysis ➞ | |
 | CEVA CEVA, Inc. |
| Sector: Technology | |
| SubSector: Semiconductor - Specialized | |
| MarketCap: 587.06 Millions | |
| Recent Price: 18.66 Smart Investing & Trading Score: 0 | |
| Day Percent Change: -2.61% Day Change: -0.50 | |
| Week Change: -11.73% Year-to-date Change: -17.8% | |
| CEVA Links: Profile News Message Board | |
| Charts:- Daily , Weekly | |
| Add CEVA to Watchlist: View: Get Complete CEVA Trend Analysis ➞ | |
 | MKSI MKS Instruments, Inc. |
| Sector: Technology | |
| SubSector: Scientific & Technical Instruments | |
| MarketCap: 4502.93 Millions | |
| Recent Price: 108.17 Smart Investing & Trading Score: 26 | |
| Day Percent Change: -3.50% Day Change: -3.92 | |
| Week Change: -11.85% Year-to-date Change: 5.2% | |
| MKSI Links: Profile News Message Board | |
| Charts:- Daily , Weekly | |
| Add MKSI to Watchlist: View: Get Complete MKSI Trend Analysis ➞ | |
 | RUN Sunrun Inc. |
| Sector: Technology | |
| SubSector: Semiconductor - Specialized | |
| MarketCap: 1286.2 Millions | |
| Recent Price: 10.25 Smart Investing & Trading Score: 18 | |
| Day Percent Change: 1.38% Day Change: 0.14 | |
| Week Change: -11.94% Year-to-date Change: -47.8% | |
| RUN Links: Profile News Message Board | |
| Charts:- Daily , Weekly | |
| Add RUN to Watchlist: View: Get Complete RUN Trend Analysis ➞ | |
 | AMKR Amkor Technology, Inc. |
| Sector: Technology | |
| SubSector: Semiconductor - Integrated Circuits | |
| MarketCap: 1966.2 Millions | |
| Recent Price: 28.50 Smart Investing & Trading Score: 0 | |
| Day Percent Change: -1.62% Day Change: -0.47 | |
| Week Change: -11.96% Year-to-date Change: -14.3% | |
| AMKR Links: Profile News Message Board | |
| Charts:- Daily , Weekly | |
| Add AMKR to Watchlist: View: Get Complete AMKR Trend Analysis ➞ | |
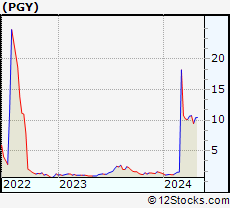 | PGY Pagaya Technologies Ltd. |
| Sector: Technology | |
| SubSector: Software - Infrastructure | |
| MarketCap: 974 Millions | |
| Recent Price: 9.45 Smart Investing & Trading Score: 36 | |
| Day Percent Change: -6.99% Day Change: -0.71 | |
| Week Change: -12.01% Year-to-date Change: 589.8% | |
| PGY Links: Profile News Message Board | |
| Charts:- Daily , Weekly | |
| Add PGY to Watchlist: View: Get Complete PGY Trend Analysis ➞ | |
 | ACMR ACM Research, Inc. |
| Sector: Technology | |
| SubSector: Semiconductor Equipment & Materials | |
| MarketCap: 438.718 Millions | |
| Recent Price: 25.02 Smart Investing & Trading Score: 26 | |
| Day Percent Change: -8.70% Day Change: -2.39 | |
| Week Change: -12.55% Year-to-date Change: 28.1% | |
| ACMR Links: Profile News Message Board | |
| Charts:- Daily , Weekly | |
| Add ACMR to Watchlist: View: Get Complete ACMR Trend Analysis ➞ | |
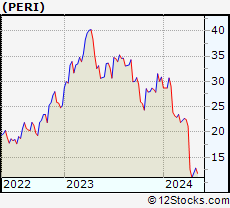 | PERI Perion Network Ltd. |
| Sector: Technology | |
| SubSector: Business Software & Services | |
| MarketCap: 127.058 Millions | |
| Recent Price: 10.98 Smart Investing & Trading Score: 10 | |
| Day Percent Change: -2.75% Day Change: -0.31 | |
| Week Change: -12.72% Year-to-date Change: -64.4% | |
| PERI Links: Profile News Message Board | |
| Charts:- Daily , Weekly | |
| Add PERI to Watchlist: View: Get Complete PERI Trend Analysis ➞ | |
 | MU Micron Technology, Inc. |
| Sector: Technology | |
| SubSector: Semiconductor- Memory Chips | |
| MarketCap: 45188.4 Millions | |
| Recent Price: 106.77 Smart Investing & Trading Score: 31 | |
| Day Percent Change: -4.61% Day Change: -5.16 | |
| Week Change: -12.86% Year-to-date Change: 25.1% | |
| MU Links: Profile News Message Board | |
| Charts:- Daily , Weekly | |
| Add MU to Watchlist: View: Get Complete MU Trend Analysis ➞ | |
 | ARRY Array Technologies, Inc. |
| Sector: Technology | |
| SubSector: Solar | |
| MarketCap: 45887 Millions | |
| Recent Price: 11.27 Smart Investing & Trading Score: 76 | |
| Day Percent Change: 2.73% Day Change: 0.30 | |
| Week Change: -12.91% Year-to-date Change: -32.9% | |
| ARRY Links: Profile News Message Board | |
| Charts:- Daily , Weekly | |
| Add ARRY to Watchlist: View: Get Complete ARRY Trend Analysis ➞ | |
 | WALD Waldencast plc |
| Sector: Technology | |
| SubSector: Software - Application | |
| MarketCap: 897 Millions | |
| Recent Price: 5.46 Smart Investing & Trading Score: 17 | |
| Day Percent Change: 1.87% Day Change: 0.10 | |
| Week Change: -12.92% Year-to-date Change: -51.7% | |
| WALD Links: Profile News Message Board | |
| Charts:- Daily , Weekly | |
| Add WALD to Watchlist: View: Get Complete WALD Trend Analysis ➞ | |
| For tabular summary view of above stock list: Summary View ➞ 0 - 25 , 25 - 50 , 50 - 75 , 75 - 100 , 100 - 125 , 125 - 150 , 150 - 175 , 175 - 200 , 200 - 225 , 225 - 250 , 250 - 275 , 275 - 300 , 300 - 325 , 325 - 350 , 350 - 375 , 375 - 400 , 400 - 425 , 425 - 450 , 450 - 475 , 475 - 500 , 500 - 525 , 525 - 550 , 550 - 575 , 575 - 600 , 600 - 625 , 625 - 650 | ||
| Click To Change The Sort Order: By Market Cap or Company Size Performance: Year-to-date, Week and Day | |
| Select Chart Type: | ||
|
Best Stocks Today 12Stocks.com |
© 2024 12Stocks.com Terms & Conditions Privacy Contact Us
All Information Provided Only For Education And Not To Be Used For Investing or Trading. See Terms & Conditions


One More Thing ... Get Best Stocks Delivered Daily!
Never Ever Miss A Move With Our Top Ten Stocks Lists
Find Best Stocks In Any Market - Bull or Bear Market
Take A Peek At Our Top Ten Stocks Lists: Daily, Weekly, Year-to-Date & Top Trends
Find Best Stocks In Any Market - Bull or Bear Market
Take A Peek At Our Top Ten Stocks Lists: Daily, Weekly, Year-to-Date & Top Trends
Technology Stocks With Best Up Trends [0-bearish to 100-bullish]: Karooooo [100], EchoStar [100], Badger Meter[100], Full Truck[93], Turkcell Iletisim[93], Grab [93], Zuora [93], GDS [88], GigaCloud [88], Criteo S.A[83], So-Young [83]
Best Technology Stocks Year-to-Date:
Pagaya [589.78%], MediaCo Holding[544.37%], CXApp [168.73%], Smith Micro[151.82%], Super Micro[151.06%], Uxin [141.08%], CuriosityStream [107.37%], GigaCloud [89.46%], MicroStrategy [85.89%], NextNav [83.37%], D-Wave Quantum[81.22%] Best Technology Stocks This Week:
Snap One[29.73%], Badger Meter[15.61%], Mynaric AG[13.08%], Expensify [11.56%], Iridium [11.07%], NextNav [10.12%], Encore Wire[8.97%], Quhuo [8.87%], Bentley Systems[7.96%], Applied Optoelectronics[7.93%], Zuora [7.56%] Best Technology Stocks Daily:
Markforged Holding[16.32%], CuriosityStream [10.89%], CXApp [9.78%], Iridium [5.14%], Cheetah Mobile[5.04%], Aerohive Networks[4.23%], Materialise NV[3.98%], Applied Optoelectronics[3.95%], QuinStreet [3.70%], ATN [3.58%], MediaCo Holding[3.58%]