
 Login Sign Up


| |||||
 |  | ||||

| 12Stocks.com Market Intelligence |
Best Tech Stocks
| In a hurry? Tech Stocks Lists: Performance & Trends, Stock Charts, FANG Stocks
Sort Tech stocks: Daily, Weekly, Year-to-Date, Market Cap & Trends. Filter Tech stocks list by size:All Tech Large Mid-Range Small and MicroCap |
| 12Stocks.com Tech Stocks Performances & Trends Daily | |||||||||
|
|  The overall Smart Investing & Trading Score is 45 (0-bearish to 100-bullish) which puts Technology sector in short term neutral trend. The Smart Investing & Trading Score from previous trading session is 38 and hence an improvement of trend.
| ||||||||
Here are the Smart Investing & Trading Scores of the most requested Technology stocks at 12Stocks.com (click stock name for detailed review):
|


| 12Stocks.com: Investing in Technology sector with Stocks | |
|
The following table helps investors and traders sort through current performance and trends (as measured by Smart Investing & Trading Score) of various
stocks in the Tech sector. Quick View: Move mouse or cursor over stock symbol (ticker) to view short-term technical chart and over stock name to view long term chart. Click on  to add stock symbol to your watchlist and to add stock symbol to your watchlist and  to view watchlist. Click on any ticker or stock name for detailed market intelligence report for that stock. to view watchlist. Click on any ticker or stock name for detailed market intelligence report for that stock. |
12Stocks.com Performance of Stocks in Tech Sector
| Ticker | Stock Name | Watchlist | Category | Recent Price | Smart Investing & Trading Score | Change % | Weekly Change% |
| ESE | ESCO |   | Instruments | 104.28 | 83 | -0.32% | 3.33% |
| SNCR | Synchronoss | | Software | 6.52 | 25 | -0.61% | 3.33% |
| AMAT | Applied Materials | | Semiconductor | 196.06 | 63 | 1.46% | 3.31% |
| FORTY | Formula Systems | | IT | 74.60 | 61 | 0.00% | 3.31% |
| SLP | Simulations Plus | | Software | 46.65 | 68 | 1.69% | 3.30% |
| SNPS | Synopsys | | Semiconductor | 527.52 | 32 | 0.00% | 3.29% |
| GOOGL | Alphabet | | Internet | 159.13 | 100 | 0.55% | 3.27% |
| PAYO | Payoneer Global | | Software - Infrastructure | 5.05 | 93 | -2.32% | 3.27% |
| UCTT | Ultra Clean | | Semiconductor | 40.26 | 63 | 1.28% | 3.26% |
| HUBS | HubSpot | | Software | 651.74 | 63 | -0.01% | 3.25% |
| BHE | Benchmark Electronics | | Circuit Boards | 30.59 | 100 | 0.13% | 3.24% |
| FTNT | Fortinet | | Software | 65.45 | 68 | 1.00% | 3.23% |
| LDOS | Leidos | | IT | 128.90 | 83 | 0.17% | 3.19% |
| ASX | ASE | | Semiconductor | 10.37 | 58 | 0.48% | 3.18% |
| RNG | RingCentral | | Software | 30.29 | 37 | -0.79% | 3.17% |
| KD | Kyndryl | | IT | 20.28 | 32 | -1.17% | 3.15% |
| IDCC | InterDigital | | Wireless | 99.66 | 64 | 0.74% | 3.14% |
| GDDY | GoDaddy | | Internet | 123.83 | 63 | 0.35% | 3.09% |
| NVEC | NVE | | Semiconductor | 80.38 | 45 | 1.97% | 3.05% |
| TEF | Telefonica S.A | | Telecom | 4.40 | 93 | -0.68% | 3.04% |
| MOMO | Momo | | Internet | 5.76 | 49 | 0.70% | 3.04% |
| LILAK | Liberty Latin | | CATV | 7.48 | 93 | 0.47% | 3.03% |
| BILL | Bill.com | | Software | 61.41 | 30 | 0.24% | 3.02% |
| ASUR | Asure Software | | Software | 7.20 | 32 | 2.42% | 3.00% |
| TRNS | Transcat | | Instruments | 111.27 | 100 | -3.23% | 2.99% |
| For chart view version of above stock list: Chart View ➞ 0 - 25 , 25 - 50 , 50 - 75 , 75 - 100 , 100 - 125 , 125 - 150 , 150 - 175 , 175 - 200 , 200 - 225 , 225 - 250 , 250 - 275 , 275 - 300 , 300 - 325 , 325 - 350 , 350 - 375 , 375 - 400 , 400 - 425 , 425 - 450 , 450 - 475 , 475 - 500 , 500 - 525 , 525 - 550 , 550 - 575 , 575 - 600 , 600 - 625 , 625 - 650 | ||
 | Click To Change The Sort Order: By Market Cap or Company Size Performance: Year-to-date, Week and Day |  |
|
Get the most comprehensive stock market coverage daily at 12Stocks.com ➞ Best Stocks Today ➞ Best Stocks Weekly ➞ Best Stocks Year-to-Date ➞ Best Stocks Trends ➞  Best Stocks Today 12Stocks.com Best Nasdaq Stocks ➞ Best S&P 500 Stocks ➞ Best Tech Stocks ➞ Best Biotech Stocks ➞ |
| Detailed Overview of Tech Stocks |
| Tech Technical Overview, Leaders & Laggards, Top Tech ETF Funds & Detailed Tech Stocks List, Charts, Trends & More |
| Tech Sector: Technical Analysis, Trends & YTD Performance | |
| Technology sector is composed of stocks
from semiconductors, software, web, social media
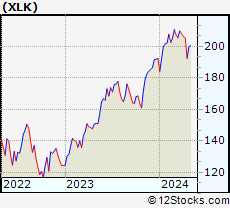
and services subsectors. Technology sector, as represented by XLK, an exchange-traded fund [ETF] that holds basket of tech stocks (e.g, Intel, Google) is up by 2.88% and is currently underperforming the overall market by -2.78% year-to-date. Below is a quick view of technical charts and trends: |
|
 XLK Weekly Chart |
|
| Long Term Trend: Good | |
| Medium Term Trend: Not Good | |
 XLK Daily Chart |
|
| Short Term Trend: Very Good | |
| Overall Trend Score: 45 | |
| YTD Performance: 2.88% | |
| **Trend Scores & Views Are Only For Educational Purposes And Not For Investing | |
| 12Stocks.com: Top Performing Technology Sector Stocks | ||||||||||||||||||||||||||||||||||||||||||||||||
 The top performing Technology sector stocks year to date are
Now, more recently, over last week, the top performing Technology sector stocks on the move are


|
||||||||||||||||||||||||||||||||||||||||||||||||
| 12Stocks.com: Investing in Tech Sector using Exchange Traded Funds | |
|
The following table shows list of key exchange traded funds (ETF) that
help investors track Tech Index. For detailed view, check out our ETF Funds section of our website. Quick View: Move mouse or cursor over ETF symbol (ticker) to view short-term technical chart and over ETF name to view long term chart. Click on ticker or stock name for detailed view. Click on to add stock symbol to your watchlist and to view watchlist. |
12Stocks.com List of ETFs that track Tech Index
| Ticker | ETF Name | Watchlist | Recent Price | Smart Investing & Trading Score | Change % | Week % | Year-to-date % |
| XLK | Technology | | 198.03 | 45 | 0.46 | 2.86 | 2.88% |
| QQQ | QQQ | | 426.51 | 58 | 0.34 | 2.86 | 4.15% |
| IYW | Technology | | 128.84 | 58 | 0.25 | 3.28 | 4.96% |
| VGT | Information Technology | | 495.24 | 45 | 0.16 | 3.2 | 2.32% |
| IXN | Global Tech | | 70.84 | 43 | 0.47 | 3.08 | 3.9% |
| IGV | Tech-Software | | 80.94 | 32 | 0.10 | 3.07 | -0.23% |
| XSD | Semiconductor | | 215.54 | 30 | 2.30 | 5.89 | -4.11% |
| TQQQ | QQQ | | 53.71 | 58 | 0.98 | 8.55 | 5.94% |
| SQQQ | Short QQQ | | 11.81 | 37 | -0.84 | -8.02 | -12.19% |
| SOXL | Semicondct Bull 3X | | 35.49 | 58 | 4.05 | 15.26 | 13.03% |
| SOXS | Semicondct Bear 3X | | 39.61 | 58 | -3.81 | -14.13 | 580.58% |
| SOXX | PHLX Semiconductor | | 208.54 | 58 | 1.30 | 5.12 | 8.6% |
| QTEC | First -100-Tech | | 181.14 | 58 | 0.69 | 4.14 | 3.23% |
| SMH | Semiconductor | | 208.04 | 58 | 0.12 | 4.43 | 18.97% |
| 12Stocks.com: Charts, Trends, Fundamental Data and Performances of Tech Stocks | |
|
We now take in-depth look at all Tech stocks including charts, multi-period performances and overall trends (as measured by Smart Investing & Trading Score). One can sort Tech stocks (click link to choose) by Daily, Weekly and by Year-to-Date performances. Also, one can sort by size of the company or by market capitalization. |
| Select Your Default Chart Type: | |||||
| |||||
| Click on stock symbol or name for detailed view. Click on to add stock symbol to your watchlist and to view watchlist. Quick View: Move mouse or cursor over "Daily" to quickly view daily technical stock chart and over "Weekly" to view weekly technical stock chart. | |||||


 | ESE ESCO Technologies Inc. |
| Sector: Technology | |
| SubSector: Scientific & Technical Instruments | |
| MarketCap: 1968.03 Millions | |
| Recent Price: 104.28 Smart Investing & Trading Score: 83 | |
| Day Percent Change: -0.32% Day Change: -0.34 | |
| Week Change: 3.33% Year-to-date Change: -10.9% | |
| ESE Links: Profile News Message Board | |
| Charts:- Daily , Weekly | |
| Add ESE to Watchlist: View: Get Complete ESE Trend Analysis ➞ | |
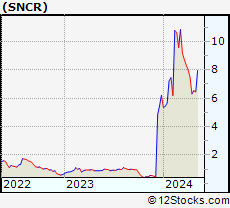 | SNCR Synchronoss Technologies, Inc. |
| Sector: Technology | |
| SubSector: Application Software | |
| MarketCap: 232.262 Millions | |
| Recent Price: 6.52 Smart Investing & Trading Score: 25 | |
| Day Percent Change: -0.61% Day Change: -0.04 | |
| Week Change: 3.33% Year-to-date Change: 5.0% | |
| SNCR Links: Profile News Message Board | |
| Charts:- Daily , Weekly | |
| Add SNCR to Watchlist: View: Get Complete SNCR Trend Analysis ➞ | |
 | AMAT Applied Materials, Inc. |
| Sector: Technology | |
| SubSector: Semiconductor Equipment & Materials | |
| MarketCap: 40593.8 Millions | |
| Recent Price: 196.06 Smart Investing & Trading Score: 63 | |
| Day Percent Change: 1.46% Day Change: 2.82 | |
| Week Change: 3.31% Year-to-date Change: 21.0% | |
| AMAT Links: Profile News Message Board | |
| Charts:- Daily , Weekly | |
| Add AMAT to Watchlist: View: Get Complete AMAT Trend Analysis ➞ | |
 | FORTY Formula Systems (1985) Ltd. |
| Sector: Technology | |
| SubSector: Information Technology Services | |
| MarketCap: 735.768 Millions | |
| Recent Price: 74.60 Smart Investing & Trading Score: 61 | |
| Day Percent Change: 0.00% Day Change: 0.00 | |
| Week Change: 3.31% Year-to-date Change: 14.2% | |
| FORTY Links: Profile News Message Board | |
| Charts:- Daily , Weekly | |
| Add FORTY to Watchlist: View: Get Complete FORTY Trend Analysis ➞ | |
 | SLP Simulations Plus, Inc. |
| Sector: Technology | |
| SubSector: Business Software & Services | |
| MarketCap: 564.258 Millions | |
| Recent Price: 46.65 Smart Investing & Trading Score: 68 | |
| Day Percent Change: 1.69% Day Change: 0.77 | |
| Week Change: 3.3% Year-to-date Change: 4.3% | |
| SLP Links: Profile News Message Board | |
| Charts:- Daily , Weekly | |
| Add SLP to Watchlist: View: Get Complete SLP Trend Analysis ➞ | |
 | SNPS Synopsys, Inc. |
| Sector: Technology | |
| SubSector: Semiconductor Equipment & Materials | |
| MarketCap: 18273.8 Millions | |
| Recent Price: 527.52 Smart Investing & Trading Score: 32 | |
| Day Percent Change: 0.00% Day Change: 0.02 | |
| Week Change: 3.29% Year-to-date Change: 2.5% | |
| SNPS Links: Profile News Message Board | |
| Charts:- Daily , Weekly | |
| Add SNPS to Watchlist: View: Get Complete SNPS Trend Analysis ➞ | |
 | GOOGL Alphabet Inc. |
| Sector: Technology | |
| SubSector: Internet Information Providers | |
| MarketCap: 801264 Millions | |
| Recent Price: 159.13 Smart Investing & Trading Score: 100 | |
| Day Percent Change: 0.55% Day Change: 0.87 | |
| Week Change: 3.27% Year-to-date Change: 13.9% | |
| GOOGL Links: Profile News Message Board | |
| Charts:- Daily , Weekly | |
| Add GOOGL to Watchlist: View: Get Complete GOOGL Trend Analysis ➞ | |
 | PAYO Payoneer Global Inc. |
| Sector: Technology | |
| SubSector: Software - Infrastructure | |
| MarketCap: 1710 Millions | |
| Recent Price: 5.05 Smart Investing & Trading Score: 93 | |
| Day Percent Change: -2.32% Day Change: -0.12 | |
| Week Change: 3.27% Year-to-date Change: -4.5% | |
| PAYO Links: Profile News Message Board | |
| Charts:- Daily , Weekly | |
| Add PAYO to Watchlist: View: Get Complete PAYO Trend Analysis ➞ | |
 | UCTT Ultra Clean Holdings, Inc. |
| Sector: Technology | |
| SubSector: Semiconductor Equipment & Materials | |
| MarketCap: 528.518 Millions | |
| Recent Price: 40.26 Smart Investing & Trading Score: 63 | |
| Day Percent Change: 1.28% Day Change: 0.51 | |
| Week Change: 3.26% Year-to-date Change: 17.9% | |
| UCTT Links: Profile News Message Board | |
| Charts:- Daily , Weekly | |
| Add UCTT to Watchlist: View: Get Complete UCTT Trend Analysis ➞ | |
 | HUBS HubSpot, Inc. |
| Sector: Technology | |
| SubSector: Application Software | |
| MarketCap: 5715.12 Millions | |
| Recent Price: 651.74 Smart Investing & Trading Score: 63 | |
| Day Percent Change: -0.01% Day Change: -0.04 | |
| Week Change: 3.25% Year-to-date Change: 12.3% | |
| HUBS Links: Profile News Message Board | |
| Charts:- Daily , Weekly | |
| Add HUBS to Watchlist: View: Get Complete HUBS Trend Analysis ➞ | |
 | BHE Benchmark Electronics, Inc. |
| Sector: Technology | |
| SubSector: Printed Circuit Boards | |
| MarketCap: 766.835 Millions | |
| Recent Price: 30.59 Smart Investing & Trading Score: 100 | |
| Day Percent Change: 0.13% Day Change: 0.04 | |
| Week Change: 3.24% Year-to-date Change: 10.7% | |
| BHE Links: Profile News Message Board | |
| Charts:- Daily , Weekly | |
| Add BHE to Watchlist: View: Get Complete BHE Trend Analysis ➞ | |
 | FTNT Fortinet, Inc. |
| Sector: Technology | |
| SubSector: Application Software | |
| MarketCap: 16993.8 Millions | |
| Recent Price: 65.45 Smart Investing & Trading Score: 68 | |
| Day Percent Change: 1.00% Day Change: 0.65 | |
| Week Change: 3.23% Year-to-date Change: 11.8% | |
| FTNT Links: Profile News Message Board | |
| Charts:- Daily , Weekly | |
| Add FTNT to Watchlist: View: Get Complete FTNT Trend Analysis ➞ | |
 | LDOS Leidos Holdings, Inc. |
| Sector: Technology | |
| SubSector: Information Technology Services | |
| MarketCap: 11707.5 Millions | |
| Recent Price: 128.90 Smart Investing & Trading Score: 83 | |
| Day Percent Change: 0.17% Day Change: 0.22 | |
| Week Change: 3.19% Year-to-date Change: 19.1% | |
| LDOS Links: Profile News Message Board | |
| Charts:- Daily , Weekly | |
| Add LDOS to Watchlist: View: Get Complete LDOS Trend Analysis ➞ | |
 | ASX ASE Technology Holding Co., Ltd. |
| Sector: Technology | |
| SubSector: Semiconductor Equipment & Materials | |
| MarketCap: 8513.18 Millions | |
| Recent Price: 10.37 Smart Investing & Trading Score: 58 | |
| Day Percent Change: 0.48% Day Change: 0.05 | |
| Week Change: 3.18% Year-to-date Change: 10.2% | |
| ASX Links: Profile News Message Board | |
| Charts:- Daily , Weekly | |
| Add ASX to Watchlist: View: Get Complete ASX Trend Analysis ➞ | |
 | RNG RingCentral, Inc. |
| Sector: Technology | |
| SubSector: Application Software | |
| MarketCap: 17755.3 Millions | |
| Recent Price: 30.29 Smart Investing & Trading Score: 37 | |
| Day Percent Change: -0.79% Day Change: -0.24 | |
| Week Change: 3.17% Year-to-date Change: -10.8% | |
| RNG Links: Profile News Message Board | |
| Charts:- Daily , Weekly | |
| Add RNG to Watchlist: View: Get Complete RNG Trend Analysis ➞ | |
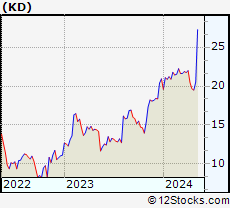 | KD Kyndryl Holdings, Inc. |
| Sector: Technology | |
| SubSector: Information Technology Services | |
| MarketCap: 2990 Millions | |
| Recent Price: 20.28 Smart Investing & Trading Score: 32 | |
| Day Percent Change: -1.17% Day Change: -0.24 | |
| Week Change: 3.15% Year-to-date Change: -3.2% | |
| KD Links: Profile News Message Board | |
| Charts:- Daily , Weekly | |
| Add KD to Watchlist: View: Get Complete KD Trend Analysis ➞ | |
 | IDCC InterDigital, Inc. |
| Sector: Technology | |
| SubSector: Wireless Communications | |
| MarketCap: 1225.27 Millions | |
| Recent Price: 99.66 Smart Investing & Trading Score: 64 | |
| Day Percent Change: 0.74% Day Change: 0.73 | |
| Week Change: 3.14% Year-to-date Change: -8.2% | |
| IDCC Links: Profile News Message Board | |
| Charts:- Daily , Weekly | |
| Add IDCC to Watchlist: View: Get Complete IDCC Trend Analysis ➞ | |
 | GDDY GoDaddy Inc. |
| Sector: Technology | |
| SubSector: Internet Software & Services | |
| MarketCap: 9570.51 Millions | |
| Recent Price: 123.83 Smart Investing & Trading Score: 63 | |
| Day Percent Change: 0.35% Day Change: 0.43 | |
| Week Change: 3.09% Year-to-date Change: 16.6% | |
| GDDY Links: Profile News Message Board | |
| Charts:- Daily , Weekly | |
| Add GDDY to Watchlist: View: Get Complete GDDY Trend Analysis ➞ | |
 | NVEC NVE Corporation |
| Sector: Technology | |
| SubSector: Semiconductor - Specialized | |
| MarketCap: 231.26 Millions | |
| Recent Price: 80.38 Smart Investing & Trading Score: 45 | |
| Day Percent Change: 1.97% Day Change: 1.55 | |
| Week Change: 3.05% Year-to-date Change: 2.5% | |
| NVEC Links: Profile News Message Board | |
| Charts:- Daily , Weekly | |
| Add NVEC to Watchlist: View: Get Complete NVEC Trend Analysis ➞ | |
 | TEF Telefonica, S.A. |
| Sector: Technology | |
| SubSector: Telecom Services - Foreign | |
| MarketCap: 26698.4 Millions | |
| Recent Price: 4.40 Smart Investing & Trading Score: 93 | |
| Day Percent Change: -0.68% Day Change: -0.03 | |
| Week Change: 3.04% Year-to-date Change: 12.8% | |
| TEF Links: Profile News Message Board | |
| Charts:- Daily , Weekly | |
| Add TEF to Watchlist: View: Get Complete TEF Trend Analysis ➞ | |
 | MOMO Momo Inc. |
| Sector: Technology | |
| SubSector: Internet Software & Services | |
| MarketCap: 4796.71 Millions | |
| Recent Price: 5.76 Smart Investing & Trading Score: 49 | |
| Day Percent Change: 0.70% Day Change: 0.04 | |
| Week Change: 3.04% Year-to-date Change: -17.1% | |
| MOMO Links: Profile News Message Board | |
| Charts:- Daily , Weekly | |
| Add MOMO to Watchlist: View: Get Complete MOMO Trend Analysis ➞ | |
 | LILAK Liberty Latin America Ltd. |
| Sector: Technology | |
| SubSector: CATV Systems | |
| MarketCap: 1210.32 Millions | |
| Recent Price: 7.48 Smart Investing & Trading Score: 93 | |
| Day Percent Change: 0.47% Day Change: 0.04 | |
| Week Change: 3.03% Year-to-date Change: 1.9% | |
| LILAK Links: Profile News Message Board | |
| Charts:- Daily , Weekly | |
| Add LILAK to Watchlist: View: Get Complete LILAK Trend Analysis ➞ | |
 | BILL Bill.com Holdings, Inc. |
| Sector: Technology | |
| SubSector: Application Software | |
| MarketCap: 3068.42 Millions | |
| Recent Price: 61.41 Smart Investing & Trading Score: 30 | |
| Day Percent Change: 0.24% Day Change: 0.15 | |
| Week Change: 3.02% Year-to-date Change: -24.7% | |
| BILL Links: Profile News Message Board | |
| Charts:- Daily , Weekly | |
| Add BILL to Watchlist: View: Get Complete BILL Trend Analysis ➞ | |
 | ASUR Asure Software, Inc. |
| Sector: Technology | |
| SubSector: Business Software & Services | |
| MarketCap: 103.758 Millions | |
| Recent Price: 7.20 Smart Investing & Trading Score: 32 | |
| Day Percent Change: 2.42% Day Change: 0.17 | |
| Week Change: 3% Year-to-date Change: -24.4% | |
| ASUR Links: Profile News Message Board | |
| Charts:- Daily , Weekly | |
| Add ASUR to Watchlist: View: Get Complete ASUR Trend Analysis ➞ | |
 | TRNS Transcat, Inc. |
| Sector: Technology | |
| SubSector: Scientific & Technical Instruments | |
| MarketCap: 216.653 Millions | |
| Recent Price: 111.27 Smart Investing & Trading Score: 100 | |
| Day Percent Change: -3.23% Day Change: -3.71 | |
| Week Change: 2.99% Year-to-date Change: 1.8% | |
| TRNS Links: Profile News Message Board | |
| Charts:- Daily , Weekly | |
| Add TRNS to Watchlist: View: Get Complete TRNS Trend Analysis ➞ | |
| For tabular summary view of above stock list: Summary View ➞ 0 - 25 , 25 - 50 , 50 - 75 , 75 - 100 , 100 - 125 , 125 - 150 , 150 - 175 , 175 - 200 , 200 - 225 , 225 - 250 , 250 - 275 , 275 - 300 , 300 - 325 , 325 - 350 , 350 - 375 , 375 - 400 , 400 - 425 , 425 - 450 , 450 - 475 , 475 - 500 , 500 - 525 , 525 - 550 , 550 - 575 , 575 - 600 , 600 - 625 , 625 - 650 | ||
| Click To Change The Sort Order: By Market Cap or Company Size Performance: Year-to-date, Week and Day | |
| Select Chart Type: | ||
|
Best Stocks Today 12Stocks.com |
© 2024 12Stocks.com Terms & Conditions Privacy Contact Us
All Information Provided Only For Education And Not To Be Used For Investing or Trading. See Terms & Conditions


One More Thing ... Get Best Stocks Delivered Daily!
Never Ever Miss A Move With Our Top Ten Stocks Lists
Find Best Stocks In Any Market - Bull or Bear Market
Take A Peek At Our Top Ten Stocks Lists: Daily, Weekly, Year-to-Date & Top Trends
Find Best Stocks In Any Market - Bull or Bear Market
Take A Peek At Our Top Ten Stocks Lists: Daily, Weekly, Year-to-Date & Top Trends
Technology Stocks With Best Up Trends [0-bearish to 100-bullish]: Amesite [100], Ribbon [100], Allegro MicroSystems[100], Texas [100], Microchip [100], EchoStar [100], Analog Devices[100], Vishay Inter[100], JD.com [100], Sea [100], Jamf Holding[100]
Best Technology Stocks Year-to-Date:
Pagaya [581.02%], MicroCloud Hologram[574.82%], MediaCo Holding[364.79%], Uxin [169.61%], CXApp [167.95%], Super Micro[165.5%], Smith Micro[162.71%], SoundHound AI[103.27%], MicroStrategy [100.38%], GigaCloud [96.01%], NextNav [95.73%] Best Technology Stocks This Week:
Matterport [166.09%], Amesite [69.72%], WiMi Hologram[64.85%], Ribbon [25.97%], HashiCorp [23.7%], SoundHound AI[22.54%], Intchains [20.36%], iQIYI [17.99%], Bilibili [16.87%], FTC Solar[16.56%], BigBear.ai [16.55%] Best Technology Stocks Daily:
Amesite [65.50%], WiMi Hologram[58.53%], Ribbon [26.46%], Intchains [22.28%], Uxin [13.86%], Bilibili [10.97%], Comtech Tele[10.76%], Mitcham Industries[9.88%], Navitas Semiconductor[8.83%], FTC Solar[8.51%], AMTD Digital[8.33%]