
 Login Sign Up


| |||||
 |  | ||||

| 12Stocks.com Market Intelligence |
Best Tech Stocks
| In a hurry? Tech Stocks Lists: Performance & Trends, Stock Charts, FANG Stocks
Sort Tech stocks: Daily, Weekly, Year-to-Date, Market Cap & Trends. Filter Tech stocks list by size:All Tech Large Mid-Range Small and MicroCap |
| 12Stocks.com Tech Stocks Performances & Trends Daily | |||||||||
|
|  The overall Smart Investing & Trading Score is 13 (0-bearish to 100-bullish) which puts Technology sector in short term bearish trend. The Smart Investing & Trading Score from previous trading session is 26 and a deterioration of trend continues.
| ||||||||
Here are the Smart Investing & Trading Scores of the most requested Technology stocks at 12Stocks.com (click stock name for detailed review):
|


| 12Stocks.com: Investing in Technology sector with Stocks | |
|
The following table helps investors and traders sort through current performance and trends (as measured by Smart Investing & Trading Score) of various
stocks in the Tech sector. Quick View: Move mouse or cursor over stock symbol (ticker) to view short-term technical chart and over stock name to view long term chart. Click on  to add stock symbol to your watchlist and to add stock symbol to your watchlist and  to view watchlist. Click on any ticker or stock name for detailed market intelligence report for that stock. to view watchlist. Click on any ticker or stock name for detailed market intelligence report for that stock. |
12Stocks.com Performance of Stocks in Tech Sector
| Ticker | Stock Name | Watchlist | Category | Recent Price | Smart Investing & Trading Score | Change % | Weekly Change% |
| S | SentinelOne |   | Software - Infrastructure | 20.61 | 18 | -0.10% | -5.11% |
| MLAB | Mesa | | Instruments | 99.62 | 36 | -1.50% | -5.13% |
| OCFT | OneConnect Financial | | Software | 1.85 | 10 | 3.93% | -5.13% |
| OOMA | Ooma | | Communication | 7.02 | 10 | -1.06% | -5.14% |
| BLND | Blend Labs | | Software - | 2.40 | 22 | 0.00% | -5.14% |
| HIMX | Himax | | Semiconductor | 4.97 | 0 | 0.20% | -5.15% |
| ANET | Arista Networks | | Computer | 257.19 | 23 | -0.80% | -5.17% |
| WDC | Western Digital | | Data Storage | 68.32 | 44 | -2.64% | -5.18% |
| ALRM | Alarm.com | | Software | 64.30 | 36 | 0.08% | -5.19% |
| WOW | WideOpenWest | | CATV | 3.45 | 15 | 0.88% | -5.22% |
| KEYS | Keysight | | Instruments | 146.89 | 10 | -2.03% | -5.29% |
| UBER | Uber | | Software | 71.30 | 26 | -0.89% | -5.29% |
| VICR | Vicor | | Electronics | 34.64 | 10 | -0.17% | -5.30% |
| NXT | Nextracker | | Solar | 44.70 | 18 | -0.18% | -5.30% |
| STNE | StoneCo | | Software | 15.26 | 0 | 0.07% | -5.33% |
| TER | Teradyne | | Semiconductor | 100.20 | 26 | -1.83% | -5.36% |
| KLAC | KLA | | Semiconductor | 644.22 | 26 | -2.24% | -5.37% |
| AAPL | Apple | | Electronic | 167.04 | 0 | -0.57% | -5.39% |
| HLIT | Harmonic | | Communication | 9.99 | 10 | -0.40% | -5.40% |
| CANG | Cango | | Internet | 1.38 | 31 | -2.82% | -5.48% |
| PDFS | | Software | 30.32 | 0 | -3.07% | -5.49% | |
| WIT | Wipro | | IT | 5.16 | 0 | -1.71% | -5.49% |
| FSLR | First Solar | | Semiconductor | 174.29 | 63 | -2.09% | -5.50% |
| EB | Eventbrite | | Software | 5.15 | 10 | 0.00% | -5.50% |
| UMC | United Microelectronics | | Semiconductor | 7.53 | 0 | -0.79% | -5.52% |
| For chart view version of above stock list: Chart View ➞ 0 - 25 , 25 - 50 , 50 - 75 , 75 - 100 , 100 - 125 , 125 - 150 , 150 - 175 , 175 - 200 , 200 - 225 , 225 - 250 , 250 - 275 , 275 - 300 , 300 - 325 , 325 - 350 , 350 - 375 , 375 - 400 , 400 - 425 , 425 - 450 , 450 - 475 , 475 - 500 , 500 - 525 , 525 - 550 , 550 - 575 , 575 - 600 , 600 - 625 , 625 - 650 | ||
 | Click To Change The Sort Order: By Market Cap or Company Size Performance: Year-to-date, Week and Day |  |
|
Get the most comprehensive stock market coverage daily at 12Stocks.com ➞ Best Stocks Today ➞ Best Stocks Weekly ➞ Best Stocks Year-to-Date ➞ Best Stocks Trends ➞  Best Stocks Today 12Stocks.com Best Nasdaq Stocks ➞ Best S&P 500 Stocks ➞ Best Tech Stocks ➞ Best Biotech Stocks ➞ |
| Detailed Overview of Tech Stocks |
| Tech Technical Overview, Leaders & Laggards, Top Tech ETF Funds & Detailed Tech Stocks List, Charts, Trends & More |
| Tech Sector: Technical Analysis, Trends & YTD Performance | |
| Technology sector is composed of stocks
from semiconductors, software, web, social media
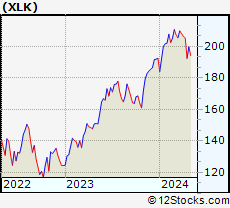
and services subsectors. Technology sector, as represented by XLK, an exchange-traded fund [ETF] that holds basket of tech stocks (e.g, Intel, Google) is up by 2.13% and is currently underperforming the overall market by -2.06% year-to-date. Below is a quick view of technical charts and trends: |
|
 XLK Weekly Chart |
|
| Long Term Trend: Not Good | |
| Medium Term Trend: Not Good | |
 XLK Daily Chart |
|
| Short Term Trend: Not Good | |
| Overall Trend Score: 13 | |
| YTD Performance: 2.13% | |
| **Trend Scores & Views Are Only For Educational Purposes And Not For Investing | |
| 12Stocks.com: Top Performing Technology Sector Stocks | ||||||||||||||||||||||||||||||||||||||||||||||||
 The top performing Technology sector stocks year to date are
Now, more recently, over last week, the top performing Technology sector stocks on the move are


|
||||||||||||||||||||||||||||||||||||||||||||||||
| 12Stocks.com: Investing in Tech Sector using Exchange Traded Funds | |
|
The following table shows list of key exchange traded funds (ETF) that
help investors track Tech Index. For detailed view, check out our ETF Funds section of our website. Quick View: Move mouse or cursor over ETF symbol (ticker) to view short-term technical chart and over ETF name to view long term chart. Click on ticker or stock name for detailed view. Click on to add stock symbol to your watchlist and to view watchlist. |
12Stocks.com List of ETFs that track Tech Index
| Ticker | ETF Name | Watchlist | Recent Price | Smart Investing & Trading Score | Change % | Week % | Year-to-date % |
| XLK | Technology | | 196.58 | 13 | -1.14 | -4.3 | 2.13% |
| QQQ | QQQ | | 423.41 | 26 | -0.57 | -3.39 | 3.39% |
| IYW | Technology | | 128.41 | 26 | -0.72 | -4.14 | 4.61% |
| VGT | Information Technology | | 492.97 | 13 | -0.95 | -4.22 | 1.85% |
| IXN | Global Tech | | 70.59 | 36 | -1.01 | -4.35 | 3.53% |
| IGV | Tech-Software | | 79.50 | 10 | -0.70 | -3.94 | -2.01% |
| XSD | Semiconductor | | 210.17 | 36 | -1.99 | -5.82 | -6.5% |
| TQQQ | QQQ | | 52.75 | 13 | -1.79 | -10.17 | 4.04% |
| SQQQ | Short QQQ | | 12.07 | 69 | 1.77 | 10.84 | -10.26% |
| SOXL | Semicondct Bull 3X | | 34.91 | 26 | -5.80 | -15.9 | 11.18% |
| SOXS | Semicondct Bear 3X | | 41.27 | 90 | 5.42 | 1072.44 | 609.11% |
| SOXX | PHLX Semiconductor | | 206.63 | 26 | -1.77 | -5.25 | 7.6% |
| QTEC | First -100-Tech | | 177.88 | 13 | -1.03 | -4.38 | 1.37% |
| SMH | Semiconductor | | 208.63 | 26 | -1.77 | -5.46 | 19.31% |
| 12Stocks.com: Charts, Trends, Fundamental Data and Performances of Tech Stocks | |
|
We now take in-depth look at all Tech stocks including charts, multi-period performances and overall trends (as measured by Smart Investing & Trading Score). One can sort Tech stocks (click link to choose) by Daily, Weekly and by Year-to-Date performances. Also, one can sort by size of the company or by market capitalization. |
| Select Your Default Chart Type: | |||||
| |||||
| Click on stock symbol or name for detailed view. Click on to add stock symbol to your watchlist and to view watchlist. Quick View: Move mouse or cursor over "Daily" to quickly view daily technical stock chart and over "Weekly" to view weekly technical stock chart. | |||||


 | S SentinelOne, Inc. |
| Sector: Technology | |
| SubSector: Software - Infrastructure | |
| MarketCap: 4420 Millions | |
| Recent Price: 20.61 Smart Investing & Trading Score: 18 | |
| Day Percent Change: -0.10% Day Change: -0.02 | |
| Week Change: -5.11% Year-to-date Change: -24.9% | |
| S Links: Profile News Message Board | |
| Charts:- Daily , Weekly | |
| Add S to Watchlist: View: Get Complete S Trend Analysis ➞ | |
 | MLAB Mesa Laboratories, Inc. |
| Sector: Technology | |
| SubSector: Scientific & Technical Instruments | |
| MarketCap: 935.453 Millions | |
| Recent Price: 99.62 Smart Investing & Trading Score: 36 | |
| Day Percent Change: -1.50% Day Change: -1.52 | |
| Week Change: -5.13% Year-to-date Change: -4.9% | |
| MLAB Links: Profile News Message Board | |
| Charts:- Daily , Weekly | |
| Add MLAB to Watchlist: View: Get Complete MLAB Trend Analysis ➞ | |
 | OCFT OneConnect Financial Technology Co., Ltd. |
| Sector: Technology | |
| SubSector: Software Application | |
| MarketCap: 80387 Millions | |
| Recent Price: 1.85 Smart Investing & Trading Score: 10 | |
| Day Percent Change: 3.93% Day Change: 0.07 | |
| Week Change: -5.13% Year-to-date Change: -41.3% | |
| OCFT Links: Profile News Message Board | |
| Charts:- Daily , Weekly | |
| Add OCFT to Watchlist: View: Get Complete OCFT Trend Analysis ➞ | |
 | OOMA Ooma, Inc. |
| Sector: Technology | |
| SubSector: Diversified Communication Services | |
| MarketCap: 222.064 Millions | |
| Recent Price: 7.02 Smart Investing & Trading Score: 10 | |
| Day Percent Change: -1.06% Day Change: -0.08 | |
| Week Change: -5.14% Year-to-date Change: -34.6% | |
| OOMA Links: Profile News Message Board | |
| Charts:- Daily , Weekly | |
| Add OOMA to Watchlist: View: Get Complete OOMA Trend Analysis ➞ | |
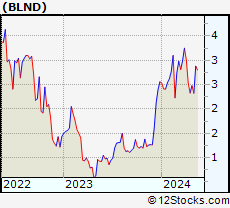 | BLND Blend Labs, Inc. |
| Sector: Technology | |
| SubSector: Software - Application | |
| MarketCap: 210 Millions | |
| Recent Price: 2.40 Smart Investing & Trading Score: 22 | |
| Day Percent Change: 0.00% Day Change: 0.00 | |
| Week Change: -5.14% Year-to-date Change: -6.3% | |
| BLND Links: Profile News Message Board | |
| Charts:- Daily , Weekly | |
| Add BLND to Watchlist: View: Get Complete BLND Trend Analysis ➞ | |
 | HIMX Himax Technologies, Inc. |
| Sector: Technology | |
| SubSector: Semiconductor - Specialized | |
| MarketCap: 496.16 Millions | |
| Recent Price: 4.97 Smart Investing & Trading Score: 0 | |
| Day Percent Change: 0.20% Day Change: 0.01 | |
| Week Change: -5.15% Year-to-date Change: -18.1% | |
| HIMX Links: Profile News Message Board | |
| Charts:- Daily , Weekly | |
| Add HIMX to Watchlist: View: Get Complete HIMX Trend Analysis ➞ | |
 | ANET Arista Networks, Inc. |
| Sector: Technology | |
| SubSector: Diversified Computer Systems | |
| MarketCap: 14071.2 Millions | |
| Recent Price: 257.19 Smart Investing & Trading Score: 23 | |
| Day Percent Change: -0.80% Day Change: -2.08 | |
| Week Change: -5.17% Year-to-date Change: 9.2% | |
| ANET Links: Profile News Message Board | |
| Charts:- Daily , Weekly | |
| Add ANET to Watchlist: View: Get Complete ANET Trend Analysis ➞ | |
 | WDC Western Digital Corporation |
| Sector: Technology | |
| SubSector: Data Storage Devices | |
| MarketCap: 10712.9 Millions | |
| Recent Price: 68.32 Smart Investing & Trading Score: 44 | |
| Day Percent Change: -2.64% Day Change: -1.85 | |
| Week Change: -5.18% Year-to-date Change: 30.5% | |
| WDC Links: Profile News Message Board | |
| Charts:- Daily , Weekly | |
| Add WDC to Watchlist: View: Get Complete WDC Trend Analysis ➞ | |
 | ALRM Alarm.com Holdings, Inc. |
| Sector: Technology | |
| SubSector: Application Software | |
| MarketCap: 2035.62 Millions | |
| Recent Price: 64.30 Smart Investing & Trading Score: 36 | |
| Day Percent Change: 0.08% Day Change: 0.05 | |
| Week Change: -5.19% Year-to-date Change: -0.5% | |
| ALRM Links: Profile News Message Board | |
| Charts:- Daily , Weekly | |
| Add ALRM to Watchlist: View: Get Complete ALRM Trend Analysis ➞ | |
 | WOW WideOpenWest, Inc. |
| Sector: Technology | |
| SubSector: CATV Systems | |
| MarketCap: 328.932 Millions | |
| Recent Price: 3.45 Smart Investing & Trading Score: 15 | |
| Day Percent Change: 0.88% Day Change: 0.03 | |
| Week Change: -5.22% Year-to-date Change: -14.8% | |
| WOW Links: Profile News Message Board | |
| Charts:- Daily , Weekly | |
| Add WOW to Watchlist: View: Get Complete WOW Trend Analysis ➞ | |
 | KEYS Keysight Technologies, Inc. |
| Sector: Technology | |
| SubSector: Scientific & Technical Instruments | |
| MarketCap: 17355.1 Millions | |
| Recent Price: 146.89 Smart Investing & Trading Score: 10 | |
| Day Percent Change: -2.03% Day Change: -3.04 | |
| Week Change: -5.29% Year-to-date Change: -7.7% | |
| KEYS Links: Profile News Message Board | |
| Charts:- Daily , Weekly | |
| Add KEYS to Watchlist: View: Get Complete KEYS Trend Analysis ➞ | |
 | UBER Uber Technologies, Inc. |
| Sector: Technology | |
| SubSector: Application Software | |
| MarketCap: 42671.2 Millions | |
| Recent Price: 71.30 Smart Investing & Trading Score: 26 | |
| Day Percent Change: -0.89% Day Change: -0.64 | |
| Week Change: -5.29% Year-to-date Change: 15.8% | |
| UBER Links: Profile News Message Board | |
| Charts:- Daily , Weekly | |
| Add UBER to Watchlist: View: Get Complete UBER Trend Analysis ➞ | |
 | VICR Vicor Corporation |
| Sector: Technology | |
| SubSector: Diversified Electronics | |
| MarketCap: 1526.76 Millions | |
| Recent Price: 34.64 Smart Investing & Trading Score: 10 | |
| Day Percent Change: -0.17% Day Change: -0.06 | |
| Week Change: -5.3% Year-to-date Change: -22.9% | |
| VICR Links: Profile News Message Board | |
| Charts:- Daily , Weekly | |
| Add VICR to Watchlist: View: Get Complete VICR Trend Analysis ➞ | |
 | NXT Nextracker Inc. |
| Sector: Technology | |
| SubSector: Solar | |
| MarketCap: 5590 Millions | |
| Recent Price: 44.70 Smart Investing & Trading Score: 18 | |
| Day Percent Change: -0.18% Day Change: -0.08 | |
| Week Change: -5.3% Year-to-date Change: -4.3% | |
| NXT Links: Profile News Message Board | |
| Charts:- Daily , Weekly | |
| Add NXT to Watchlist: View: Get Complete NXT Trend Analysis ➞ | |
 | STNE StoneCo Ltd. |
| Sector: Technology | |
| SubSector: Application Software | |
| MarketCap: 7347.82 Millions | |
| Recent Price: 15.26 Smart Investing & Trading Score: 0 | |
| Day Percent Change: 0.07% Day Change: 0.01 | |
| Week Change: -5.33% Year-to-date Change: -15.4% | |
| STNE Links: Profile News Message Board | |
| Charts:- Daily , Weekly | |
| Add STNE to Watchlist: View: Get Complete STNE Trend Analysis ➞ | |
 | TER Teradyne, Inc. |
| Sector: Technology | |
| SubSector: Semiconductor Equipment & Materials | |
| MarketCap: 8135.68 Millions | |
| Recent Price: 100.20 Smart Investing & Trading Score: 26 | |
| Day Percent Change: -1.83% Day Change: -1.87 | |
| Week Change: -5.36% Year-to-date Change: -7.7% | |
| TER Links: Profile News Message Board | |
| Charts:- Daily , Weekly | |
| Add TER to Watchlist: View: Get Complete TER Trend Analysis ➞ | |
 | KLAC KLA Corporation |
| Sector: Technology | |
| SubSector: Semiconductor Equipment & Materials | |
| MarketCap: 20663.8 Millions | |
| Recent Price: 644.22 Smart Investing & Trading Score: 26 | |
| Day Percent Change: -2.24% Day Change: -14.76 | |
| Week Change: -5.37% Year-to-date Change: 10.8% | |
| KLAC Links: Profile News Message Board | |
| Charts:- Daily , Weekly | |
| Add KLAC to Watchlist: View: Get Complete KLAC Trend Analysis ➞ | |
 | AAPL Apple Inc. |
| Sector: Technology | |
| SubSector: Electronic Equipment | |
| MarketCap: 1112940 Millions | |
| Recent Price: 167.04 Smart Investing & Trading Score: 0 | |
| Day Percent Change: -0.57% Day Change: -0.96 | |
| Week Change: -5.39% Year-to-date Change: -13.2% | |
| AAPL Links: Profile News Message Board | |
| Charts:- Daily , Weekly | |
| Add AAPL to Watchlist: View: Get Complete AAPL Trend Analysis ➞ | |
 | HLIT Harmonic Inc. |
| Sector: Technology | |
| SubSector: Communication Equipment | |
| MarketCap: 533.539 Millions | |
| Recent Price: 9.99 Smart Investing & Trading Score: 10 | |
| Day Percent Change: -0.40% Day Change: -0.04 | |
| Week Change: -5.4% Year-to-date Change: -23.4% | |
| HLIT Links: Profile News Message Board | |
| Charts:- Daily , Weekly | |
| Add HLIT to Watchlist: View: Get Complete HLIT Trend Analysis ➞ | |
 | CANG Cango Inc. |
| Sector: Technology | |
| SubSector: Internet Information Providers | |
| MarketCap: 947.48 Millions | |
| Recent Price: 1.38 Smart Investing & Trading Score: 31 | |
| Day Percent Change: -2.82% Day Change: -0.04 | |
| Week Change: -5.48% Year-to-date Change: 35.3% | |
| CANG Links: Profile News Message Board | |
| Charts:- Daily , Weekly | |
| Add CANG to Watchlist: View: Get Complete CANG Trend Analysis ➞ | |
 | PDFS PDF Solutions, Inc. |
| Sector: Technology | |
| SubSector: Technical & System Software | |
| MarketCap: 345.1 Millions | |
| Recent Price: 30.32 Smart Investing & Trading Score: 0 | |
| Day Percent Change: -3.07% Day Change: -0.96 | |
| Week Change: -5.49% Year-to-date Change: -5.7% | |
| PDFS Links: Profile News Message Board | |
| Charts:- Daily , Weekly | |
| Add PDFS to Watchlist: View: Get Complete PDFS Trend Analysis ➞ | |
 | WIT Wipro Limited |
| Sector: Technology | |
| SubSector: Information Technology Services | |
| MarketCap: 15101.3 Millions | |
| Recent Price: 5.16 Smart Investing & Trading Score: 0 | |
| Day Percent Change: -1.71% Day Change: -0.09 | |
| Week Change: -5.49% Year-to-date Change: -7.4% | |
| WIT Links: Profile News Message Board | |
| Charts:- Daily , Weekly | |
| Add WIT to Watchlist: View: Get Complete WIT Trend Analysis ➞ | |
 | FSLR First Solar, Inc. |
| Sector: Technology | |
| SubSector: Semiconductor - Specialized | |
| MarketCap: 3617.9 Millions | |
| Recent Price: 174.29 Smart Investing & Trading Score: 63 | |
| Day Percent Change: -2.09% Day Change: -3.72 | |
| Week Change: -5.5% Year-to-date Change: 1.2% | |
| FSLR Links: Profile News Message Board | |
| Charts:- Daily , Weekly | |
| Add FSLR to Watchlist: View: Get Complete FSLR Trend Analysis ➞ | |
 | EB Eventbrite, Inc. |
| Sector: Technology | |
| SubSector: Application Software | |
| MarketCap: 805.262 Millions | |
| Recent Price: 5.15 Smart Investing & Trading Score: 10 | |
| Day Percent Change: 0.00% Day Change: 0.00 | |
| Week Change: -5.5% Year-to-date Change: -38.4% | |
| EB Links: Profile News Message Board | |
| Charts:- Daily , Weekly | |
| Add EB to Watchlist: View: Get Complete EB Trend Analysis ➞ | |
 | UMC United Microelectronics Corporation |
| Sector: Technology | |
| SubSector: Semiconductor Equipment & Materials | |
| MarketCap: 5672.78 Millions | |
| Recent Price: 7.53 Smart Investing & Trading Score: 0 | |
| Day Percent Change: -0.79% Day Change: -0.06 | |
| Week Change: -5.52% Year-to-date Change: -11.0% | |
| UMC Links: Profile News Message Board | |
| Charts:- Daily , Weekly | |
| Add UMC to Watchlist: View: Get Complete UMC Trend Analysis ➞ | |
| For tabular summary view of above stock list: Summary View ➞ 0 - 25 , 25 - 50 , 50 - 75 , 75 - 100 , 100 - 125 , 125 - 150 , 150 - 175 , 175 - 200 , 200 - 225 , 225 - 250 , 250 - 275 , 275 - 300 , 300 - 325 , 325 - 350 , 350 - 375 , 375 - 400 , 400 - 425 , 425 - 450 , 450 - 475 , 475 - 500 , 500 - 525 , 525 - 550 , 550 - 575 , 575 - 600 , 600 - 625 , 625 - 650 | ||
| Click To Change The Sort Order: By Market Cap or Company Size Performance: Year-to-date, Week and Day | |
| Select Chart Type: | ||
|
Best Stocks Today 12Stocks.com |
© 2024 12Stocks.com Terms & Conditions Privacy Contact Us
All Information Provided Only For Education And Not To Be Used For Investing or Trading. See Terms & Conditions


One More Thing ... Get Best Stocks Delivered Daily!
Never Ever Miss A Move With Our Top Ten Stocks Lists
Find Best Stocks In Any Market - Bull or Bear Market
Take A Peek At Our Top Ten Stocks Lists: Daily, Weekly, Year-to-Date & Top Trends
Find Best Stocks In Any Market - Bull or Bear Market
Take A Peek At Our Top Ten Stocks Lists: Daily, Weekly, Year-to-Date & Top Trends
Technology Stocks With Best Up Trends [0-bearish to 100-bullish]: Badger Meter[100], GigaCloud [100], NextNav [100], EchoStar [100], Inspire Medical[93], Zuora [93], Smith Micro[90], GDS [88], JOYY [88], Payoneer Global[86], Global Business[86]
Best Technology Stocks Year-to-Date:
MediaCo Holding[522.07%], Super Micro[226.63%], Smith Micro[169.37%], CXApp [144.79%], Uxin [136.8%], GigaCloud [100.82%], D-Wave Quantum[100.02%], MicroStrategy [91.28%], SoundHound AI[87.62%], CuriosityStream [87%], NextNav [82.47%] Best Technology Stocks This Week:
Snap One[29.73%], Expensify [18.37%], Badger Meter[16.72%], Mynaric AG[11.76%], SYLA [10.53%], Encore Wire[9.97%], NextNav [9.58%], GigaCloud [8.8%], Bentley Systems[8.14%], Zuora [7.79%], Luna Innovations[7.69%] Best Technology Stocks Daily:
VIA optronics[22.14%], Badger Meter[16.65%], Expensify [15.23%], Smith Micro[14.10%], Quantum [12.20%], Cheetah Mobile[9.06%], SYLA [8.89%], Sequans [8.82%], FiscalNote [8.61%], Quhuo [8.36%], Markforged Holding[8.26%]