
 Login Sign Up


| |||||
 |  | ||||

| 12Stocks.com Market Intelligence |
Best Tech Stocks
| In a hurry? Tech Stocks Lists: Performance & Trends, Stock Charts, FANG Stocks
Sort Tech stocks: Daily, Weekly, Year-to-Date, Market Cap & Trends. Filter Tech stocks list by size:All Tech Large Mid-Range Small and MicroCap |
| 12Stocks.com Tech Stocks Performances & Trends Daily | |||||||||
|
|  The overall Smart Investing & Trading Score is 26 (0-bearish to 100-bullish) which puts Technology sector in short term bearish to neutral trend. The Smart Investing & Trading Score from previous trading session is 33 and hence a deterioration of trend.
| ||||||||
Here are the Smart Investing & Trading Scores of the most requested Technology stocks at 12Stocks.com (click stock name for detailed review):
|


| 12Stocks.com: Investing in Technology sector with Stocks | |
|
The following table helps investors and traders sort through current performance and trends (as measured by Smart Investing & Trading Score) of various
stocks in the Tech sector. Quick View: Move mouse or cursor over stock symbol (ticker) to view short-term technical chart and over stock name to view long term chart. Click on  to add stock symbol to your watchlist and to add stock symbol to your watchlist and  to view watchlist. Click on any ticker or stock name for detailed market intelligence report for that stock. to view watchlist. Click on any ticker or stock name for detailed market intelligence report for that stock. |
12Stocks.com Performance of Stocks in Tech Sector
| Ticker | Stock Name | Watchlist | Category | Recent Price | Smart Investing & Trading Score | Change % | Weekly Change% |
| OLO | Olo |   | Software - | 4.87 | 31 | -2.40% | -2.40% |
| IMOS | ChipMOS | | Semiconductor | 29.13 | 36 | -2.41% | -2.41% |
| SEMR | Semrush | | Software - | 12.03 | 26 | -2.43% | -2.43% |
| PCTY | Paylocity Holding | | Software | 163.96 | 36 | -2.45% | -2.45% |
| YEXT | Yext | | Internet | 5.56 | 0 | -2.46% | -2.46% |
| ESTC | Elastic N.V | | Software | 94.85 | 10 | -2.46% | -2.46% |
| QLYS | Qualys | | Software | 162.05 | 10 | -2.47% | -2.47% |
| NVDA | NVIDIA | | Semiconductor | 860.01 | 31 | -2.48% | -2.48% |
| AVGO | Broadcom | | Semiconductor | 1310.69 | 31 | -2.48% | -2.48% |
| PANW | Palo Alto | | Networking | 272.15 | 10 | -2.48% | -2.48% |
| VEEV | Veeva Systems | | Healthcare Information | 201.62 | 0 | -2.48% | -2.48% |
| BOX | Box | | Software | 26.27 | 36 | -2.49% | -2.49% |
| VMEO | Vimeo | | Software - | 3.52 | 15 | -2.49% | -2.49% |
| KVHI | KVH Industries | | Communication | 5.26 | 64 | -2.50% | -2.50% |
| WIX | Wix.com | | Internet | 123.96 | 0 | -2.50% | -2.50% |
| UBER | Uber | | Software | 73.40 | 26 | -2.50% | -2.50% |
| NFLX | Netflix | | CATV | 607.15 | 34 | -2.52% | -2.52% |
| CRCT | Cricut | | Computer Hardware | 5.00 | 35 | -2.53% | -2.53% |
| CHKP | Check Point | | Security Software | 157.63 | 0 | -2.54% | -2.54% |
| INFY | Infosys | | IT | 17.27 | 0 | -2.54% | -2.54% |
| SMAR | Smartsheet | | Software | 36.71 | 10 | -2.55% | -2.55% |
| WIT | Wipro | | IT | 5.32 | 0 | -2.56% | -2.56% |
| MSCI | MSCI | | Processing | 513.06 | 0 | -2.57% | -2.57% |
| APPF | AppFolio | | Software | 215.70 | 0 | -2.59% | -2.59% |
| BASE | Couchbase | | Software - Infrastructure | 24.02 | 0 | -2.63% | -2.63% |
| For chart view version of above stock list: Chart View ➞ 0 - 25 , 25 - 50 , 50 - 75 , 75 - 100 , 100 - 125 , 125 - 150 , 150 - 175 , 175 - 200 , 200 - 225 , 225 - 250 , 250 - 275 , 275 - 300 , 300 - 325 , 325 - 350 , 350 - 375 , 375 - 400 , 400 - 425 , 425 - 450 , 450 - 475 , 475 - 500 , 500 - 525 , 525 - 550 , 550 - 575 , 575 - 600 , 600 - 625 , 625 - 650 | ||
 | Click To Change The Sort Order: By Market Cap or Company Size Performance: Year-to-date, Week and Day |  |
|
Get the most comprehensive stock market coverage daily at 12Stocks.com ➞ Best Stocks Today ➞ Best Stocks Weekly ➞ Best Stocks Year-to-Date ➞ Best Stocks Trends ➞  Best Stocks Today 12Stocks.com Best Nasdaq Stocks ➞ Best S&P 500 Stocks ➞ Best Tech Stocks ➞ Best Biotech Stocks ➞ |
| Detailed Overview of Tech Stocks |
| Tech Technical Overview, Leaders & Laggards, Top Tech ETF Funds & Detailed Tech Stocks List, Charts, Trends & More |
| Tech Sector: Technical Analysis, Trends & YTD Performance | |
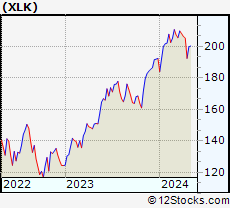
| Technology sector is composed of stocks
from semiconductors, software, web, social media
and services subsectors. Technology sector, as represented by XLK, an exchange-traded fund [ETF] that holds basket of tech stocks (e.g, Intel, Google) is up by 4.71% and is currently underperforming the overall market by -0.63% year-to-date. Below is a quick view of technical charts and trends: |
|
 XLK Weekly Chart |
|
| Long Term Trend: Good | |
| Medium Term Trend: Not Good | |
 XLK Daily Chart |
|
| Short Term Trend: Not Good | |
| Overall Trend Score: 26 | |
| YTD Performance: 4.71% | |
| **Trend Scores & Views Are Only For Educational Purposes And Not For Investing | |
| 12Stocks.com: Top Performing Technology Sector Stocks | ||||||||||||||||||||||||||||||||||||||||||||||||
 The top performing Technology sector stocks year to date are
Now, more recently, over last week, the top performing Technology sector stocks on the move are


|
||||||||||||||||||||||||||||||||||||||||||||||||
| 12Stocks.com: Investing in Tech Sector using Exchange Traded Funds | |
|
The following table shows list of key exchange traded funds (ETF) that
help investors track Tech Index. For detailed view, check out our ETF Funds section of our website. Quick View: Move mouse or cursor over ETF symbol (ticker) to view short-term technical chart and over ETF name to view long term chart. Click on ticker or stock name for detailed view. Click on to add stock symbol to your watchlist and to view watchlist. |
12Stocks.com List of ETFs that track Tech Index
| Ticker | ETF Name | Watchlist | Recent Price | Smart Investing & Trading Score | Change % | Week % | Year-to-date % |
| XLK | Technology | | 201.55 | 26 | -1.88 | -1.88 | 4.71% |
| QQQ | QQQ | | 430.97 | 26 | -1.67 | -1.67 | 5.24% |
| IYW | Technology | | 131.14 | 26 | -2.10 | -2.1 | 6.84% |
| VGT | Information Technology | | 504.89 | 26 | -1.90 | -1.9 | 4.32% |
| IXN | Global Tech | | 73.80 | 34 | 0.00 | 0 | 8.24% |
| IGV | Tech-Software | | 80.48 | 0 | -2.75 | -2.75 | -0.8% |
| XSD | Semiconductor | | 221.94 | 36 | -0.54 | -0.54 | -1.27% |
| TQQQ | QQQ | | 55.77 | 26 | -5.02 | -5.02 | 10% |
| SQQQ | Short QQQ | | 11.44 | 69 | 5.05 | 5.05 | -14.94% |
| SOXL | Semicondct Bull 3X | | 39.78 | 31 | -4.17 | -4.17 | 26.69% |
| SOXS | Semicondct Bear 3X | | 36.62 | 90 | 940.34 | 940.34 | 529.21% |
| SOXX | PHLX Semiconductor | | 215.37 | 31 | -1.24 | -1.24 | 12.15% |
| QTEC | First -100-Tech | | 182.66 | 26 | -1.81 | -1.81 | 4.1% |
| SMH | Semiconductor | | 217.36 | 31 | -1.50 | -1.5 | 24.3% |
| 12Stocks.com: Charts, Trends, Fundamental Data and Performances of Tech Stocks | |
|
We now take in-depth look at all Tech stocks including charts, multi-period performances and overall trends (as measured by Smart Investing & Trading Score). One can sort Tech stocks (click link to choose) by Daily, Weekly and by Year-to-Date performances. Also, one can sort by size of the company or by market capitalization. |
| Select Your Default Chart Type: | |||||
| |||||
| Click on stock symbol or name for detailed view. Click on to add stock symbol to your watchlist and to view watchlist. Quick View: Move mouse or cursor over "Daily" to quickly view daily technical stock chart and over "Weekly" to view weekly technical stock chart. | |||||


 | OLO Olo Inc. |
| Sector: Technology | |
| SubSector: Software - Application | |
| MarketCap: 1030 Millions | |
| Recent Price: 4.87 Smart Investing & Trading Score: 31 | |
| Day Percent Change: -2.40% Day Change: -0.12 | |
| Week Change: -2.4% Year-to-date Change: -14.9% | |
| OLO Links: Profile News Message Board | |
| Charts:- Daily , Weekly | |
| Add OLO to Watchlist: View: Get Complete OLO Trend Analysis ➞ | |
 | IMOS ChipMOS TECHNOLOGIES INC. |
| Sector: Technology | |
| SubSector: Semiconductor Equipment & Materials | |
| MarketCap: 658.918 Millions | |
| Recent Price: 29.13 Smart Investing & Trading Score: 36 | |
| Day Percent Change: -2.41% Day Change: -0.72 | |
| Week Change: -2.41% Year-to-date Change: 7.1% | |
| IMOS Links: Profile News Message Board | |
| Charts:- Daily , Weekly | |
| Add IMOS to Watchlist: View: Get Complete IMOS Trend Analysis ➞ | |
 | SEMR Semrush Holdings, Inc. |
| Sector: Technology | |
| SubSector: Software - Application | |
| MarketCap: 1330 Millions | |
| Recent Price: 12.03 Smart Investing & Trading Score: 26 | |
| Day Percent Change: -2.43% Day Change: -0.30 | |
| Week Change: -2.43% Year-to-date Change: -13.4% | |
| SEMR Links: Profile News Message Board | |
| Charts:- Daily , Weekly | |
| Add SEMR to Watchlist: View: Get Complete SEMR Trend Analysis ➞ | |
 | PCTY Paylocity Holding Corporation |
| Sector: Technology | |
| SubSector: Application Software | |
| MarketCap: 4972.82 Millions | |
| Recent Price: 163.96 Smart Investing & Trading Score: 36 | |
| Day Percent Change: -2.45% Day Change: -4.11 | |
| Week Change: -2.45% Year-to-date Change: -0.5% | |
| PCTY Links: Profile News Message Board | |
| Charts:- Daily , Weekly | |
| Add PCTY to Watchlist: View: Get Complete PCTY Trend Analysis ➞ | |
 | YEXT Yext, Inc. |
| Sector: Technology | |
| SubSector: Internet Software & Services | |
| MarketCap: 1414.91 Millions | |
| Recent Price: 5.56 Smart Investing & Trading Score: 0 | |
| Day Percent Change: -2.46% Day Change: -0.14 | |
| Week Change: -2.46% Year-to-date Change: -5.6% | |
| YEXT Links: Profile News Message Board | |
| Charts:- Daily , Weekly | |
| Add YEXT to Watchlist: View: Get Complete YEXT Trend Analysis ➞ | |
 | ESTC Elastic N.V. |
| Sector: Technology | |
| SubSector: Application Software | |
| MarketCap: 4420.92 Millions | |
| Recent Price: 94.85 Smart Investing & Trading Score: 10 | |
| Day Percent Change: -2.46% Day Change: -2.39 | |
| Week Change: -2.46% Year-to-date Change: -15.8% | |
| ESTC Links: Profile News Message Board | |
| Charts:- Daily , Weekly | |
| Add ESTC to Watchlist: View: Get Complete ESTC Trend Analysis ➞ | |
 | QLYS Qualys, Inc. |
| Sector: Technology | |
| SubSector: Application Software | |
| MarketCap: 3475.02 Millions | |
| Recent Price: 162.05 Smart Investing & Trading Score: 10 | |
| Day Percent Change: -2.47% Day Change: -4.10 | |
| Week Change: -2.47% Year-to-date Change: -17.4% | |
| QLYS Links: Profile News Message Board | |
| Charts:- Daily , Weekly | |
| Add QLYS to Watchlist: View: Get Complete QLYS Trend Analysis ➞ | |
 | NVDA NVIDIA Corporation |
| Sector: Technology | |
| SubSector: Semiconductor - Specialized | |
| MarketCap: 143476 Millions | |
| Recent Price: 860.01 Smart Investing & Trading Score: 31 | |
| Day Percent Change: -2.48% Day Change: -21.85 | |
| Week Change: -2.48% Year-to-date Change: 73.7% | |
| NVDA Links: Profile News Message Board | |
| Charts:- Daily , Weekly | |
| Add NVDA to Watchlist: View: Get Complete NVDA Trend Analysis ➞ | |
 | AVGO Broadcom Inc. |
| Sector: Technology | |
| SubSector: Semiconductor - Broad Line | |
| MarketCap: 86329.1 Millions | |
| Recent Price: 1310.69 Smart Investing & Trading Score: 31 | |
| Day Percent Change: -2.48% Day Change: -33.38 | |
| Week Change: -2.48% Year-to-date Change: 17.4% | |
| AVGO Links: Profile News Message Board | |
| Charts:- Daily , Weekly | |
| Add AVGO to Watchlist: View: Get Complete AVGO Trend Analysis ➞ | |
 | PANW Palo Alto Networks, Inc. |
| Sector: Technology | |
| SubSector: Networking & Communication Devices | |
| MarketCap: 16039.4 Millions | |
| Recent Price: 272.15 Smart Investing & Trading Score: 10 | |
| Day Percent Change: -2.48% Day Change: -6.92 | |
| Week Change: -2.48% Year-to-date Change: -7.7% | |
| PANW Links: Profile News Message Board | |
| Charts:- Daily , Weekly | |
| Add PANW to Watchlist: View: Get Complete PANW Trend Analysis ➞ | |
 | VEEV Veeva Systems Inc. |
| Sector: Technology | |
| SubSector: Healthcare Information Services | |
| MarketCap: 21492.1 Millions | |
| Recent Price: 201.62 Smart Investing & Trading Score: 0 | |
| Day Percent Change: -2.48% Day Change: -5.12 | |
| Week Change: -2.48% Year-to-date Change: 4.7% | |
| VEEV Links: Profile News Message Board | |
| Charts:- Daily , Weekly | |
| Add VEEV to Watchlist: View: Get Complete VEEV Trend Analysis ➞ | |
 | BOX Box, Inc. |
| Sector: Technology | |
| SubSector: Application Software | |
| MarketCap: 2154.42 Millions | |
| Recent Price: 26.27 Smart Investing & Trading Score: 36 | |
| Day Percent Change: -2.49% Day Change: -0.67 | |
| Week Change: -2.49% Year-to-date Change: 2.6% | |
| BOX Links: Profile News Message Board | |
| Charts:- Daily , Weekly | |
| Add BOX to Watchlist: View: Get Complete BOX Trend Analysis ➞ | |
 | VMEO Vimeo, Inc. |
| Sector: Technology | |
| SubSector: Software - Application | |
| MarketCap: 678 Millions | |
| Recent Price: 3.52 Smart Investing & Trading Score: 15 | |
| Day Percent Change: -2.49% Day Change: -0.09 | |
| Week Change: -2.49% Year-to-date Change: -10.3% | |
| VMEO Links: Profile News Message Board | |
| Charts:- Daily , Weekly | |
| Add VMEO to Watchlist: View: Get Complete VMEO Trend Analysis ➞ | |
 | KVHI KVH Industries, Inc. |
| Sector: Technology | |
| SubSector: Communication Equipment | |
| MarketCap: 169.939 Millions | |
| Recent Price: 5.26 Smart Investing & Trading Score: 64 | |
| Day Percent Change: -2.50% Day Change: -0.13 | |
| Week Change: -2.5% Year-to-date Change: 0.0% | |
| KVHI Links: Profile News Message Board | |
| Charts:- Daily , Weekly | |
| Add KVHI to Watchlist: View: Get Complete KVHI Trend Analysis ➞ | |
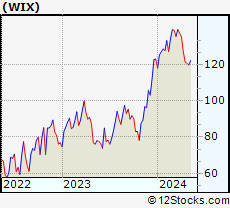 | WIX Wix.com Ltd. |
| Sector: Technology | |
| SubSector: Internet Information Providers | |
| MarketCap: 5459.9 Millions | |
| Recent Price: 123.96 Smart Investing & Trading Score: 0 | |
| Day Percent Change: -2.50% Day Change: -3.18 | |
| Week Change: -2.5% Year-to-date Change: 0.8% | |
| WIX Links: Profile News Message Board | |
| Charts:- Daily , Weekly | |
| Add WIX to Watchlist: View: Get Complete WIX Trend Analysis ➞ | |
 | UBER Uber Technologies, Inc. |
| Sector: Technology | |
| SubSector: Application Software | |
| MarketCap: 42671.2 Millions | |
| Recent Price: 73.40 Smart Investing & Trading Score: 26 | |
| Day Percent Change: -2.50% Day Change: -1.88 | |
| Week Change: -2.5% Year-to-date Change: 19.2% | |
| UBER Links: Profile News Message Board | |
| Charts:- Daily , Weekly | |
| Add UBER to Watchlist: View: Get Complete UBER Trend Analysis ➞ | |
 | NFLX Netflix, Inc. |
| Sector: Technology | |
| SubSector: CATV Systems | |
| MarketCap: 162108 Millions | |
| Recent Price: 607.15 Smart Investing & Trading Score: 34 | |
| Day Percent Change: -2.52% Day Change: -15.68 | |
| Week Change: -2.52% Year-to-date Change: 24.7% | |
| NFLX Links: Profile News Message Board | |
| Charts:- Daily , Weekly | |
| Add NFLX to Watchlist: View: Get Complete NFLX Trend Analysis ➞ | |
 | CRCT Cricut, Inc. |
| Sector: Technology | |
| SubSector: Computer Hardware | |
| MarketCap: 2920 Millions | |
| Recent Price: 5.00 Smart Investing & Trading Score: 35 | |
| Day Percent Change: -2.53% Day Change: -0.13 | |
| Week Change: -2.53% Year-to-date Change: -25.1% | |
| CRCT Links: Profile News Message Board | |
| Charts:- Daily , Weekly | |
| Add CRCT to Watchlist: View: Get Complete CRCT Trend Analysis ➞ | |
 | CHKP Check Point Software Technologies Ltd. |
| Sector: Technology | |
| SubSector: Security Software & Services | |
| MarketCap: 15112.2 Millions | |
| Recent Price: 157.63 Smart Investing & Trading Score: 0 | |
| Day Percent Change: -2.54% Day Change: -4.10 | |
| Week Change: -2.54% Year-to-date Change: 3.2% | |
| CHKP Links: Profile News Message Board | |
| Charts:- Daily , Weekly | |
| Add CHKP to Watchlist: View: Get Complete CHKP Trend Analysis ➞ | |
 | INFY Infosys Limited |
| Sector: Technology | |
| SubSector: Information Technology Services | |
| MarketCap: 33819.1 Millions | |
| Recent Price: 17.27 Smart Investing & Trading Score: 0 | |
| Day Percent Change: -2.54% Day Change: -0.45 | |
| Week Change: -2.54% Year-to-date Change: -6.0% | |
| INFY Links: Profile News Message Board | |
| Charts:- Daily , Weekly | |
| Add INFY to Watchlist: View: Get Complete INFY Trend Analysis ➞ | |
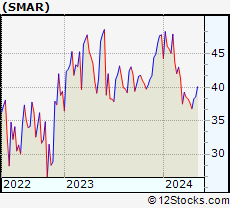 | SMAR Smartsheet Inc. |
| Sector: Technology | |
| SubSector: Business Software & Services | |
| MarketCap: 5159.38 Millions | |
| Recent Price: 36.71 Smart Investing & Trading Score: 10 | |
| Day Percent Change: -2.55% Day Change: -0.96 | |
| Week Change: -2.55% Year-to-date Change: -23.2% | |
| SMAR Links: Profile News Message Board | |
| Charts:- Daily , Weekly | |
| Add SMAR to Watchlist: View: Get Complete SMAR Trend Analysis ➞ | |
 | WIT Wipro Limited |
| Sector: Technology | |
| SubSector: Information Technology Services | |
| MarketCap: 15101.3 Millions | |
| Recent Price: 5.32 Smart Investing & Trading Score: 0 | |
| Day Percent Change: -2.56% Day Change: -0.14 | |
| Week Change: -2.56% Year-to-date Change: -4.5% | |
| WIT Links: Profile News Message Board | |
| Charts:- Daily , Weekly | |
| Add WIT to Watchlist: View: Get Complete WIT Trend Analysis ➞ | |
 | MSCI MSCI Inc. |
| Sector: Technology | |
| SubSector: Processing Systems & Products | |
| MarketCap: 21086.3 Millions | |
| Recent Price: 513.06 Smart Investing & Trading Score: 0 | |
| Day Percent Change: -2.57% Day Change: -13.56 | |
| Week Change: -2.57% Year-to-date Change: -9.3% | |
| MSCI Links: Profile News Message Board | |
| Charts:- Daily , Weekly | |
| Add MSCI to Watchlist: View: Get Complete MSCI Trend Analysis ➞ | |
 | APPF AppFolio, Inc. |
| Sector: Technology | |
| SubSector: Application Software | |
| MarketCap: 3412.02 Millions | |
| Recent Price: 215.70 Smart Investing & Trading Score: 0 | |
| Day Percent Change: -2.59% Day Change: -5.73 | |
| Week Change: -2.59% Year-to-date Change: 24.5% | |
| APPF Links: Profile News Message Board | |
| Charts:- Daily , Weekly | |
| Add APPF to Watchlist: View: Get Complete APPF Trend Analysis ➞ | |
 | BASE Couchbase, Inc. |
| Sector: Technology | |
| SubSector: Software - Infrastructure | |
| MarketCap: 724 Millions | |
| Recent Price: 24.02 Smart Investing & Trading Score: 0 | |
| Day Percent Change: -2.63% Day Change: -0.65 | |
| Week Change: -2.63% Year-to-date Change: 5.4% | |
| BASE Links: Profile News Message Board | |
| Charts:- Daily , Weekly | |
| Add BASE to Watchlist: View: Get Complete BASE Trend Analysis ➞ | |
| For tabular summary view of above stock list: Summary View ➞ 0 - 25 , 25 - 50 , 50 - 75 , 75 - 100 , 100 - 125 , 125 - 150 , 150 - 175 , 175 - 200 , 200 - 225 , 225 - 250 , 250 - 275 , 275 - 300 , 300 - 325 , 325 - 350 , 350 - 375 , 375 - 400 , 400 - 425 , 425 - 450 , 450 - 475 , 475 - 500 , 500 - 525 , 525 - 550 , 550 - 575 , 575 - 600 , 600 - 625 , 625 - 650 | ||
| Click To Change The Sort Order: By Market Cap or Company Size Performance: Year-to-date, Week and Day | |
| Select Chart Type: | ||
|
Best Stocks Today 12Stocks.com |
© 2024 12Stocks.com Terms & Conditions Privacy Contact Us
All Information Provided Only For Education And Not To Be Used For Investing or Trading. See Terms & Conditions


One More Thing ... Get Best Stocks Delivered Daily!
Never Ever Miss A Move With Our Top Ten Stocks Lists
Find Best Stocks In Any Market - Bull or Bear Market
Take A Peek At Our Top Ten Stocks Lists: Daily, Weekly, Year-to-Date & Top Trends
Find Best Stocks In Any Market - Bull or Bear Market
Take A Peek At Our Top Ten Stocks Lists: Daily, Weekly, Year-to-Date & Top Trends
Technology Stocks With Best Up Trends [0-bearish to 100-bullish]: Snap One[100], Encore Wire[100], Cheetah Mobile[100], Perfect [95], EchoStar [93], Mitek Systems[90], Karooooo [86], Magic Software[83], GigaCloud [76], Array [76], Liberty Latin[76]
Best Technology Stocks Year-to-Date:
MediaCo Holding[576.06%], CXApp [226.64%], Super Micro[210.54%], Uxin [146.79%], Smith Micro[138.5%], CuriosityStream [122.18%], Cheetah Mobile[112.72%], MicroStrategy [111.5%], SoundHound AI[85.51%], D-Wave Quantum[80.08%], AppLovin [79.49%] Best Technology Stocks This Week:
Snap One[29.48%], Encore Wire[11.59%], Mynaric AG[8.11%], Cheetah Mobile[5.21%], Arqit Quantum[3.64%], Karooooo [3.45%], Blackbaud [3.14%], Momo [2.83%], Quhuo [2.61%], LivePerson [2.37%], Universal Electronics[2.11%] Best Technology Stocks Daily:
Snap One[29.48%], Encore Wire[11.59%], Mynaric AG[8.11%], Cheetah Mobile[5.21%], Arqit Quantum[3.64%], Karooooo [3.45%], Blackbaud [3.14%], Momo [2.83%], Quhuo [2.61%], LivePerson [2.37%], Universal Electronics[2.11%]