
 Login Sign Up


| |||||
 |  | ||||

| 12Stocks.com Market Intelligence |
Best Tech Stocks
| In a hurry? Tech Stocks Lists: Performance & Trends, Stock Charts, FANG Stocks
Sort Tech stocks: Daily, Weekly, Year-to-Date, Market Cap & Trends. Filter Tech stocks list by size:All Tech Large Mid-Range Small and MicroCap |
| 12Stocks.com Tech Stocks Performances & Trends Daily | |||||||||
|
|  The overall Smart Investing & Trading Score is 32 (0-bearish to 100-bullish) which puts Technology sector in short term bearish to neutral trend. The Smart Investing & Trading Score from previous trading session is 38 and hence a deterioration of trend.
| ||||||||
Here are the Smart Investing & Trading Scores of the most requested Technology stocks at 12Stocks.com (click stock name for detailed review):
|


| 12Stocks.com: Investing in Technology sector with Stocks | |
|
The following table helps investors and traders sort through current performance and trends (as measured by Smart Investing & Trading Score) of various
stocks in the Tech sector. Quick View: Move mouse or cursor over stock symbol (ticker) to view short-term technical chart and over stock name to view long term chart. Click on  to add stock symbol to your watchlist and to add stock symbol to your watchlist and  to view watchlist. Click on any ticker or stock name for detailed market intelligence report for that stock. to view watchlist. Click on any ticker or stock name for detailed market intelligence report for that stock. |
12Stocks.com Performance of Stocks in Tech Sector
| Ticker | Stock Name | Watchlist | Category | Recent Price | Smart Investing & Trading Score | Change % | Weekly Change% |
| MLAB | Mesa |   | Instruments | 104.34 | 90 | -2.14% | 3.57% |
| OUST | Ouster | | Electronic Components | 7.42 | 68 | -1.92% | 3.56% |
| ZBRA | Zebra | | Communication | 277.57 | 68 | 0.37% | 3.54% |
| ANET | Arista Networks | | Computer | 254.77 | 32 | 1.43% | 3.53% |
| SPOK | Spok | | Wireless | 15.54 | 49 | 0.91% | 3.53% |
| TENB | Tenable | | Software | 46.40 | 10 | 0.54% | 3.50% |
| RXT | Rackspace | | Software Infrastructure | 1.63 | 27 | -2.98% | 3.49% |
| TKC | Turkcell Iletisim | | Wireless | 5.94 | 100 | 0.85% | 3.48% |
| MQ | Marqeta | | Software - Infrastructure | 5.50 | 42 | -2.92% | 3.48% |
| SNX | SYNNEX | | IT | 117.24 | 85 | 1.12% | 3.46% |
| GCT | GigaCloud | | Software - Infrastructure | 35.89 | 81 | -2.97% | 3.46% |
| APPF | AppFolio | | Software | 215.72 | 32 | -1.65% | 3.46% |
| AMD | Advanced Micro | | Semiconductor | 151.68 | 32 | -0.39% | 3.44% |
| USM | United States | | Wireless | 36.77 | 64 | 2.80% | 3.43% |
| GOOG | Alphabet | | Internet | 161.05 | 100 | 0.71% | 3.42% |
| TLS | Telos | | IT | 3.48 | 37 | 1.31% | 3.41% |
| CIEN | Ciena | | Communication | 45.04 | 42 | 0.72% | 3.40% |
| AMAT | Applied Materials | | Semiconductor | 196.22 | 63 | 1.54% | 3.40% |
| AEIS | Advanced Energy | | Electronics | 92.75 | 42 | -0.38% | 3.40% |
| RMBS | Rambus | | Semiconductor- | 56.53 | 42 | 0.16% | 3.38% |
| HBB | Hamilton Beach | | Electronic | 21.84 | 61 | -4.13% | 3.36% |
| PLTR | Palantir | | Software Infrastructure | 21.59 | 58 | -0.23% | 3.35% |
| ESE | ESCO | | Instruments | 104.28 | 90 | -0.32% | 3.33% |
| SPSC | SPS Commerce | | Software | 171.01 | 49 | 0.24% | 3.33% |
| STNE | StoneCo | | Software | 15.81 | 20 | 0.19% | 3.33% |
| For chart view version of above stock list: Chart View ➞ 0 - 25 , 25 - 50 , 50 - 75 , 75 - 100 , 100 - 125 , 125 - 150 , 150 - 175 , 175 - 200 , 200 - 225 , 225 - 250 , 250 - 275 , 275 - 300 , 300 - 325 , 325 - 350 , 350 - 375 , 375 - 400 , 400 - 425 , 425 - 450 , 450 - 475 , 475 - 500 , 500 - 525 , 525 - 550 , 550 - 575 , 575 - 600 , 600 - 625 , 625 - 650 | ||
 | Click To Change The Sort Order: By Market Cap or Company Size Performance: Year-to-date, Week and Day |  |
|
Get the most comprehensive stock market coverage daily at 12Stocks.com ➞ Best Stocks Today ➞ Best Stocks Weekly ➞ Best Stocks Year-to-Date ➞ Best Stocks Trends ➞  Best Stocks Today 12Stocks.com Best Nasdaq Stocks ➞ Best S&P 500 Stocks ➞ Best Tech Stocks ➞ Best Biotech Stocks ➞ |
| Detailed Overview of Tech Stocks |
| Tech Technical Overview, Leaders & Laggards, Top Tech ETF Funds & Detailed Tech Stocks List, Charts, Trends & More |
| Tech Sector: Technical Analysis, Trends & YTD Performance | |
| Technology sector is composed of stocks
from semiconductors, software, web, social media
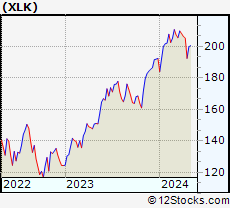
and services subsectors. Technology sector, as represented by XLK, an exchange-traded fund [ETF] that holds basket of tech stocks (e.g, Intel, Google) is up by 2.88% and is currently underperforming the overall market by -2.78% year-to-date. Below is a quick view of technical charts and trends: |
|
 XLK Weekly Chart |
|
| Long Term Trend: Good | |
| Medium Term Trend: Not Good | |
 XLK Daily Chart |
|
| Short Term Trend: Very Good | |
| Overall Trend Score: 32 | |
| YTD Performance: 2.88% | |
| **Trend Scores & Views Are Only For Educational Purposes And Not For Investing | |
| 12Stocks.com: Top Performing Technology Sector Stocks | ||||||||||||||||||||||||||||||||||||||||||||||||
 The top performing Technology sector stocks year to date are
Now, more recently, over last week, the top performing Technology sector stocks on the move are


|
||||||||||||||||||||||||||||||||||||||||||||||||
| 12Stocks.com: Investing in Tech Sector using Exchange Traded Funds | |
|
The following table shows list of key exchange traded funds (ETF) that
help investors track Tech Index. For detailed view, check out our ETF Funds section of our website. Quick View: Move mouse or cursor over ETF symbol (ticker) to view short-term technical chart and over ETF name to view long term chart. Click on ticker or stock name for detailed view. Click on to add stock symbol to your watchlist and to view watchlist. |
12Stocks.com List of ETFs that track Tech Index
| Ticker | ETF Name | Watchlist | Recent Price | Smart Investing & Trading Score | Change % | Week % | Year-to-date % |
| XLK | Technology | | 198.03 | 32 | 0.46 | 2.86 | 2.88% |
| QQQ | QQQ | | 426.44 | 58 | 0.32 | 2.84 | 4.13% |
| IYW | Technology | | 128.84 | 43 | 0.25 | 3.28 | 4.96% |
| VGT | Information Technology | | 495.24 | 30 | 0.16 | 3.2 | 2.32% |
| IXN | Global Tech | | 70.84 | 43 | 0.47 | 3.08 | 3.9% |
| IGV | Tech-Software | | 80.94 | 17 | 0.10 | 3.07 | -0.23% |
| XSD | Semiconductor | | 215.54 | 30 | 2.30 | 5.89 | -4.11% |
| TQQQ | QQQ | | 53.74 | 58 | 1.03 | 8.61 | 6% |
| SQQQ | Short QQQ | | 11.80 | 37 | -0.92 | -8.1 | -12.27% |
| SOXL | Semicondct Bull 3X | | 35.49 | 58 | 4.05 | 15.26 | 13.03% |
| SOXS | Semicondct Bear 3X | | 39.61 | 58 | -3.81 | -14.13 | 580.58% |
| SOXX | PHLX Semiconductor | | 208.62 | 43 | 1.34 | 5.16 | 8.64% |
| QTEC | First -100-Tech | | 181.22 | 30 | 0.73 | 4.19 | 3.28% |
| SMH | Semiconductor | | 208.11 | 58 | 0.15 | 4.47 | 19.01% |
| 12Stocks.com: Charts, Trends, Fundamental Data and Performances of Tech Stocks | |
|
We now take in-depth look at all Tech stocks including charts, multi-period performances and overall trends (as measured by Smart Investing & Trading Score). One can sort Tech stocks (click link to choose) by Daily, Weekly and by Year-to-Date performances. Also, one can sort by size of the company or by market capitalization. |
| Select Your Default Chart Type: | |||||
| |||||
| Click on stock symbol or name for detailed view. Click on to add stock symbol to your watchlist and to view watchlist. Quick View: Move mouse or cursor over "Daily" to quickly view daily technical stock chart and over "Weekly" to view weekly technical stock chart. | |||||


 | MLAB Mesa Laboratories, Inc. |
| Sector: Technology | |
| SubSector: Scientific & Technical Instruments | |
| MarketCap: 935.453 Millions | |
| Recent Price: 104.34 Smart Investing & Trading Score: 90 | |
| Day Percent Change: -2.14% Day Change: -2.28 | |
| Week Change: 3.57% Year-to-date Change: -0.4% | |
| MLAB Links: Profile News Message Board | |
| Charts:- Daily , Weekly | |
| Add MLAB to Watchlist: View: Get Complete MLAB Trend Analysis ➞ | |
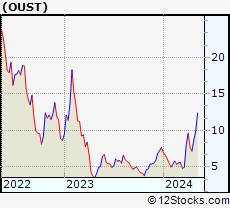 | OUST Ouster, Inc. |
| Sector: Technology | |
| SubSector: Electronic Components | |
| MarketCap: 193 Millions | |
| Recent Price: 7.42 Smart Investing & Trading Score: 68 | |
| Day Percent Change: -1.92% Day Change: -0.14 | |
| Week Change: 3.56% Year-to-date Change: -3.4% | |
| OUST Links: Profile News Message Board | |
| Charts:- Daily , Weekly | |
| Add OUST to Watchlist: View: Get Complete OUST Trend Analysis ➞ | |
 | ZBRA Zebra Technologies Corporation |
| Sector: Technology | |
| SubSector: Communication Equipment | |
| MarketCap: 11474.9 Millions | |
| Recent Price: 277.57 Smart Investing & Trading Score: 68 | |
| Day Percent Change: 0.37% Day Change: 1.01 | |
| Week Change: 3.54% Year-to-date Change: 1.6% | |
| ZBRA Links: Profile News Message Board | |
| Charts:- Daily , Weekly | |
| Add ZBRA to Watchlist: View: Get Complete ZBRA Trend Analysis ➞ | |
 | ANET Arista Networks, Inc. |
| Sector: Technology | |
| SubSector: Diversified Computer Systems | |
| MarketCap: 14071.2 Millions | |
| Recent Price: 254.77 Smart Investing & Trading Score: 32 | |
| Day Percent Change: 1.43% Day Change: 3.59 | |
| Week Change: 3.53% Year-to-date Change: 8.2% | |
| ANET Links: Profile News Message Board | |
| Charts:- Daily , Weekly | |
| Add ANET to Watchlist: View: Get Complete ANET Trend Analysis ➞ | |
 | SPOK Spok Holdings, Inc. |
| Sector: Technology | |
| SubSector: Wireless Communications | |
| MarketCap: 220.827 Millions | |
| Recent Price: 15.54 Smart Investing & Trading Score: 49 | |
| Day Percent Change: 0.91% Day Change: 0.14 | |
| Week Change: 3.53% Year-to-date Change: 0.4% | |
| SPOK Links: Profile News Message Board | |
| Charts:- Daily , Weekly | |
| Add SPOK to Watchlist: View: Get Complete SPOK Trend Analysis ➞ | |
 | TENB Tenable Holdings, Inc. |
| Sector: Technology | |
| SubSector: Business Software & Services | |
| MarketCap: 1986.68 Millions | |
| Recent Price: 46.40 Smart Investing & Trading Score: 10 | |
| Day Percent Change: 0.54% Day Change: 0.25 | |
| Week Change: 3.5% Year-to-date Change: 0.7% | |
| TENB Links: Profile News Message Board | |
| Charts:- Daily , Weekly | |
| Add TENB to Watchlist: View: Get Complete TENB Trend Analysis ➞ | |
 | RXT Rackspace Technology, Inc. |
| Sector: Technology | |
| SubSector: Software Infrastructure | |
| MarketCap: 40287 Millions | |
| Recent Price: 1.63 Smart Investing & Trading Score: 27 | |
| Day Percent Change: -2.98% Day Change: -0.05 | |
| Week Change: 3.49% Year-to-date Change: -18.7% | |
| RXT Links: Profile News Message Board | |
| Charts:- Daily , Weekly | |
| Add RXT to Watchlist: View: Get Complete RXT Trend Analysis ➞ | |
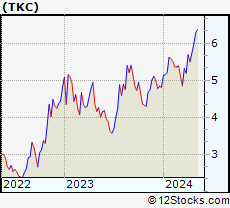 | TKC Turkcell Iletisim Hizmetleri A.S. |
| Sector: Technology | |
| SubSector: Wireless Communications | |
| MarketCap: 4587.67 Millions | |
| Recent Price: 5.94 Smart Investing & Trading Score: 100 | |
| Day Percent Change: 0.85% Day Change: 0.05 | |
| Week Change: 3.48% Year-to-date Change: 23.5% | |
| TKC Links: Profile News Message Board | |
| Charts:- Daily , Weekly | |
| Add TKC to Watchlist: View: Get Complete TKC Trend Analysis ➞ | |
 | MQ Marqeta, Inc. |
| Sector: Technology | |
| SubSector: Software - Infrastructure | |
| MarketCap: 2650 Millions | |
| Recent Price: 5.50 Smart Investing & Trading Score: 42 | |
| Day Percent Change: -2.92% Day Change: -0.17 | |
| Week Change: 3.48% Year-to-date Change: -21.9% | |
| MQ Links: Profile News Message Board | |
| Charts:- Daily , Weekly | |
| Add MQ to Watchlist: View: Get Complete MQ Trend Analysis ➞ | |
 | SNX SYNNEX Corporation |
| Sector: Technology | |
| SubSector: Information Technology Services | |
| MarketCap: 4519.48 Millions | |
| Recent Price: 117.24 Smart Investing & Trading Score: 85 | |
| Day Percent Change: 1.12% Day Change: 1.30 | |
| Week Change: 3.46% Year-to-date Change: 9.0% | |
| SNX Links: Profile News Message Board | |
| Charts:- Daily , Weekly | |
| Add SNX to Watchlist: View: Get Complete SNX Trend Analysis ➞ | |
 | GCT GigaCloud Technology Inc. |
| Sector: Technology | |
| SubSector: Software - Infrastructure | |
| MarketCap: 240 Millions | |
| Recent Price: 35.89 Smart Investing & Trading Score: 81 | |
| Day Percent Change: -2.97% Day Change: -1.10 | |
| Week Change: 3.46% Year-to-date Change: 96.0% | |
| GCT Links: Profile News Message Board | |
| Charts:- Daily , Weekly | |
| Add GCT to Watchlist: View: Get Complete GCT Trend Analysis ➞ | |
 | APPF AppFolio, Inc. |
| Sector: Technology | |
| SubSector: Application Software | |
| MarketCap: 3412.02 Millions | |
| Recent Price: 215.72 Smart Investing & Trading Score: 32 | |
| Day Percent Change: -1.65% Day Change: -3.61 | |
| Week Change: 3.46% Year-to-date Change: 24.5% | |
| APPF Links: Profile News Message Board | |
| Charts:- Daily , Weekly | |
| Add APPF to Watchlist: View: Get Complete APPF Trend Analysis ➞ | |
 | AMD Advanced Micro Devices, Inc. |
| Sector: Technology | |
| SubSector: Semiconductor - Broad Line | |
| MarketCap: 54275.1 Millions | |
| Recent Price: 151.68 Smart Investing & Trading Score: 32 | |
| Day Percent Change: -0.39% Day Change: -0.59 | |
| Week Change: 3.44% Year-to-date Change: 2.9% | |
| AMD Links: Profile News Message Board | |
| Charts:- Daily , Weekly | |
| Add AMD to Watchlist: View: Get Complete AMD Trend Analysis ➞ | |
 | USM United States Cellular Corporation |
| Sector: Technology | |
| SubSector: Wireless Communications | |
| MarketCap: 2587.67 Millions | |
| Recent Price: 36.77 Smart Investing & Trading Score: 64 | |
| Day Percent Change: 2.80% Day Change: 1.00 | |
| Week Change: 3.43% Year-to-date Change: -11.5% | |
| USM Links: Profile News Message Board | |
| Charts:- Daily , Weekly | |
| Add USM to Watchlist: View: Get Complete USM Trend Analysis ➞ | |
 | GOOG Alphabet Inc. |
| Sector: Technology | |
| SubSector: Internet Information Providers | |
| MarketCap: 730159 Millions | |
| Recent Price: 161.05 Smart Investing & Trading Score: 100 | |
| Day Percent Change: 0.71% Day Change: 1.13 | |
| Week Change: 3.42% Year-to-date Change: 14.3% | |
| GOOG Links: Profile News Message Board | |
| Charts:- Daily , Weekly | |
| Add GOOG to Watchlist: View: Get Complete GOOG Trend Analysis ➞ | |
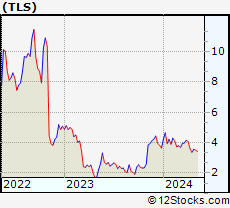 | TLS Telos Corporation |
| Sector: Technology | |
| SubSector: Information Technology Services | |
| MarketCap: 11787 Millions | |
| Recent Price: 3.48 Smart Investing & Trading Score: 37 | |
| Day Percent Change: 1.31% Day Change: 0.04 | |
| Week Change: 3.41% Year-to-date Change: -4.5% | |
| TLS Links: Profile News Message Board | |
| Charts:- Daily , Weekly | |
| Add TLS to Watchlist: View: Get Complete TLS Trend Analysis ➞ | |
 | CIEN Ciena Corporation |
| Sector: Technology | |
| SubSector: Communication Equipment | |
| MarketCap: 6206.99 Millions | |
| Recent Price: 45.04 Smart Investing & Trading Score: 42 | |
| Day Percent Change: 0.72% Day Change: 0.32 | |
| Week Change: 3.4% Year-to-date Change: 0.1% | |
| CIEN Links: Profile News Message Board | |
| Charts:- Daily , Weekly | |
| Add CIEN to Watchlist: View: Get Complete CIEN Trend Analysis ➞ | |
 | AMAT Applied Materials, Inc. |
| Sector: Technology | |
| SubSector: Semiconductor Equipment & Materials | |
| MarketCap: 40593.8 Millions | |
| Recent Price: 196.22 Smart Investing & Trading Score: 63 | |
| Day Percent Change: 1.54% Day Change: 2.98 | |
| Week Change: 3.4% Year-to-date Change: 21.1% | |
| AMAT Links: Profile News Message Board | |
| Charts:- Daily , Weekly | |
| Add AMAT to Watchlist: View: Get Complete AMAT Trend Analysis ➞ | |
 | AEIS Advanced Energy Industries, Inc. |
| Sector: Technology | |
| SubSector: Diversified Electronics | |
| MarketCap: 1641.86 Millions | |
| Recent Price: 92.75 Smart Investing & Trading Score: 42 | |
| Day Percent Change: -0.38% Day Change: -0.35 | |
| Week Change: 3.4% Year-to-date Change: -14.9% | |
| AEIS Links: Profile News Message Board | |
| Charts:- Daily , Weekly | |
| Add AEIS to Watchlist: View: Get Complete AEIS Trend Analysis ➞ | |
 | RMBS Rambus Inc. |
| Sector: Technology | |
| SubSector: Semiconductor- Memory Chips | |
| MarketCap: 1296 Millions | |
| Recent Price: 56.53 Smart Investing & Trading Score: 42 | |
| Day Percent Change: 0.16% Day Change: 0.09 | |
| Week Change: 3.38% Year-to-date Change: -17.2% | |
| RMBS Links: Profile News Message Board | |
| Charts:- Daily , Weekly | |
| Add RMBS to Watchlist: View: Get Complete RMBS Trend Analysis ➞ | |
 | HBB Hamilton Beach Brands Holding Company |
| Sector: Technology | |
| SubSector: Electronic Equipment | |
| MarketCap: 105.7 Millions | |
| Recent Price: 21.84 Smart Investing & Trading Score: 61 | |
| Day Percent Change: -4.13% Day Change: -0.94 | |
| Week Change: 3.36% Year-to-date Change: 24.9% | |
| HBB Links: Profile News Message Board | |
| Charts:- Daily , Weekly | |
| Add HBB to Watchlist: View: Get Complete HBB Trend Analysis ➞ | |
 | PLTR Palantir Technologies Inc. |
| Sector: Technology | |
| SubSector: Software Infrastructure | |
| MarketCap: 47107 Millions | |
| Recent Price: 21.59 Smart Investing & Trading Score: 58 | |
| Day Percent Change: -0.23% Day Change: -0.05 | |
| Week Change: 3.35% Year-to-date Change: 25.7% | |
| PLTR Links: Profile News Message Board | |
| Charts:- Daily , Weekly | |
| Add PLTR to Watchlist: View: Get Complete PLTR Trend Analysis ➞ | |
 | ESE ESCO Technologies Inc. |
| Sector: Technology | |
| SubSector: Scientific & Technical Instruments | |
| MarketCap: 1968.03 Millions | |
| Recent Price: 104.28 Smart Investing & Trading Score: 90 | |
| Day Percent Change: -0.32% Day Change: -0.34 | |
| Week Change: 3.33% Year-to-date Change: -10.9% | |
| ESE Links: Profile News Message Board | |
| Charts:- Daily , Weekly | |
| Add ESE to Watchlist: View: Get Complete ESE Trend Analysis ➞ | |
 | SPSC SPS Commerce, Inc. |
| Sector: Technology | |
| SubSector: Application Software | |
| MarketCap: 1398.02 Millions | |
| Recent Price: 171.01 Smart Investing & Trading Score: 49 | |
| Day Percent Change: 0.24% Day Change: 0.41 | |
| Week Change: 3.33% Year-to-date Change: -11.8% | |
| SPSC Links: Profile News Message Board | |
| Charts:- Daily , Weekly | |
| Add SPSC to Watchlist: View: Get Complete SPSC Trend Analysis ➞ | |
 | STNE StoneCo Ltd. |
| Sector: Technology | |
| SubSector: Application Software | |
| MarketCap: 7347.82 Millions | |
| Recent Price: 15.81 Smart Investing & Trading Score: 20 | |
| Day Percent Change: 0.19% Day Change: 0.03 | |
| Week Change: 3.33% Year-to-date Change: -12.3% | |
| STNE Links: Profile News Message Board | |
| Charts:- Daily , Weekly | |
| Add STNE to Watchlist: View: Get Complete STNE Trend Analysis ➞ | |
| For tabular summary view of above stock list: Summary View ➞ 0 - 25 , 25 - 50 , 50 - 75 , 75 - 100 , 100 - 125 , 125 - 150 , 150 - 175 , 175 - 200 , 200 - 225 , 225 - 250 , 250 - 275 , 275 - 300 , 300 - 325 , 325 - 350 , 350 - 375 , 375 - 400 , 400 - 425 , 425 - 450 , 450 - 475 , 475 - 500 , 500 - 525 , 525 - 550 , 550 - 575 , 575 - 600 , 600 - 625 , 625 - 650 | ||
| Click To Change The Sort Order: By Market Cap or Company Size Performance: Year-to-date, Week and Day | |
| Select Chart Type: | ||
|
Best Stocks Today 12Stocks.com |
© 2024 12Stocks.com Terms & Conditions Privacy Contact Us
All Information Provided Only For Education And Not To Be Used For Investing or Trading. See Terms & Conditions


One More Thing ... Get Best Stocks Delivered Daily!
Never Ever Miss A Move With Our Top Ten Stocks Lists
Find Best Stocks In Any Market - Bull or Bear Market
Take A Peek At Our Top Ten Stocks Lists: Daily, Weekly, Year-to-Date & Top Trends
Find Best Stocks In Any Market - Bull or Bear Market
Take A Peek At Our Top Ten Stocks Lists: Daily, Weekly, Year-to-Date & Top Trends
Technology Stocks With Best Up Trends [0-bearish to 100-bullish]: Amesite [100], Ribbon [100], Allegro MicroSystems[100], Texas [100], Microchip [100], EchoStar [100], Analog Devices[100], Vishay Inter[100], JD.com [100], Sea [100], Jamf Holding[100]
Best Technology Stocks Year-to-Date:
Pagaya [581.02%], MicroCloud Hologram[574.82%], MediaCo Holding[364.79%], Uxin [169.61%], CXApp [167.95%], Super Micro[165.69%], Smith Micro[158.47%], SoundHound AI[103.27%], MicroStrategy [100.3%], GigaCloud [96.01%], NextNav [95.73%] Best Technology Stocks This Week:
Matterport [166.09%], Amesite [69.72%], WiMi Hologram[64.85%], Ribbon [25.78%], HashiCorp [23.7%], SoundHound AI[22.54%], Intchains [20.36%], iQIYI [17.87%], Bilibili [16.91%], FTC Solar[16.56%], BigBear.ai [16.55%] Best Technology Stocks Daily:
Amesite [65.50%], WiMi Hologram[58.53%], Ribbon [26.26%], Intchains [22.28%], Uxin [13.86%], Bilibili [11.01%], Comtech Tele[10.76%], Navitas Semiconductor[8.83%], FTC Solar[8.51%], AMTD Digital[8.33%], Allegro MicroSystems[8.24%]