
 Login Sign Up


| |||||
 |  | ||||

| 12Stocks.com Market Intelligence |
Best Tech Stocks
| In a hurry? Tech Stocks Lists: Performance & Trends, Stock Charts, FANG Stocks
Sort Tech stocks: Daily, Weekly, Year-to-Date, Market Cap & Trends. Filter Tech stocks list by size:All Tech Large Mid-Range Small and MicroCap |
| 12Stocks.com Tech Stocks Performances & Trends Daily | |||||||||
|
|  The overall Smart Investing & Trading Score is 58 (0-bearish to 100-bullish) which puts Technology sector in short term neutral trend. The Smart Investing & Trading Score from previous trading session is 38 and hence an improvement of trend.
| ||||||||
Here are the Smart Investing & Trading Scores of the most requested Technology stocks at 12Stocks.com (click stock name for detailed review):
|


| 12Stocks.com: Investing in Technology sector with Stocks | |
|
The following table helps investors and traders sort through current performance and trends (as measured by Smart Investing & Trading Score) of various
stocks in the Tech sector. Quick View: Move mouse or cursor over stock symbol (ticker) to view short-term technical chart and over stock name to view long term chart. Click on  to add stock symbol to your watchlist and to add stock symbol to your watchlist and  to view watchlist. Click on any ticker or stock name for detailed market intelligence report for that stock. to view watchlist. Click on any ticker or stock name for detailed market intelligence report for that stock. |
12Stocks.com Performance of Stocks in Tech Sector
| Ticker | Stock Name | Watchlist | Category | Recent Price | Smart Investing & Trading Score | Change % | YTD Change% |
| SAP | SAP SE |   | Software | 186.18 | 65 | 0.59% | 20.43% |
| VOD | Vodafone | | Wireless | 8.62 | 65 | 0.12% | -0.92% |
| VCSA | Vacasa | | Software - | 7.52 | 64 | 9.30% | -8.29% |
| TIGR | UP Fintech | | Software | 3.55 | 64 | 8.56% | -19.68% |
| AFRM | Affirm | | Software - Infrastructure | 33.34 | 64 | 5.34% | -31.90% |
| ASAN | Asana | | Software | 15.08 | 64 | 4.22% | -20.67% |
| SNOW | Snowflake | | Software | 158.13 | 64 | 3.69% | -20.54% |
| ESTC | Elastic N.V | | Software | 107.43 | 64 | 2.52% | -4.68% |
| GRPN | on | | Internet | 11.67 | 64 | 1.74% | -9.11% |
| USM | United States | | Wireless | 36.78 | 64 | 1.69% | -11.46% |
| INTA | Intapp | | Software - | 31.90 | 64 | 1.43% | -16.43% |
| CCOI | Cogent | | Communication | 65.79 | 64 | 1.32% | -13.50% |
| DT | Dynatrace | | Software | 47.10 | 64 | 1.07% | -13.88% |
| IDCC | InterDigital | | Wireless | 100.71 | 64 | 0.80% | -7.21% |
| TYL | Tyler | | Software | 460.74 | 64 | 0.58% | 10.19% |
| QLYS | Qualys | | Software | 170.36 | 64 | 0.37% | -13.21% |
| IPGP | IPG Photonics | | Semiconductor | 88.40 | 64 | 0.18% | -18.56% |
| MODN | Model N | | Software | 29.64 | 64 | 0.07% | 10.06% |
| SOUN | SoundHound AI | | Software - | 4.41 | 63 | 5.89% | 105.84% |
| DASH | DoorDash | | Internet Content & Information | 132.09 | 63 | 4.59% | 33.68% |
| HOOD | Robinhood Markets | | Software - Infrastructure | 17.89 | 63 | 4.50% | 41.09% |
| MKSI | MKS | | Instruments | 120.75 | 63 | 3.85% | 17.38% |
| ICHR | Ichor | | Semiconductor | 39.35 | 63 | 3.15% | 17.01% |
| AMAT | Applied Materials | | Semiconductor | 203.38 | 63 | 2.98% | 25.49% |
| UCTT | Ultra Clean | | Semiconductor | 41.96 | 63 | 2.79% | 22.91% |
| For chart view version of above stock list: Chart View ➞ 0 - 25 , 25 - 50 , 50 - 75 , 75 - 100 , 100 - 125 , 125 - 150 , 150 - 175 , 175 - 200 , 200 - 225 , 225 - 250 , 250 - 275 , 275 - 300 , 300 - 325 , 325 - 350 , 350 - 375 , 375 - 400 , 400 - 425 , 425 - 450 , 450 - 475 , 475 - 500 , 500 - 525 , 525 - 550 , 550 - 575 , 575 - 600 , 600 - 625 , 625 - 650 | ||
 | Click To Change The Sort Order: By Market Cap or Company Size Performance: Year-to-date, Week and Day |  |
|
Get the most comprehensive stock market coverage daily at 12Stocks.com ➞ Best Stocks Today ➞ Best Stocks Weekly ➞ Best Stocks Year-to-Date ➞ Best Stocks Trends ➞  Best Stocks Today 12Stocks.com Best Nasdaq Stocks ➞ Best S&P 500 Stocks ➞ Best Tech Stocks ➞ Best Biotech Stocks ➞ |
| Detailed Overview of Tech Stocks |
| Tech Technical Overview, Leaders & Laggards, Top Tech ETF Funds & Detailed Tech Stocks List, Charts, Trends & More |
| Tech Sector: Technical Analysis, Trends & YTD Performance | |
| Technology sector is composed of stocks
from semiconductors, software, web, social media
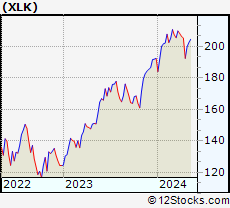
and services subsectors. Technology sector, as represented by XLK, an exchange-traded fund [ETF] that holds basket of tech stocks (e.g, Intel, Google) is up by 3.82% and is currently underperforming the overall market by -2.32% year-to-date. Below is a quick view of technical charts and trends: |
|
 XLK Weekly Chart |
|
| Long Term Trend: Good | |
| Medium Term Trend: Not Good | |
 XLK Daily Chart |
|
| Short Term Trend: Very Good | |
| Overall Trend Score: 58 | |
| YTD Performance: 3.82% | |
| **Trend Scores & Views Are Only For Educational Purposes And Not For Investing | |
| 12Stocks.com: Top Performing Technology Sector Stocks | ||||||||||||||||||||||||||||||||||||||||||||||||
 The top performing Technology sector stocks year to date are
Now, more recently, over last week, the top performing Technology sector stocks on the move are


|
||||||||||||||||||||||||||||||||||||||||||||||||
| 12Stocks.com: Investing in Tech Sector using Exchange Traded Funds | |
|
The following table shows list of key exchange traded funds (ETF) that
help investors track Tech Index. For detailed view, check out our ETF Funds section of our website. Quick View: Move mouse or cursor over ETF symbol (ticker) to view short-term technical chart and over ETF name to view long term chart. Click on ticker or stock name for detailed view. Click on to add stock symbol to your watchlist and to view watchlist. |
12Stocks.com List of ETFs that track Tech Index
| Ticker | ETF Name | Watchlist | Recent Price | Smart Investing & Trading Score | Change % | Week % | Year-to-date % |
| XLK | Technology | | 199.83 | 58 | 1.13 | 3.79 | 3.82% |
| QQQ | QQQ | | 431.00 | 58 | 1.54 | 3.94 | 5.25% |
| IYW | Technology | | 130.95 | 58 | 2.15 | 4.97 | 6.68% |
| VGT | Information Technology | | 503.94 | 45 | 1.72 | 5.01 | 4.12% |
| IXN | Global Tech | | 71.80 | 43 | 1.48 | 4.48 | 5.31% |
| IGV | Tech-Software | | 81.09 | 32 | 1.12 | 3.26 | -0.05% |
| XSD | Semiconductor | | 224.69 | 37 | 1.84 | 10.38 | -0.04% |
| TQQQ | QQQ | | 55.28 | 58 | 4.60 | 11.72 | 9.03% |
| SQQQ | Short QQQ | | 11.43 | 32 | -4.75 | -10.98 | -15.02% |
| SOXL | Semicondct Bull 3X | | 39.75 | 63 | 6.26 | 29.1 | 26.59% |
| SOXS | Semicondct Bear 3X | | 35.10 | 51 | -6.25 | -23.91 | 503.09% |
| SOXX | PHLX Semiconductor | | 216.90 | 58 | 2.11 | 9.33 | 12.95% |
| QTEC | First -100-Tech | | 183.99 | 65 | 1.55 | 5.78 | 4.86% |
| SMH | Semiconductor | | 217.64 | 63 | 2.56 | 9.25 | 24.46% |
| 12Stocks.com: Charts, Trends, Fundamental Data and Performances of Tech Stocks | |
|
We now take in-depth look at all Tech stocks including charts, multi-period performances and overall trends (as measured by Smart Investing & Trading Score). One can sort Tech stocks (click link to choose) by Daily, Weekly and by Year-to-Date performances. Also, one can sort by size of the company or by market capitalization. |
| Select Your Default Chart Type: | |||||
| |||||
| Click on stock symbol or name for detailed view. Click on to add stock symbol to your watchlist and to view watchlist. Quick View: Move mouse or cursor over "Daily" to quickly view daily technical stock chart and over "Weekly" to view weekly technical stock chart. | |||||


 | SAP SAP SE |
| Sector: Technology | |
| SubSector: Application Software | |
| MarketCap: 129635 Millions | |
| Recent Price: 186.18 Smart Investing & Trading Score: 65 | |
| Day Percent Change: 0.59% Day Change: 1.09 | |
| Week Change: 5.92% Year-to-date Change: 20.4% | |
| SAP Links: Profile News Message Board | |
| Charts:- Daily , Weekly | |
| Add SAP to Watchlist: View: Get Complete SAP Trend Analysis ➞ | |
 | VOD Vodafone Group Plc |
| Sector: Technology | |
| SubSector: Wireless Communications | |
| MarketCap: 38154.7 Millions | |
| Recent Price: 8.62 Smart Investing & Trading Score: 65 | |
| Day Percent Change: 0.12% Day Change: 0.01 | |
| Week Change: 3.36% Year-to-date Change: -0.9% | |
| VOD Links: Profile News Message Board | |
| Charts:- Daily , Weekly | |
| Add VOD to Watchlist: View: Get Complete VOD Trend Analysis ➞ | |
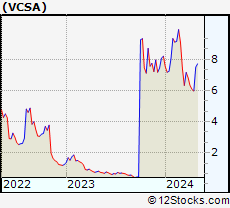 | VCSA Vacasa, Inc. |
| Sector: Technology | |
| SubSector: Software - Application | |
| MarketCap: 285 Millions | |
| Recent Price: 7.52 Smart Investing & Trading Score: 64 | |
| Day Percent Change: 9.30% Day Change: 0.64 | |
| Week Change: 25.96% Year-to-date Change: -8.3% | |
| VCSA Links: Profile News Message Board | |
| Charts:- Daily , Weekly | |
| Add VCSA to Watchlist: View: Get Complete VCSA Trend Analysis ➞ | |
 | TIGR UP Fintech Holding Limited |
| Sector: Technology | |
| SubSector: Application Software | |
| MarketCap: 385.062 Millions | |
| Recent Price: 3.55 Smart Investing & Trading Score: 64 | |
| Day Percent Change: 8.56% Day Change: 0.28 | |
| Week Change: 12.7% Year-to-date Change: -19.7% | |
| TIGR Links: Profile News Message Board | |
| Charts:- Daily , Weekly | |
| Add TIGR to Watchlist: View: Get Complete TIGR Trend Analysis ➞ | |
 | AFRM Affirm Holdings, Inc. |
| Sector: Technology | |
| SubSector: Software - Infrastructure | |
| MarketCap: 4560 Millions | |
| Recent Price: 33.34 Smart Investing & Trading Score: 64 | |
| Day Percent Change: 5.34% Day Change: 1.69 | |
| Week Change: 7.51% Year-to-date Change: -31.9% | |
| AFRM Links: Profile News Message Board | |
| Charts:- Daily , Weekly | |
| Add AFRM to Watchlist: View: Get Complete AFRM Trend Analysis ➞ | |
 | ASAN Asana, Inc. |
| Sector: Technology | |
| SubSector: Software Application | |
| MarketCap: 45087 Millions | |
| Recent Price: 15.08 Smart Investing & Trading Score: 64 | |
| Day Percent Change: 4.22% Day Change: 0.61 | |
| Week Change: 10.88% Year-to-date Change: -20.7% | |
| ASAN Links: Profile News Message Board | |
| Charts:- Daily , Weekly | |
| Add ASAN to Watchlist: View: Get Complete ASAN Trend Analysis ➞ | |
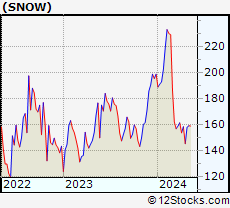 | SNOW Snowflake Inc. |
| Sector: Technology | |
| SubSector: Software Application | |
| MarketCap: 10567 Millions | |
| Recent Price: 158.13 Smart Investing & Trading Score: 64 | |
| Day Percent Change: 3.69% Day Change: 5.63 | |
| Week Change: 8.72% Year-to-date Change: -20.5% | |
| SNOW Links: Profile News Message Board | |
| Charts:- Daily , Weekly | |
| Add SNOW to Watchlist: View: Get Complete SNOW Trend Analysis ➞ | |
 | ESTC Elastic N.V. |
| Sector: Technology | |
| SubSector: Application Software | |
| MarketCap: 4420.92 Millions | |
| Recent Price: 107.43 Smart Investing & Trading Score: 64 | |
| Day Percent Change: 2.52% Day Change: 2.64 | |
| Week Change: 11.69% Year-to-date Change: -4.7% | |
| ESTC Links: Profile News Message Board | |
| Charts:- Daily , Weekly | |
| Add ESTC to Watchlist: View: Get Complete ESTC Trend Analysis ➞ | |
 | GRPN Groupon, Inc. |
| Sector: Technology | |
| SubSector: Internet Information Providers | |
| MarketCap: 363.18 Millions | |
| Recent Price: 11.67 Smart Investing & Trading Score: 64 | |
| Day Percent Change: 1.74% Day Change: 0.20 | |
| Week Change: 22.71% Year-to-date Change: -9.1% | |
| GRPN Links: Profile News Message Board | |
| Charts:- Daily , Weekly | |
| Add GRPN to Watchlist: View: Get Complete GRPN Trend Analysis ➞ | |
 | USM United States Cellular Corporation |
| Sector: Technology | |
| SubSector: Wireless Communications | |
| MarketCap: 2587.67 Millions | |
| Recent Price: 36.78 Smart Investing & Trading Score: 64 | |
| Day Percent Change: 1.69% Day Change: 0.61 | |
| Week Change: 3.46% Year-to-date Change: -11.5% | |
| USM Links: Profile News Message Board | |
| Charts:- Daily , Weekly | |
| Add USM to Watchlist: View: Get Complete USM Trend Analysis ➞ | |
 | INTA Intapp, Inc. |
| Sector: Technology | |
| SubSector: Software - Application | |
| MarketCap: 2820 Millions | |
| Recent Price: 31.90 Smart Investing & Trading Score: 64 | |
| Day Percent Change: 1.43% Day Change: 0.45 | |
| Week Change: 3.71% Year-to-date Change: -16.4% | |
| INTA Links: Profile News Message Board | |
| Charts:- Daily , Weekly | |
| Add INTA to Watchlist: View: Get Complete INTA Trend Analysis ➞ | |
 | CCOI Cogent Communications Holdings, Inc. |
| Sector: Technology | |
| SubSector: Diversified Communication Services | |
| MarketCap: 3868.14 Millions | |
| Recent Price: 65.79 Smart Investing & Trading Score: 64 | |
| Day Percent Change: 1.32% Day Change: 0.86 | |
| Week Change: 3.95% Year-to-date Change: -13.5% | |
| CCOI Links: Profile News Message Board | |
| Charts:- Daily , Weekly | |
| Add CCOI to Watchlist: View: Get Complete CCOI Trend Analysis ➞ | |
 | DT Dynatrace, Inc. |
| Sector: Technology | |
| SubSector: Application Software | |
| MarketCap: 7007.12 Millions | |
| Recent Price: 47.10 Smart Investing & Trading Score: 64 | |
| Day Percent Change: 1.07% Day Change: 0.50 | |
| Week Change: 3.74% Year-to-date Change: -13.9% | |
| DT Links: Profile News Message Board | |
| Charts:- Daily , Weekly | |
| Add DT to Watchlist: View: Get Complete DT Trend Analysis ➞ | |
 | IDCC InterDigital, Inc. |
| Sector: Technology | |
| SubSector: Wireless Communications | |
| MarketCap: 1225.27 Millions | |
| Recent Price: 100.71 Smart Investing & Trading Score: 64 | |
| Day Percent Change: 0.80% Day Change: 0.80 | |
| Week Change: 4.22% Year-to-date Change: -7.2% | |
| IDCC Links: Profile News Message Board | |
| Charts:- Daily , Weekly | |
| Add IDCC to Watchlist: View: Get Complete IDCC Trend Analysis ➞ | |
 | TYL Tyler Technologies, Inc. |
| Sector: Technology | |
| SubSector: Technical & System Software | |
| MarketCap: 10785 Millions | |
| Recent Price: 460.74 Smart Investing & Trading Score: 64 | |
| Day Percent Change: 0.58% Day Change: 2.67 | |
| Week Change: 14.23% Year-to-date Change: 10.2% | |
| TYL Links: Profile News Message Board | |
| Charts:- Daily , Weekly | |
| Add TYL to Watchlist: View: Get Complete TYL Trend Analysis ➞ | |
 | QLYS Qualys, Inc. |
| Sector: Technology | |
| SubSector: Application Software | |
| MarketCap: 3475.02 Millions | |
| Recent Price: 170.36 Smart Investing & Trading Score: 64 | |
| Day Percent Change: 0.37% Day Change: 0.62 | |
| Week Change: 4.16% Year-to-date Change: -13.2% | |
| QLYS Links: Profile News Message Board | |
| Charts:- Daily , Weekly | |
| Add QLYS to Watchlist: View: Get Complete QLYS Trend Analysis ➞ | |
 | IPGP IPG Photonics Corporation |
| Sector: Technology | |
| SubSector: Semiconductor Equipment & Materials | |
| MarketCap: 6059.38 Millions | |
| Recent Price: 88.40 Smart Investing & Trading Score: 64 | |
| Day Percent Change: 0.18% Day Change: 0.16 | |
| Week Change: 4.9% Year-to-date Change: -18.6% | |
| IPGP Links: Profile News Message Board | |
| Charts:- Daily , Weekly | |
| Add IPGP to Watchlist: View: Get Complete IPGP Trend Analysis ➞ | |
 | MODN Model N, Inc. |
| Sector: Technology | |
| SubSector: Application Software | |
| MarketCap: 670.162 Millions | |
| Recent Price: 29.64 Smart Investing & Trading Score: 64 | |
| Day Percent Change: 0.07% Day Change: 0.02 | |
| Week Change: 0.07% Year-to-date Change: 10.1% | |
| MODN Links: Profile News Message Board | |
| Charts:- Daily , Weekly | |
| Add MODN to Watchlist: View: Get Complete MODN Trend Analysis ➞ | |
 | SOUN SoundHound AI, Inc. |
| Sector: Technology | |
| SubSector: Software - Application | |
| MarketCap: 1040 Millions | |
| Recent Price: 4.41 Smart Investing & Trading Score: 63 | |
| Day Percent Change: 5.89% Day Change: 0.25 | |
| Week Change: 24.08% Year-to-date Change: 105.8% | |
| SOUN Links: Profile News Message Board | |
| Charts:- Daily , Weekly | |
| Add SOUN to Watchlist: View: Get Complete SOUN Trend Analysis ➞ | |
 | DASH DoorDash, Inc. |
| Sector: Technology | |
| SubSector: Internet Content & Information | |
| MarketCap: 59087 Millions | |
| Recent Price: 132.09 Smart Investing & Trading Score: 63 | |
| Day Percent Change: 4.59% Day Change: 5.80 | |
| Week Change: 3.62% Year-to-date Change: 33.7% | |
| DASH Links: Profile News Message Board | |
| Charts:- Daily , Weekly | |
| Add DASH to Watchlist: View: Get Complete DASH Trend Analysis ➞ | |
 | HOOD Robinhood Markets, Inc. |
| Sector: Technology | |
| SubSector: Software - Infrastructure | |
| MarketCap: 9200 Millions | |
| Recent Price: 17.89 Smart Investing & Trading Score: 63 | |
| Day Percent Change: 4.50% Day Change: 0.77 | |
| Week Change: 7.58% Year-to-date Change: 41.1% | |
| HOOD Links: Profile News Message Board | |
| Charts:- Daily , Weekly | |
| Add HOOD to Watchlist: View: Get Complete HOOD Trend Analysis ➞ | |
 | MKSI MKS Instruments, Inc. |
| Sector: Technology | |
| SubSector: Scientific & Technical Instruments | |
| MarketCap: 4502.93 Millions | |
| Recent Price: 120.75 Smart Investing & Trading Score: 63 | |
| Day Percent Change: 3.85% Day Change: 4.48 | |
| Week Change: 11.63% Year-to-date Change: 17.4% | |
| MKSI Links: Profile News Message Board | |
| Charts:- Daily , Weekly | |
| Add MKSI to Watchlist: View: Get Complete MKSI Trend Analysis ➞ | |
 | ICHR Ichor Holdings, Ltd. |
| Sector: Technology | |
| SubSector: Semiconductor Equipment & Materials | |
| MarketCap: 409.018 Millions | |
| Recent Price: 39.35 Smart Investing & Trading Score: 63 | |
| Day Percent Change: 3.15% Day Change: 1.20 | |
| Week Change: 6.73% Year-to-date Change: 17.0% | |
| ICHR Links: Profile News Message Board | |
| Charts:- Daily , Weekly | |
| Add ICHR to Watchlist: View: Get Complete ICHR Trend Analysis ➞ | |
 | AMAT Applied Materials, Inc. |
| Sector: Technology | |
| SubSector: Semiconductor Equipment & Materials | |
| MarketCap: 40593.8 Millions | |
| Recent Price: 203.38 Smart Investing & Trading Score: 63 | |
| Day Percent Change: 2.98% Day Change: 5.88 | |
| Week Change: 7.17% Year-to-date Change: 25.5% | |
| AMAT Links: Profile News Message Board | |
| Charts:- Daily , Weekly | |
| Add AMAT to Watchlist: View: Get Complete AMAT Trend Analysis ➞ | |
 | UCTT Ultra Clean Holdings, Inc. |
| Sector: Technology | |
| SubSector: Semiconductor Equipment & Materials | |
| MarketCap: 528.518 Millions | |
| Recent Price: 41.96 Smart Investing & Trading Score: 63 | |
| Day Percent Change: 2.79% Day Change: 1.14 | |
| Week Change: 7.62% Year-to-date Change: 22.9% | |
| UCTT Links: Profile News Message Board | |
| Charts:- Daily , Weekly | |
| Add UCTT to Watchlist: View: Get Complete UCTT Trend Analysis ➞ | |
| For tabular summary view of above stock list: Summary View ➞ 0 - 25 , 25 - 50 , 50 - 75 , 75 - 100 , 100 - 125 , 125 - 150 , 150 - 175 , 175 - 200 , 200 - 225 , 225 - 250 , 250 - 275 , 275 - 300 , 300 - 325 , 325 - 350 , 350 - 375 , 375 - 400 , 400 - 425 , 425 - 450 , 450 - 475 , 475 - 500 , 500 - 525 , 525 - 550 , 550 - 575 , 575 - 600 , 600 - 625 , 625 - 650 | ||
| Click To Change The Sort Order: By Market Cap or Company Size Performance: Year-to-date, Week and Day | |
| Select Chart Type: | ||
|
Best Stocks Today 12Stocks.com |
© 2024 12Stocks.com Terms & Conditions Privacy Contact Us
All Information Provided Only For Education And Not To Be Used For Investing or Trading. See Terms & Conditions


One More Thing ... Get Best Stocks Delivered Daily!
Never Ever Miss A Move With Our Top Ten Stocks Lists
Find Best Stocks In Any Market - Bull or Bear Market
Take A Peek At Our Top Ten Stocks Lists: Daily, Weekly, Year-to-Date & Top Trends
Find Best Stocks In Any Market - Bull or Bear Market
Take A Peek At Our Top Ten Stocks Lists: Daily, Weekly, Year-to-Date & Top Trends
Technology Stocks With Best Up Trends [0-bearish to 100-bullish]: NextNav [100], Alphabet [100], WiMi Hologram[100], Alphabet [100], Amesite [100], JD.com [100], ZoomInfo [100], KLA [100], Teradyne [100], Full Truck[100], Allegro MicroSystems[100]
Best Technology Stocks Year-to-Date:
MediaCo Holding[292.02%], Super Micro[201.64%], CXApp [185.71%], Smith Micro[180.87%], Uxin [159.63%], CuriosityStream [109.22%], NextNav [106.52%], SoundHound AI[105.84%], MicroStrategy [103.03%], GigaCloud [93.17%], Cheetah Mobile[86.84%] Best Technology Stocks This Week:
Matterport [170.98%], Amesite [69.2%], WiMi Hologram[46.93%], HashiCorp [36.05%], Snap [30.38%], Impinj [29.74%], IonQ [26.52%], Vacasa [25.96%], SoundHound AI[24.08%], GDS [22.78%], on [22.71%] Best Technology Stocks Daily:
Snap [27.63%], Maxeon Solar[20.17%], Ouster [19.68%], OptimizeRx [14.84%], AppFolio [12.05%], NextNav [11.19%], Mynaric AG[10.61%], Rogers [10.49%], Stem [10.24%], Alphabet [10.22%], PowerFleet [10.11%]