
 Login Sign Up


| |||||
 |  | ||||

| 12Stocks.com Market Intelligence |
Best Tech Stocks
| In a hurry? Tech Stocks Lists: Performance & Trends, Stock Charts, FANG Stocks
Sort Tech stocks: Daily, Weekly, Year-to-Date, Market Cap & Trends. Filter Tech stocks list by size:All Tech Large Mid-Range Small and MicroCap |
| 12Stocks.com Tech Stocks Performances & Trends Daily | |||||||||
|
|  The overall Smart Investing & Trading Score is 38 (0-bearish to 100-bullish) which puts Technology sector in short term bearish to neutral trend. The Smart Investing & Trading Score from previous trading session is 10 and hence an improvement of trend.
| ||||||||
Here are the Smart Investing & Trading Scores of the most requested Technology stocks at 12Stocks.com (click stock name for detailed review):
|


| 12Stocks.com: Investing in Technology sector with Stocks | |
|
The following table helps investors and traders sort through current performance and trends (as measured by Smart Investing & Trading Score) of various
stocks in the Tech sector. Quick View: Move mouse or cursor over stock symbol (ticker) to view short-term technical chart and over stock name to view long term chart. Click on  to add stock symbol to your watchlist and to add stock symbol to your watchlist and  to view watchlist. Click on any ticker or stock name for detailed market intelligence report for that stock. to view watchlist. Click on any ticker or stock name for detailed market intelligence report for that stock. |
12Stocks.com Performance of Stocks in Tech Sector
| Ticker | Stock Name | Watchlist | Category | Recent Price | Smart Investing & Trading Score | Change % | YTD Change% |
| TTD | Trade Desk |   | Software | 81.11 | 51 | 4.20% | 12.72% |
| VECO | Veeco | | Semiconductor | 33.69 | 51 | 2.90% | 8.57% |
| LRCX | Lam Research | | Semiconductor | 888.23 | 51 | 2.32% | 13.40% |
| TER | Teradyne | | Semiconductor | 99.87 | 51 | 2.16% | -7.97% |
| AMAT | Applied Materials | | Semiconductor | 193.27 | 51 | 2.01% | 19.25% |
| AVGO | Broadcom | | Semiconductor | 1248.11 | 51 | 1.93% | 11.81% |
| DAKT | Daktronics | | Computer Based | 9.29 | 51 | 1.92% | 9.49% |
| ENTG | Entegris | | Semiconductor | 126.22 | 51 | 1.76% | 5.34% |
| ASX | ASE | | Semiconductor | 10.32 | 51 | 1.38% | 9.67% |
| CCCS | CCC Intelligent | | Software - Infrastructure | 11.50 | 51 | 0.97% | 1.37% |
| VEON | VEON | | Telecom | 23.76 | 51 | 0.55% | 20.61% |
| YELP | Yelp | | Internet | 40.15 | 50 | 1.57% | -15.19% |
| IPGP | IPG Photonics | | Semiconductor | 85.30 | 50 | 0.24% | -21.41% |
| EXLS | ExlService | | IT | 29.61 | 50 | 0.07% | -4.02% |
| IONQ | IonQ | | Computer Hardware | 7.97 | 49 | 6.41% | -36.06% |
| SHOP | Shopify | | Software | 74.01 | 49 | 4.90% | -4.99% |
| CNXN | PC Connection | | Computers Wholesale | 64.93 | 49 | 4.12% | -3.39% |
| TIGR | UP Fintech | | Software | 3.29 | 49 | 3.46% | -25.57% |
| PHR | Phreesia | | Healthcare Information | 23.14 | 49 | 3.26% | -0.04% |
| CXM | Sprinklr | | Software - | 11.83 | 49 | 3.23% | -2.11% |
| ALTR | Altair Engineering | | Semiconductor | 83.81 | 49 | 1.93% | -0.40% |
| OTEX | Open Text | | Software | 36.08 | 49 | 1.78% | -14.14% |
| SWI | SolarWinds | | Software | 11.17 | 49 | 1.73% | -10.57% |
| TRUE | TrueCar | | Internet Service Providers | 3.01 | 49 | 1.69% | -13.01% |
| API | Agora | | Software | 2.48 | 49 | 1.43% | -5.87% |
| For chart view version of above stock list: Chart View ➞ 0 - 25 , 25 - 50 , 50 - 75 , 75 - 100 , 100 - 125 , 125 - 150 , 150 - 175 , 175 - 200 , 200 - 225 , 225 - 250 , 250 - 275 , 275 - 300 , 300 - 325 , 325 - 350 , 350 - 375 , 375 - 400 , 400 - 425 , 425 - 450 , 450 - 475 , 475 - 500 , 500 - 525 , 525 - 550 , 550 - 575 , 575 - 600 , 600 - 625 , 625 - 650 | ||
 | Click To Change The Sort Order: By Market Cap or Company Size Performance: Year-to-date, Week and Day |  |
|
Get the most comprehensive stock market coverage daily at 12Stocks.com ➞ Best Stocks Today ➞ Best Stocks Weekly ➞ Best Stocks Year-to-Date ➞ Best Stocks Trends ➞  Best Stocks Today 12Stocks.com Best Nasdaq Stocks ➞ Best S&P 500 Stocks ➞ Best Tech Stocks ➞ Best Biotech Stocks ➞ |
| Detailed Overview of Tech Stocks |
| Tech Technical Overview, Leaders & Laggards, Top Tech ETF Funds & Detailed Tech Stocks List, Charts, Trends & More |
| Tech Sector: Technical Analysis, Trends & YTD Performance | |
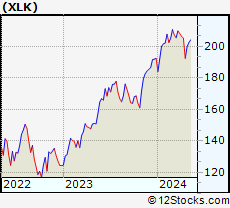
| Technology sector is composed of stocks
from semiconductors, software, web, social media
and services subsectors. Technology sector, as represented by XLK, an exchange-traded fund [ETF] that holds basket of tech stocks (e.g, Intel, Google) is up by 2.42% and is currently underperforming the overall market by -3.22% year-to-date. Below is a quick view of technical charts and trends: |
|
 XLK Weekly Chart |
|
| Long Term Trend: Not Good | |
| Medium Term Trend: Not Good | |
 XLK Daily Chart |
|
| Short Term Trend: Very Good | |
| Overall Trend Score: 38 | |
| YTD Performance: 2.42% | |
| **Trend Scores & Views Are Only For Educational Purposes And Not For Investing | |
| 12Stocks.com: Top Performing Technology Sector Stocks | ||||||||||||||||||||||||||||||||||||||||||||||||
 The top performing Technology sector stocks year to date are
Now, more recently, over last week, the top performing Technology sector stocks on the move are


|
||||||||||||||||||||||||||||||||||||||||||||||||
| 12Stocks.com: Investing in Tech Sector using Exchange Traded Funds | |
|
The following table shows list of key exchange traded funds (ETF) that
help investors track Tech Index. For detailed view, check out our ETF Funds section of our website. Quick View: Move mouse or cursor over ETF symbol (ticker) to view short-term technical chart and over ETF name to view long term chart. Click on ticker or stock name for detailed view. Click on to add stock symbol to your watchlist and to view watchlist. |
12Stocks.com List of ETFs that track Tech Index
| Ticker | ETF Name | Watchlist | Recent Price | Smart Investing & Trading Score | Change % | Week % | Year-to-date % |
| XLK | Technology | | 197.13 | 38 | 1.48 | 2.39 | 2.42% |
| QQQ | QQQ | | 424.02 | 51 | 2.34 | 2.26 | 3.54% |
| IYW | Technology | | 128.72 | 51 | 1.96 | 3.18 | 4.86% |
| VGT | Information Technology | | 495.19 | 38 | 1.80 | 3.19 | 2.31% |
| IXN | Global Tech | | 70.61 | 38 | 1.77 | 2.74 | 3.56% |
| IGV | Tech-Software | | 81.04 | 32 | 1.96 | 3.2 | -0.11% |
| XSD | Semiconductor | | 212.01 | 38 | 2.61 | 4.15 | -5.68% |
| TQQQ | QQQ | | 53.26 | 58 | 4.59 | 7.63 | 5.04% |
| SQQQ | Short QQQ | | 11.93 | 37 | -4.33 | -7.09 | -11.3% |
| SOXL | Semicondct Bull 3X | | 34.11 | 43 | 6.36 | 10.78 | 8.63% |
| SOXS | Semicondct Bear 3X | | 41.60 | 73 | -5.39 | -9.82 | 614.78% |
| SOXX | PHLX Semiconductor | | 206.62 | 51 | 2.46 | 4.15 | 7.6% |
| QTEC | First -100-Tech | | 180.57 | 38 | 2.39 | 3.81 | 2.91% |
| SMH | Semiconductor | | 207.78 | 51 | 2.34 | 4.3 | 18.82% |
| 12Stocks.com: Charts, Trends, Fundamental Data and Performances of Tech Stocks | |
|
We now take in-depth look at all Tech stocks including charts, multi-period performances and overall trends (as measured by Smart Investing & Trading Score). One can sort Tech stocks (click link to choose) by Daily, Weekly and by Year-to-Date performances. Also, one can sort by size of the company or by market capitalization. |
| Select Your Default Chart Type: | |||||
| |||||
| Click on stock symbol or name for detailed view. Click on to add stock symbol to your watchlist and to view watchlist. Quick View: Move mouse or cursor over "Daily" to quickly view daily technical stock chart and over "Weekly" to view weekly technical stock chart. | |||||


 | TTD The Trade Desk, Inc. |
| Sector: Technology | |
| SubSector: Application Software | |
| MarketCap: 9006.92 Millions | |
| Recent Price: 81.11 Smart Investing & Trading Score: 51 | |
| Day Percent Change: 4.20% Day Change: 3.27 | |
| Week Change: 4.93% Year-to-date Change: 12.7% | |
| TTD Links: Profile News Message Board | |
| Charts:- Daily , Weekly | |
| Add TTD to Watchlist: View: Get Complete TTD Trend Analysis ➞ | |
 | VECO Veeco Instruments Inc. |
| Sector: Technology | |
| SubSector: Semiconductor Equipment & Materials | |
| MarketCap: 450.718 Millions | |
| Recent Price: 33.69 Smart Investing & Trading Score: 51 | |
| Day Percent Change: 2.90% Day Change: 0.95 | |
| Week Change: 3.41% Year-to-date Change: 8.6% | |
| VECO Links: Profile News Message Board | |
| Charts:- Daily , Weekly | |
| Add VECO to Watchlist: View: Get Complete VECO Trend Analysis ➞ | |
 | LRCX Lam Research Corporation |
| Sector: Technology | |
| SubSector: Semiconductor Equipment & Materials | |
| MarketCap: 31806 Millions | |
| Recent Price: 888.23 Smart Investing & Trading Score: 51 | |
| Day Percent Change: 2.32% Day Change: 20.16 | |
| Week Change: 2.07% Year-to-date Change: 13.4% | |
| LRCX Links: Profile News Message Board | |
| Charts:- Daily , Weekly | |
| Add LRCX to Watchlist: View: Get Complete LRCX Trend Analysis ➞ | |
 | TER Teradyne, Inc. |
| Sector: Technology | |
| SubSector: Semiconductor Equipment & Materials | |
| MarketCap: 8135.68 Millions | |
| Recent Price: 99.87 Smart Investing & Trading Score: 51 | |
| Day Percent Change: 2.16% Day Change: 2.11 | |
| Week Change: 4.06% Year-to-date Change: -8.0% | |
| TER Links: Profile News Message Board | |
| Charts:- Daily , Weekly | |
| Add TER to Watchlist: View: Get Complete TER Trend Analysis ➞ | |
 | AMAT Applied Materials, Inc. |
| Sector: Technology | |
| SubSector: Semiconductor Equipment & Materials | |
| MarketCap: 40593.8 Millions | |
| Recent Price: 193.27 Smart Investing & Trading Score: 51 | |
| Day Percent Change: 2.01% Day Change: 3.81 | |
| Week Change: 1.84% Year-to-date Change: 19.3% | |
| AMAT Links: Profile News Message Board | |
| Charts:- Daily , Weekly | |
| Add AMAT to Watchlist: View: Get Complete AMAT Trend Analysis ➞ | |
 | AVGO Broadcom Inc. |
| Sector: Technology | |
| SubSector: Semiconductor - Broad Line | |
| MarketCap: 86329.1 Millions | |
| Recent Price: 1248.11 Smart Investing & Trading Score: 51 | |
| Day Percent Change: 1.93% Day Change: 23.65 | |
| Week Change: 3.6% Year-to-date Change: 11.8% | |
| AVGO Links: Profile News Message Board | |
| Charts:- Daily , Weekly | |
| Add AVGO to Watchlist: View: Get Complete AVGO Trend Analysis ➞ | |
 | DAKT Daktronics, Inc. |
| Sector: Technology | |
| SubSector: Computer Based Systems | |
| MarketCap: 223.539 Millions | |
| Recent Price: 9.29 Smart Investing & Trading Score: 51 | |
| Day Percent Change: 1.92% Day Change: 0.18 | |
| Week Change: 1.59% Year-to-date Change: 9.5% | |
| DAKT Links: Profile News Message Board | |
| Charts:- Daily , Weekly | |
| Add DAKT to Watchlist: View: Get Complete DAKT Trend Analysis ➞ | |
 | ENTG Entegris, Inc. |
| Sector: Technology | |
| SubSector: Semiconductor Equipment & Materials | |
| MarketCap: 5890.38 Millions | |
| Recent Price: 126.22 Smart Investing & Trading Score: 51 | |
| Day Percent Change: 1.76% Day Change: 2.18 | |
| Week Change: 3.29% Year-to-date Change: 5.3% | |
| ENTG Links: Profile News Message Board | |
| Charts:- Daily , Weekly | |
| Add ENTG to Watchlist: View: Get Complete ENTG Trend Analysis ➞ | |
 | ASX ASE Technology Holding Co., Ltd. |
| Sector: Technology | |
| SubSector: Semiconductor Equipment & Materials | |
| MarketCap: 8513.18 Millions | |
| Recent Price: 10.32 Smart Investing & Trading Score: 51 | |
| Day Percent Change: 1.38% Day Change: 0.14 | |
| Week Change: 2.69% Year-to-date Change: 9.7% | |
| ASX Links: Profile News Message Board | |
| Charts:- Daily , Weekly | |
| Add ASX to Watchlist: View: Get Complete ASX Trend Analysis ➞ | |
 | CCCS CCC Intelligent Solutions Holdings Inc. |
| Sector: Technology | |
| SubSector: Software - Infrastructure | |
| MarketCap: 6990 Millions | |
| Recent Price: 11.50 Smart Investing & Trading Score: 51 | |
| Day Percent Change: 0.97% Day Change: 0.11 | |
| Week Change: 0.52% Year-to-date Change: 1.4% | |
| CCCS Links: Profile News Message Board | |
| Charts:- Daily , Weekly | |
| Add CCCS to Watchlist: View: Get Complete CCCS Trend Analysis ➞ | |
 | VEON VEON Ltd. |
| Sector: Technology | |
| SubSector: Telecom Services - Foreign | |
| MarketCap: 2497.89 Millions | |
| Recent Price: 23.76 Smart Investing & Trading Score: 51 | |
| Day Percent Change: 0.55% Day Change: 0.13 | |
| Week Change: -0.63% Year-to-date Change: 20.6% | |
| VEON Links: Profile News Message Board | |
| Charts:- Daily , Weekly | |
| Add VEON to Watchlist: View: Get Complete VEON Trend Analysis ➞ | |
 | YELP Yelp Inc. |
| Sector: Technology | |
| SubSector: Internet Information Providers | |
| MarketCap: 1430.1 Millions | |
| Recent Price: 40.15 Smart Investing & Trading Score: 50 | |
| Day Percent Change: 1.57% Day Change: 0.62 | |
| Week Change: 2.19% Year-to-date Change: -15.2% | |
| YELP Links: Profile News Message Board | |
| Charts:- Daily , Weekly | |
| Add YELP to Watchlist: View: Get Complete YELP Trend Analysis ➞ | |
 | IPGP IPG Photonics Corporation |
| Sector: Technology | |
| SubSector: Semiconductor Equipment & Materials | |
| MarketCap: 6059.38 Millions | |
| Recent Price: 85.30 Smart Investing & Trading Score: 50 | |
| Day Percent Change: 0.24% Day Change: 0.20 | |
| Week Change: 1.22% Year-to-date Change: -21.4% | |
| IPGP Links: Profile News Message Board | |
| Charts:- Daily , Weekly | |
| Add IPGP to Watchlist: View: Get Complete IPGP Trend Analysis ➞ | |
 | EXLS ExlService Holdings, Inc. |
| Sector: Technology | |
| SubSector: Information Technology Services | |
| MarketCap: 1781.78 Millions | |
| Recent Price: 29.61 Smart Investing & Trading Score: 50 | |
| Day Percent Change: 0.07% Day Change: 0.02 | |
| Week Change: 0.99% Year-to-date Change: -4.0% | |
| EXLS Links: Profile News Message Board | |
| Charts:- Daily , Weekly | |
| Add EXLS to Watchlist: View: Get Complete EXLS Trend Analysis ➞ | |
 | IONQ IonQ, Inc. |
| Sector: Technology | |
| SubSector: Computer Hardware | |
| MarketCap: 2680 Millions | |
| Recent Price: 7.97 Smart Investing & Trading Score: 49 | |
| Day Percent Change: 6.41% Day Change: 0.48 | |
| Week Change: 12.41% Year-to-date Change: -36.1% | |
| IONQ Links: Profile News Message Board | |
| Charts:- Daily , Weekly | |
| Add IONQ to Watchlist: View: Get Complete IONQ Trend Analysis ➞ | |
 | SHOP Shopify Inc. |
| Sector: Technology | |
| SubSector: Application Software | |
| MarketCap: 45164.2 Millions | |
| Recent Price: 74.01 Smart Investing & Trading Score: 49 | |
| Day Percent Change: 4.90% Day Change: 3.46 | |
| Week Change: 6.23% Year-to-date Change: -5.0% | |
| SHOP Links: Profile News Message Board | |
| Charts:- Daily , Weekly | |
| Add SHOP to Watchlist: View: Get Complete SHOP Trend Analysis ➞ | |
 | CNXN PC Connection, Inc. |
| Sector: Technology | |
| SubSector: Computers Wholesale | |
| MarketCap: 1020.19 Millions | |
| Recent Price: 64.93 Smart Investing & Trading Score: 49 | |
| Day Percent Change: 4.12% Day Change: 2.57 | |
| Week Change: 3.36% Year-to-date Change: -3.4% | |
| CNXN Links: Profile News Message Board | |
| Charts:- Daily , Weekly | |
| Add CNXN to Watchlist: View: Get Complete CNXN Trend Analysis ➞ | |
 | TIGR UP Fintech Holding Limited |
| Sector: Technology | |
| SubSector: Application Software | |
| MarketCap: 385.062 Millions | |
| Recent Price: 3.29 Smart Investing & Trading Score: 49 | |
| Day Percent Change: 3.46% Day Change: 0.11 | |
| Week Change: 4.44% Year-to-date Change: -25.6% | |
| TIGR Links: Profile News Message Board | |
| Charts:- Daily , Weekly | |
| Add TIGR to Watchlist: View: Get Complete TIGR Trend Analysis ➞ | |
 | PHR Phreesia, Inc. |
| Sector: Technology | |
| SubSector: Healthcare Information Services | |
| MarketCap: 810.255 Millions | |
| Recent Price: 23.14 Smart Investing & Trading Score: 49 | |
| Day Percent Change: 3.26% Day Change: 0.73 | |
| Week Change: 6.64% Year-to-date Change: 0.0% | |
| PHR Links: Profile News Message Board | |
| Charts:- Daily , Weekly | |
| Add PHR to Watchlist: View: Get Complete PHR Trend Analysis ➞ | |
 | CXM Sprinklr, Inc. |
| Sector: Technology | |
| SubSector: Software - Application | |
| MarketCap: 3700 Millions | |
| Recent Price: 11.83 Smart Investing & Trading Score: 49 | |
| Day Percent Change: 3.23% Day Change: 0.37 | |
| Week Change: 4.32% Year-to-date Change: -2.1% | |
| CXM Links: Profile News Message Board | |
| Charts:- Daily , Weekly | |
| Add CXM to Watchlist: View: Get Complete CXM Trend Analysis ➞ | |
 | ALTR Altair Engineering Inc. |
| Sector: Technology | |
| SubSector: Semiconductor - Specialized | |
| MarketCap: 2072.2 Millions | |
| Recent Price: 83.81 Smart Investing & Trading Score: 49 | |
| Day Percent Change: 1.93% Day Change: 1.59 | |
| Week Change: 1.76% Year-to-date Change: -0.4% | |
| ALTR Links: Profile News Message Board | |
| Charts:- Daily , Weekly | |
| Add ALTR to Watchlist: View: Get Complete ALTR Trend Analysis ➞ | |
 | OTEX Open Text Corporation |
| Sector: Technology | |
| SubSector: Application Software | |
| MarketCap: 9291.92 Millions | |
| Recent Price: 36.08 Smart Investing & Trading Score: 49 | |
| Day Percent Change: 1.78% Day Change: 0.63 | |
| Week Change: 2.94% Year-to-date Change: -14.1% | |
| OTEX Links: Profile News Message Board | |
| Charts:- Daily , Weekly | |
| Add OTEX to Watchlist: View: Get Complete OTEX Trend Analysis ➞ | |
 | SWI SolarWinds Corporation |
| Sector: Technology | |
| SubSector: Application Software | |
| MarketCap: 4524.62 Millions | |
| Recent Price: 11.17 Smart Investing & Trading Score: 49 | |
| Day Percent Change: 1.73% Day Change: 0.19 | |
| Week Change: 2.48% Year-to-date Change: -10.6% | |
| SWI Links: Profile News Message Board | |
| Charts:- Daily , Weekly | |
| Add SWI to Watchlist: View: Get Complete SWI Trend Analysis ➞ | |
 | TRUE TrueCar, Inc. |
| Sector: Technology | |
| SubSector: Internet Service Providers | |
| MarketCap: 244.18 Millions | |
| Recent Price: 3.01 Smart Investing & Trading Score: 49 | |
| Day Percent Change: 1.69% Day Change: 0.05 | |
| Week Change: 3.44% Year-to-date Change: -13.0% | |
| TRUE Links: Profile News Message Board | |
| Charts:- Daily , Weekly | |
| Add TRUE to Watchlist: View: Get Complete TRUE Trend Analysis ➞ | |
 | API Agora, Inc. |
| Sector: Technology | |
| SubSector: Software Application | |
| MarketCap: 42787 Millions | |
| Recent Price: 2.48 Smart Investing & Trading Score: 49 | |
| Day Percent Change: 1.43% Day Change: 0.03 | |
| Week Change: 3.11% Year-to-date Change: -5.9% | |
| API Links: Profile News Message Board | |
| Charts:- Daily , Weekly | |
| Add API to Watchlist: View: Get Complete API Trend Analysis ➞ | |
| For tabular summary view of above stock list: Summary View ➞ 0 - 25 , 25 - 50 , 50 - 75 , 75 - 100 , 100 - 125 , 125 - 150 , 150 - 175 , 175 - 200 , 200 - 225 , 225 - 250 , 250 - 275 , 275 - 300 , 300 - 325 , 325 - 350 , 350 - 375 , 375 - 400 , 400 - 425 , 425 - 450 , 450 - 475 , 475 - 500 , 500 - 525 , 525 - 550 , 550 - 575 , 575 - 600 , 600 - 625 , 625 - 650 | ||
| Click To Change The Sort Order: By Market Cap or Company Size Performance: Year-to-date, Week and Day | |
| Select Chart Type: | ||
|
Best Stocks Today 12Stocks.com |
© 2024 12Stocks.com Terms & Conditions Privacy Contact Us
All Information Provided Only For Education And Not To Be Used For Investing or Trading. See Terms & Conditions


One More Thing ... Get Best Stocks Delivered Daily!
Never Ever Miss A Move With Our Top Ten Stocks Lists
Find Best Stocks In Any Market - Bull or Bear Market
Take A Peek At Our Top Ten Stocks Lists: Daily, Weekly, Year-to-Date & Top Trends
Find Best Stocks In Any Market - Bull or Bear Market
Take A Peek At Our Top Ten Stocks Lists: Daily, Weekly, Year-to-Date & Top Trends
Technology Stocks With Best Up Trends [0-bearish to 100-bullish]: Payoneer Global[100], Grab [100], Sea [100], ACI Worldwide[100], NextNav [100], Full Truck[100], Badger Meter[100], Descartes Systems[100], Bentley Systems[100], JD.com [100], Cricut [100]
Best Technology Stocks Year-to-Date:
Pagaya [574.82%], MediaCo Holding[370.66%], CXApp [172.59%], Super Micro[168.16%], Smith Micro[155.45%], Uxin [131.81%], MicroStrategy [111.59%], GigaCloud [102.02%], CuriosityStream [101.81%], SoundHound AI[95.09%], NextNav [94.49%] Best Technology Stocks This Week:
Matterport [164.37%], HashiCorp [22.53%], Akoustis [21.27%], BigBear.ai [17.93%], SoundHound AI[17.61%], Cheetah Mobile[14.69%], MicroStrategy [13.83%], So-Young [13.3%], Sea [12.62%], Aerohive Networks[12.55%], IonQ [12.41%] Best Technology Stocks Daily:
HashiCorp [19.54%], Akoustis [10.46%], SoundHound AI[10.45%], MediaCo Holding[10.16%], on [9.92%], BigBear.ai [9.62%], HealthStream [9.42%], Vacasa [9.18%], Cheetah Mobile[8.85%], Viasat [7.99%], CuriosityStream [7.92%]