
 Login Sign Up


| |||||
 |  | ||||

| 12Stocks.com Market Intelligence |
Best Tech Stocks
| In a hurry? Tech Stocks Lists: Performance & Trends, Stock Charts, FANG Stocks
Sort Tech stocks: Daily, Weekly, Year-to-Date, Market Cap & Trends. Filter Tech stocks list by size:All Tech Large Mid-Range Small and MicroCap |
| 12Stocks.com Tech Stocks Performances & Trends Daily | |||||||||
|
|  The overall Smart Investing & Trading Score is 45 (0-bearish to 100-bullish) which puts Technology sector in short term neutral trend. The Smart Investing & Trading Score from previous trading session is 38 and hence an improvement of trend.
| ||||||||
Here are the Smart Investing & Trading Scores of the most requested Technology stocks at 12Stocks.com (click stock name for detailed review):
|


| 12Stocks.com: Investing in Technology sector with Stocks | |
|
The following table helps investors and traders sort through current performance and trends (as measured by Smart Investing & Trading Score) of various
stocks in the Tech sector. Quick View: Move mouse or cursor over stock symbol (ticker) to view short-term technical chart and over stock name to view long term chart. Click on  to add stock symbol to your watchlist and to add stock symbol to your watchlist and  to view watchlist. Click on any ticker or stock name for detailed market intelligence report for that stock. to view watchlist. Click on any ticker or stock name for detailed market intelligence report for that stock. |
12Stocks.com Performance of Stocks in Tech Sector
| Ticker | Stock Name | Watchlist | Category | Recent Price | Smart Investing & Trading Score | Change % | YTD Change% |
| CRM | salesforce.com |   | Software | 276.19 | 32 | -0.18% | 4.96% |
| NTES | NetEase | | Internet | 94.02 | 32 | 1.02% | 0.92% |
| DOX | Amdocs | | Software | 86.74 | 32 | 0.20% | -1.31% |
| BILL | Bill.com | | Software | 61.41 | 30 | 0.24% | -24.73% |
| UCL | uCloudlink | | Telecom | 1.44 | 30 | 0.00% | -22.16% |
| COMP | Compass | | Software - | 3.31 | 30 | -2.79% | -11.01% |
| FSLY | Fastly | | Software | 12.83 | 30 | -0.47% | -27.92% |
| CCSI | Consensus Cloud | | Software - Infrastructure | 12.58 | 30 | -0.16% | -52.77% |
| OMCL | Omnicell | | Healthcare Information | 27.43 | 30 | -3.52% | -27.11% |
| SSTI | ShotSpotter | | Software | 13.46 | 28 | 1.05% | -47.30% |
| DMRC | Digimarc | | IT | 22.23 | 28 | 0.05% | -38.46% |
| PCTY | Paylocity Holding | | Software | 156.16 | 28 | -1.71% | -5.27% |
| HCAT | Health Catalyst | | Healthcare Information | 6.03 | 27 | 7.68% | -34.88% |
| SMRT | SmartRent | | Software - | 2.37 | 27 | 2.16% | -25.71% |
| CMTL | Comtech Tele | | Communication | 1.75 | 27 | 10.76% | -79.24% |
| SHEN | Shenandoah Tele | | Telecom | 14.17 | 27 | 0.93% | -34.46% |
| BIGC | BigCommerce | | Software | 5.83 | 27 | 0.43% | -40.20% |
| NOTE | FiscalNote | | IT | 1.21 | 27 | 0.42% | 2.99% |
| STNE | StoneCo | | Software | 15.83 | 27 | 0.32% | -12.20% |
| ZM | Zoom Video | | Software | 61.65 | 27 | 0.05% | -14.27% |
| TWKS | Thoughtworks Holding | | IT | 2.31 | 27 | -4.35% | -52.47% |
| RXT | Rackspace | | Software Infrastructure | 1.63 | 27 | -2.98% | -18.70% |
| RUN | Sunrun | | Semiconductor | 10.02 | 27 | -2.43% | -48.96% |
| GSAT | Globalstar | | Wireless | 1.28 | 27 | -1.54% | -34.02% |
| TWOU | 2U | | Software | 0.25 | 25 | 4.17% | -79.67% |
| For chart view version of above stock list: Chart View ➞ 0 - 25 , 25 - 50 , 50 - 75 , 75 - 100 , 100 - 125 , 125 - 150 , 150 - 175 , 175 - 200 , 200 - 225 , 225 - 250 , 250 - 275 , 275 - 300 , 300 - 325 , 325 - 350 , 350 - 375 , 375 - 400 , 400 - 425 , 425 - 450 , 450 - 475 , 475 - 500 , 500 - 525 , 525 - 550 , 550 - 575 , 575 - 600 , 600 - 625 , 625 - 650 | ||
 | Click To Change The Sort Order: By Market Cap or Company Size Performance: Year-to-date, Week and Day |  |
|
Get the most comprehensive stock market coverage daily at 12Stocks.com ➞ Best Stocks Today ➞ Best Stocks Weekly ➞ Best Stocks Year-to-Date ➞ Best Stocks Trends ➞  Best Stocks Today 12Stocks.com Best Nasdaq Stocks ➞ Best S&P 500 Stocks ➞ Best Tech Stocks ➞ Best Biotech Stocks ➞ |
| Detailed Overview of Tech Stocks |
| Tech Technical Overview, Leaders & Laggards, Top Tech ETF Funds & Detailed Tech Stocks List, Charts, Trends & More |
| Tech Sector: Technical Analysis, Trends & YTD Performance | |
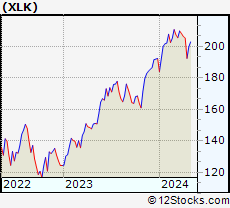
| Technology sector is composed of stocks
from semiconductors, software, web, social media
and services subsectors. Technology sector, as represented by XLK, an exchange-traded fund [ETF] that holds basket of tech stocks (e.g, Intel, Google) is up by 2.88% and is currently underperforming the overall market by -2.78% year-to-date. Below is a quick view of technical charts and trends: |
|
 XLK Weekly Chart |
|
| Long Term Trend: Good | |
| Medium Term Trend: Not Good | |
 XLK Daily Chart |
|
| Short Term Trend: Very Good | |
| Overall Trend Score: 45 | |
| YTD Performance: 2.88% | |
| **Trend Scores & Views Are Only For Educational Purposes And Not For Investing | |
| 12Stocks.com: Top Performing Technology Sector Stocks | ||||||||||||||||||||||||||||||||||||||||||||||||
 The top performing Technology sector stocks year to date are
Now, more recently, over last week, the top performing Technology sector stocks on the move are


|
||||||||||||||||||||||||||||||||||||||||||||||||
| 12Stocks.com: Investing in Tech Sector using Exchange Traded Funds | |
|
The following table shows list of key exchange traded funds (ETF) that
help investors track Tech Index. For detailed view, check out our ETF Funds section of our website. Quick View: Move mouse or cursor over ETF symbol (ticker) to view short-term technical chart and over ETF name to view long term chart. Click on ticker or stock name for detailed view. Click on to add stock symbol to your watchlist and to view watchlist. |
12Stocks.com List of ETFs that track Tech Index
| Ticker | ETF Name | Watchlist | Recent Price | Smart Investing & Trading Score | Change % | Week % | Year-to-date % |
| XLK | Technology | | 198.03 | 45 | 0.46 | 2.86 | 2.88% |
| QQQ | QQQ | | 426.51 | 58 | 0.34 | 2.86 | 4.15% |
| IYW | Technology | | 128.84 | 58 | 0.25 | 3.28 | 4.96% |
| VGT | Information Technology | | 495.24 | 45 | 0.16 | 3.2 | 2.32% |
| IXN | Global Tech | | 70.84 | 43 | 0.47 | 3.08 | 3.9% |
| IGV | Tech-Software | | 80.94 | 32 | 0.10 | 3.07 | -0.23% |
| XSD | Semiconductor | | 215.54 | 30 | 2.30 | 5.89 | -4.11% |
| TQQQ | QQQ | | 53.71 | 58 | 0.98 | 8.55 | 5.94% |
| SQQQ | Short QQQ | | 11.81 | 37 | -0.84 | -8.02 | -12.19% |
| SOXL | Semicondct Bull 3X | | 35.49 | 58 | 4.05 | 15.26 | 13.03% |
| SOXS | Semicondct Bear 3X | | 39.61 | 58 | -3.81 | -14.13 | 580.58% |
| SOXX | PHLX Semiconductor | | 208.54 | 58 | 1.30 | 5.12 | 8.6% |
| QTEC | First -100-Tech | | 181.14 | 58 | 0.69 | 4.14 | 3.23% |
| SMH | Semiconductor | | 208.04 | 58 | 0.12 | 4.43 | 18.97% |
| 12Stocks.com: Charts, Trends, Fundamental Data and Performances of Tech Stocks | |
|
We now take in-depth look at all Tech stocks including charts, multi-period performances and overall trends (as measured by Smart Investing & Trading Score). One can sort Tech stocks (click link to choose) by Daily, Weekly and by Year-to-Date performances. Also, one can sort by size of the company or by market capitalization. |
| Select Your Default Chart Type: | |||||
| |||||
| Click on stock symbol or name for detailed view. Click on to add stock symbol to your watchlist and to view watchlist. Quick View: Move mouse or cursor over "Daily" to quickly view daily technical stock chart and over "Weekly" to view weekly technical stock chart. | |||||


 | CRM salesforce.com, inc. |
| Sector: Technology | |
| SubSector: Application Software | |
| MarketCap: 137120 Millions | |
| Recent Price: 276.19 Smart Investing & Trading Score: 32 | |
| Day Percent Change: -0.18% Day Change: -0.49 | |
| Week Change: 2.15% Year-to-date Change: 5.0% | |
| CRM Links: Profile News Message Board | |
| Charts:- Daily , Weekly | |
| Add CRM to Watchlist: View: Get Complete CRM Trend Analysis ➞ | |
 | NTES NetEase, Inc. |
| Sector: Technology | |
| SubSector: Internet Software & Services | |
| MarketCap: 40105.1 Millions | |
| Recent Price: 94.02 Smart Investing & Trading Score: 32 | |
| Day Percent Change: 1.02% Day Change: 0.95 | |
| Week Change: 0.55% Year-to-date Change: 0.9% | |
| NTES Links: Profile News Message Board | |
| Charts:- Daily , Weekly | |
| Add NTES to Watchlist: View: Get Complete NTES Trend Analysis ➞ | |
 | DOX Amdocs Limited |
| Sector: Technology | |
| SubSector: Business Software & Services | |
| MarketCap: 6895.48 Millions | |
| Recent Price: 86.74 Smart Investing & Trading Score: 32 | |
| Day Percent Change: 0.20% Day Change: 0.17 | |
| Week Change: 0.71% Year-to-date Change: -1.3% | |
| DOX Links: Profile News Message Board | |
| Charts:- Daily , Weekly | |
| Add DOX to Watchlist: View: Get Complete DOX Trend Analysis ➞ | |
 | BILL Bill.com Holdings, Inc. |
| Sector: Technology | |
| SubSector: Application Software | |
| MarketCap: 3068.42 Millions | |
| Recent Price: 61.41 Smart Investing & Trading Score: 30 | |
| Day Percent Change: 0.24% Day Change: 0.15 | |
| Week Change: 3.02% Year-to-date Change: -24.7% | |
| BILL Links: Profile News Message Board | |
| Charts:- Daily , Weekly | |
| Add BILL to Watchlist: View: Get Complete BILL Trend Analysis ➞ | |
 | UCL uCloudlink Group Inc. |
| Sector: Technology | |
| SubSector: Telecom Services | |
| MarketCap: 35837 Millions | |
| Recent Price: 1.44 Smart Investing & Trading Score: 30 | |
| Day Percent Change: 0.00% Day Change: 0.00 | |
| Week Change: 4.73% Year-to-date Change: -22.2% | |
| UCL Links: Profile News Message Board | |
| Charts:- Daily , Weekly | |
| Add UCL to Watchlist: View: Get Complete UCL Trend Analysis ➞ | |
 | COMP Compass, Inc. |
| Sector: Technology | |
| SubSector: Software - Application | |
| MarketCap: 1580 Millions | |
| Recent Price: 3.31 Smart Investing & Trading Score: 30 | |
| Day Percent Change: -2.79% Day Change: -0.10 | |
| Week Change: 2.31% Year-to-date Change: -11.0% | |
| COMP Links: Profile News Message Board | |
| Charts:- Daily , Weekly | |
| Add COMP to Watchlist: View: Get Complete COMP Trend Analysis ➞ | |
 | FSLY Fastly, Inc. |
| Sector: Technology | |
| SubSector: Application Software | |
| MarketCap: 1973.72 Millions | |
| Recent Price: 12.83 Smart Investing & Trading Score: 30 | |
| Day Percent Change: -0.47% Day Change: -0.06 | |
| Week Change: 4.31% Year-to-date Change: -27.9% | |
| FSLY Links: Profile News Message Board | |
| Charts:- Daily , Weekly | |
| Add FSLY to Watchlist: View: Get Complete FSLY Trend Analysis ➞ | |
 | CCSI Consensus Cloud Solutions, Inc. |
| Sector: Technology | |
| SubSector: Software - Infrastructure | |
| MarketCap: 609 Millions | |
| Recent Price: 12.58 Smart Investing & Trading Score: 30 | |
| Day Percent Change: -0.16% Day Change: -0.02 | |
| Week Change: -2.33% Year-to-date Change: -52.8% | |
| CCSI Links: Profile News Message Board | |
| Charts:- Daily , Weekly | |
| Add CCSI to Watchlist: View: Get Complete CCSI Trend Analysis ➞ | |
 | OMCL Omnicell, Inc. |
| Sector: Technology | |
| SubSector: Healthcare Information Services | |
| MarketCap: 2781.05 Millions | |
| Recent Price: 27.43 Smart Investing & Trading Score: 30 | |
| Day Percent Change: -3.52% Day Change: -1.00 | |
| Week Change: -1.44% Year-to-date Change: -27.1% | |
| OMCL Links: Profile News Message Board | |
| Charts:- Daily , Weekly | |
| Add OMCL to Watchlist: View: Get Complete OMCL Trend Analysis ➞ | |
 | SSTI ShotSpotter, Inc. |
| Sector: Technology | |
| SubSector: Application Software | |
| MarketCap: 353.062 Millions | |
| Recent Price: 13.46 Smart Investing & Trading Score: 28 | |
| Day Percent Change: 1.05% Day Change: 0.14 | |
| Week Change: 0.98% Year-to-date Change: -47.3% | |
| SSTI Links: Profile News Message Board | |
| Charts:- Daily , Weekly | |
| Add SSTI to Watchlist: View: Get Complete SSTI Trend Analysis ➞ | |
 | DMRC Digimarc Corporation |
| Sector: Technology | |
| SubSector: Information Technology Services | |
| MarketCap: 222.268 Millions | |
| Recent Price: 22.23 Smart Investing & Trading Score: 28 | |
| Day Percent Change: 0.05% Day Change: 0.01 | |
| Week Change: -1.59% Year-to-date Change: -38.5% | |
| DMRC Links: Profile News Message Board | |
| Charts:- Daily , Weekly | |
| Add DMRC to Watchlist: View: Get Complete DMRC Trend Analysis ➞ | |
 | PCTY Paylocity Holding Corporation |
| Sector: Technology | |
| SubSector: Application Software | |
| MarketCap: 4972.82 Millions | |
| Recent Price: 156.16 Smart Investing & Trading Score: 28 | |
| Day Percent Change: -1.71% Day Change: -2.72 | |
| Week Change: -0.67% Year-to-date Change: -5.3% | |
| PCTY Links: Profile News Message Board | |
| Charts:- Daily , Weekly | |
| Add PCTY to Watchlist: View: Get Complete PCTY Trend Analysis ➞ | |
 | HCAT Health Catalyst, Inc. |
| Sector: Technology | |
| SubSector: Healthcare Information Services | |
| MarketCap: 983.955 Millions | |
| Recent Price: 6.03 Smart Investing & Trading Score: 27 | |
| Day Percent Change: 7.68% Day Change: 0.43 | |
| Week Change: 8.06% Year-to-date Change: -34.9% | |
| HCAT Links: Profile News Message Board | |
| Charts:- Daily , Weekly | |
| Add HCAT to Watchlist: View: Get Complete HCAT Trend Analysis ➞ | |
 | SMRT SmartRent, Inc. |
| Sector: Technology | |
| SubSector: Software - Application | |
| MarketCap: 733 Millions | |
| Recent Price: 2.37 Smart Investing & Trading Score: 27 | |
| Day Percent Change: 2.16% Day Change: 0.05 | |
| Week Change: 3.49% Year-to-date Change: -25.7% | |
| SMRT Links: Profile News Message Board | |
| Charts:- Daily , Weekly | |
| Add SMRT to Watchlist: View: Get Complete SMRT Trend Analysis ➞ | |
 | CMTL Comtech Telecommunications Corp. |
| Sector: Technology | |
| SubSector: Communication Equipment | |
| MarketCap: 399.539 Millions | |
| Recent Price: 1.75 Smart Investing & Trading Score: 27 | |
| Day Percent Change: 10.76% Day Change: 0.17 | |
| Week Change: -5.41% Year-to-date Change: -79.2% | |
| CMTL Links: Profile News Message Board | |
| Charts:- Daily , Weekly | |
| Add CMTL to Watchlist: View: Get Complete CMTL Trend Analysis ➞ | |
 | SHEN Shenandoah Telecommunications Company |
| Sector: Technology | |
| SubSector: Telecom Services - Domestic | |
| MarketCap: 2329.67 Millions | |
| Recent Price: 14.17 Smart Investing & Trading Score: 27 | |
| Day Percent Change: 0.93% Day Change: 0.13 | |
| Week Change: -3.54% Year-to-date Change: -34.5% | |
| SHEN Links: Profile News Message Board | |
| Charts:- Daily , Weekly | |
| Add SHEN to Watchlist: View: Get Complete SHEN Trend Analysis ➞ | |
 | BIGC BigCommerce Holdings, Inc. |
| Sector: Technology | |
| SubSector: Software Application | |
| MarketCap: 47587 Millions | |
| Recent Price: 5.83 Smart Investing & Trading Score: 27 | |
| Day Percent Change: 0.43% Day Change: 0.03 | |
| Week Change: -2.02% Year-to-date Change: -40.2% | |
| BIGC Links: Profile News Message Board | |
| Charts:- Daily , Weekly | |
| Add BIGC to Watchlist: View: Get Complete BIGC Trend Analysis ➞ | |
 | NOTE FiscalNote Holdings, Inc. |
| Sector: Technology | |
| SubSector: Information Technology Services | |
| MarketCap: 493 Millions | |
| Recent Price: 1.21 Smart Investing & Trading Score: 27 | |
| Day Percent Change: 0.42% Day Change: 0.01 | |
| Week Change: 4.78% Year-to-date Change: 3.0% | |
| NOTE Links: Profile News Message Board | |
| Charts:- Daily , Weekly | |
| Add NOTE to Watchlist: View: Get Complete NOTE Trend Analysis ➞ | |
 | STNE StoneCo Ltd. |
| Sector: Technology | |
| SubSector: Application Software | |
| MarketCap: 7347.82 Millions | |
| Recent Price: 15.83 Smart Investing & Trading Score: 27 | |
| Day Percent Change: 0.32% Day Change: 0.05 | |
| Week Change: 3.46% Year-to-date Change: -12.2% | |
| STNE Links: Profile News Message Board | |
| Charts:- Daily , Weekly | |
| Add STNE to Watchlist: View: Get Complete STNE Trend Analysis ➞ | |
 | ZM Zoom Video Communications, Inc. |
| Sector: Technology | |
| SubSector: Application Software | |
| MarketCap: 36358.1 Millions | |
| Recent Price: 61.65 Smart Investing & Trading Score: 27 | |
| Day Percent Change: 0.05% Day Change: 0.03 | |
| Week Change: 3.68% Year-to-date Change: -14.3% | |
| ZM Links: Profile News Message Board | |
| Charts:- Daily , Weekly | |
| Add ZM to Watchlist: View: Get Complete ZM Trend Analysis ➞ | |
 | TWKS Thoughtworks Holding, Inc. |
| Sector: Technology | |
| SubSector: Information Technology Services | |
| MarketCap: 2370 Millions | |
| Recent Price: 2.31 Smart Investing & Trading Score: 27 | |
| Day Percent Change: -4.35% Day Change: -0.10 | |
| Week Change: -0.43% Year-to-date Change: -52.5% | |
| TWKS Links: Profile News Message Board | |
| Charts:- Daily , Weekly | |
| Add TWKS to Watchlist: View: Get Complete TWKS Trend Analysis ➞ | |
 | RXT Rackspace Technology, Inc. |
| Sector: Technology | |
| SubSector: Software Infrastructure | |
| MarketCap: 40287 Millions | |
| Recent Price: 1.63 Smart Investing & Trading Score: 27 | |
| Day Percent Change: -2.98% Day Change: -0.05 | |
| Week Change: 3.49% Year-to-date Change: -18.7% | |
| RXT Links: Profile News Message Board | |
| Charts:- Daily , Weekly | |
| Add RXT to Watchlist: View: Get Complete RXT Trend Analysis ➞ | |
 | RUN Sunrun Inc. |
| Sector: Technology | |
| SubSector: Semiconductor - Specialized | |
| MarketCap: 1286.2 Millions | |
| Recent Price: 10.02 Smart Investing & Trading Score: 27 | |
| Day Percent Change: -2.43% Day Change: -0.25 | |
| Week Change: -2.24% Year-to-date Change: -49.0% | |
| RUN Links: Profile News Message Board | |
| Charts:- Daily , Weekly | |
| Add RUN to Watchlist: View: Get Complete RUN Trend Analysis ➞ | |
 | GSAT Globalstar, Inc. |
| Sector: Technology | |
| SubSector: Wireless Communications | |
| MarketCap: 485.127 Millions | |
| Recent Price: 1.28 Smart Investing & Trading Score: 27 | |
| Day Percent Change: -1.54% Day Change: -0.02 | |
| Week Change: 0.79% Year-to-date Change: -34.0% | |
| GSAT Links: Profile News Message Board | |
| Charts:- Daily , Weekly | |
| Add GSAT to Watchlist: View: Get Complete GSAT Trend Analysis ➞ | |
 | TWOU 2U, Inc. |
| Sector: Technology | |
| SubSector: Application Software | |
| MarketCap: 1090.12 Millions | |
| Recent Price: 0.25 Smart Investing & Trading Score: 25 | |
| Day Percent Change: 4.17% Day Change: 0.01 | |
| Week Change: 0.81% Year-to-date Change: -79.7% | |
| TWOU Links: Profile News Message Board | |
| Charts:- Daily , Weekly | |
| Add TWOU to Watchlist: View: Get Complete TWOU Trend Analysis ➞ | |
| For tabular summary view of above stock list: Summary View ➞ 0 - 25 , 25 - 50 , 50 - 75 , 75 - 100 , 100 - 125 , 125 - 150 , 150 - 175 , 175 - 200 , 200 - 225 , 225 - 250 , 250 - 275 , 275 - 300 , 300 - 325 , 325 - 350 , 350 - 375 , 375 - 400 , 400 - 425 , 425 - 450 , 450 - 475 , 475 - 500 , 500 - 525 , 525 - 550 , 550 - 575 , 575 - 600 , 600 - 625 , 625 - 650 | ||
| Click To Change The Sort Order: By Market Cap or Company Size Performance: Year-to-date, Week and Day | |
| Select Chart Type: | ||
|
Best Stocks Today 12Stocks.com |
© 2024 12Stocks.com Terms & Conditions Privacy Contact Us
All Information Provided Only For Education And Not To Be Used For Investing or Trading. See Terms & Conditions


One More Thing ... Get Best Stocks Delivered Daily!
Never Ever Miss A Move With Our Top Ten Stocks Lists
Find Best Stocks In Any Market - Bull or Bear Market
Take A Peek At Our Top Ten Stocks Lists: Daily, Weekly, Year-to-Date & Top Trends
Find Best Stocks In Any Market - Bull or Bear Market
Take A Peek At Our Top Ten Stocks Lists: Daily, Weekly, Year-to-Date & Top Trends
Technology Stocks With Best Up Trends [0-bearish to 100-bullish]: Amesite [100], Ribbon [100], Allegro MicroSystems[100], Texas [100], Microchip [100], EchoStar [100], Analog Devices[100], Vishay Inter[100], JD.com [100], Sea [100], Jamf Holding[100]
Best Technology Stocks Year-to-Date:
Pagaya [581.02%], MicroCloud Hologram[574.82%], MediaCo Holding[364.79%], Uxin [169.61%], CXApp [167.95%], Super Micro[165.5%], Smith Micro[162.71%], SoundHound AI[103.27%], MicroStrategy [100.38%], GigaCloud [96.01%], NextNav [95.73%] Best Technology Stocks This Week:
Matterport [166.09%], Amesite [69.72%], WiMi Hologram[64.85%], Ribbon [25.97%], HashiCorp [23.7%], SoundHound AI[22.54%], Intchains [20.36%], iQIYI [17.99%], Bilibili [16.87%], FTC Solar[16.56%], BigBear.ai [16.55%] Best Technology Stocks Daily:
Amesite [65.50%], WiMi Hologram[58.53%], Ribbon [26.46%], Intchains [22.28%], Uxin [13.86%], Bilibili [10.97%], Comtech Tele[10.76%], Mitcham Industries[9.88%], Navitas Semiconductor[8.83%], FTC Solar[8.51%], AMTD Digital[8.33%]