
 Login Sign Up


| |||||
 |  | ||||

| 12Stocks.com Market Intelligence |
Best Tech Stocks
| In a hurry? Tech Stocks Lists: Performance & Trends, Stock Charts, FANG Stocks
Sort Tech stocks: Daily, Weekly, Year-to-Date, Market Cap & Trends. Filter Tech stocks list by size:All Tech Large Mid-Range Small and MicroCap |
| 12Stocks.com Tech Stocks Performances & Trends Daily | |||||||||
|
|  The overall Smart Investing & Trading Score is 25 (0-bearish to 100-bullish) which puts Technology sector in short term bearish to neutral trend. The Smart Investing & Trading Score from previous trading session is 10 and hence an improvement of trend.
| ||||||||
Here are the Smart Investing & Trading Scores of the most requested Technology stocks at 12Stocks.com (click stock name for detailed review):
|

| 12Stocks.com: Investing in Technology sector with Stocks | |
|
The following table helps investors and traders sort through current performance and trends (as measured by Smart Investing & Trading Score) of various
stocks in the Tech sector. Quick View: Move mouse or cursor over stock symbol (ticker) to view short-term technical chart and over stock name to view long term chart. Click on  to add stock symbol to your watchlist and to add stock symbol to your watchlist and  to view watchlist. Click on any ticker or stock name for detailed market intelligence report for that stock. to view watchlist. Click on any ticker or stock name for detailed market intelligence report for that stock. |
12Stocks.com Performance of Stocks in Tech Sector
| Ticker | Stock Name | Watchlist | Category | Recent Price | Smart Investing & Trading Score | Change % | YTD Change% |
| RCI | Rogers |   | Wireless | 39.51 | 57 | 1.06% | -15.61% |
| PINC | Premier | | Healthcare Information | 21.18 | 57 | 0.62% | -5.28% |
| PRGS | Progress Software | | Software | 51.48 | 57 | 0.58% | -5.18% |
| GIB | CGI | | IT | 106.16 | 57 | 0.25% | -0.98% |
| MYNA | Mynaric AG | | Communication | 5.54 | 57 | 0.01% | -10.58% |
| MODN | Model N | | Software | 29.61 | 56 | 0.17% | 9.95% |
| RSKD | Riskified | | Software - | 5.06 | 56 | 2.85% | 8.12% |
| HOOD | Robinhood Markets | | Software - Infrastructure | 17.55 | 56 | 2.01% | 38.37% |
| HUBB | Hubbell | | Electronics | 396.38 | 56 | 1.49% | 20.51% |
| AYI | Acuity Brands | | Electronics | 252.78 | 56 | 1.27% | 23.41% |
| STER | Sterling Check | | Software - Infrastructure | 15.21 | 56 | 0.53% | 9.19% |
| GRMN | Garmin | | Instruments | 141.60 | 56 | 0.41% | 10.16% |
| SMTC | Semtech | | Semiconductor | 33.40 | 55 | 4.15% | 52.44% |
| PCTY | Paylocity Holding | | Software | 163.47 | 55 | 2.45% | -0.84% |
| FRSH | Freshworks | | Software - | 18.57 | 55 | 2.15% | -20.95% |
| FTNT | Fortinet | | Software | 64.56 | 55 | 1.37% | 10.30% |
| JKHY | Jack Henry | | IT | 166.66 | 55 | 1.11% | 1.99% |
| ESE | ESCO | | Instruments | 102.34 | 55 | 0.61% | -12.55% |
| TCX | Tucows | | Internet | 17.62 | 54 | 0.00% | -34.74% |
| SIMO | Silicon Motion | | Electronics | 73.14 | 54 | 0.93% | 19.38% |
| VZIO | VIZIO Holding | | Consumer Electronics | 10.76 | 54 | 0.00% | 39.56% |
| OUST | Ouster | | Electronic Components | 7.33 | 53 | 4.27% | -4.50% |
| DGII | Digi | | Communication | 30.14 | 53 | 2.20% | 15.92% |
| CRUS | Cirrus Logic | | Semiconductor | 85.34 | 53 | 1.03% | 2.58% |
| FENG | Phoenix New | | Internet | 1.86 | 53 | 0.00% | 36.76% |
| For chart view version of above stock list: Chart View ➞ 0 - 25 , 25 - 50 , 50 - 75 , 75 - 100 , 100 - 125 , 125 - 150 , 150 - 175 , 175 - 200 , 200 - 225 , 225 - 250 , 250 - 275 , 275 - 300 , 300 - 325 , 325 - 350 , 350 - 375 , 375 - 400 , 400 - 425 , 425 - 450 , 450 - 475 , 475 - 500 , 500 - 525 | ||
 | Click To Change The Sort Order: By Market Cap or Company Size Performance: Year-to-date, Week and Day |  |
|
Get the most comprehensive stock market coverage daily at 12Stocks.com ➞ Best Stocks Today ➞ Best Stocks Weekly ➞ Best Stocks Year-to-Date ➞ Best Stocks Trends ➞  Best Stocks Today 12Stocks.com Best Nasdaq Stocks ➞ Best S&P 500 Stocks ➞ Best Tech Stocks ➞ Best Biotech Stocks ➞ |
| Detailed Overview of Tech Stocks |
| Tech Technical Overview, Leaders & Laggards, Top Tech ETF Funds & Detailed Tech Stocks List, Charts, Trends & More |
| Tech Sector: Technical Analysis, Trends & YTD Performance | |
| Technology sector is composed of stocks
from semiconductors, software, web, social media
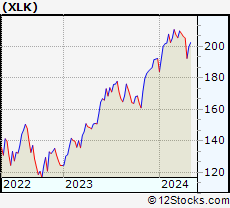
and services subsectors. Technology sector, as represented by XLK, an exchange-traded fund [ETF] that holds basket of tech stocks (e.g, Intel, Google) is up by 1.88% and is currently underperforming the overall market by -3.26% year-to-date. Below is a quick view of technical charts and trends: |
|
 XLK Weekly Chart |
|
| Long Term Trend: Not Good | |
| Medium Term Trend: Not Good | |
 XLK Daily Chart |
|
| Short Term Trend: Deteriorating | |
| Overall Trend Score: 25 | |
| YTD Performance: 1.88% | |
| **Trend Scores & Views Are Only For Educational Purposes And Not For Investing | |
| 12Stocks.com: Top Performing Technology Sector Stocks | ||||||||||||||||||||||||||||||||||||||||||||||||
 The top performing Technology sector stocks year to date are
Now, more recently, over last week, the top performing Technology sector stocks on the move are


|
||||||||||||||||||||||||||||||||||||||||||||||||
| 12Stocks.com: Investing in Tech Sector using Exchange Traded Funds | |
|
The following table shows list of key exchange traded funds (ETF) that
help investors track Tech Index. For detailed view, check out our ETF Funds section of our website. Quick View: Move mouse or cursor over ETF symbol (ticker) to view short-term technical chart and over ETF name to view long term chart. Click on ticker or stock name for detailed view. Click on to add stock symbol to your watchlist and to view watchlist. |
12Stocks.com List of ETFs that track Tech Index
| Ticker | ETF Name | Watchlist | Recent Price | Smart Investing & Trading Score | Change % | Week % | Year-to-date % |
| XLK | Technology | | 196.09 | 25 | 0.95 | 1.85 | 1.88% |
| QQQ | QQQ | | 422.43 | 51 | 1.96 | 1.88 | 3.15% |
| IYW | Technology | | 127.68 | 30 | 1.14 | 2.35 | 4.02% |
| VGT | Information Technology | | 491.61 | 17 | 1.06 | 2.44 | 1.57% |
| IGV | Tech-Software | | 80.50 | 25 | 1.28 | 2.5 | -0.78% |
| TQQQ | QQQ | | 52.18 | 17 | 2.47 | 5.46 | 2.92% |
| SQQQ | Short QQQ | | 12.16 | 45 | -2.49 | -5.3 | -9.59% |
| SOXL | Semicondct Bull 3X | | 33.40 | 43 | 4.15 | 8.48 | 6.37% |
| SOXS | Semicondct Bear 3X | | 42.27 | 73 | -3.87 | -8.37 | 626.29% |
| SOXX | PHLX Semiconductor | | 204.24 | 43 | 1.28 | 2.95 | 6.36% |
| QTEC | First -100-Tech | | 177.80 | 17 | 0.82 | 2.22 | 1.33% |
| SMH | Semiconductor | | 205.67 | 43 | 1.31 | 3.24 | 17.61% |
| 12Stocks.com: Charts, Trends, Fundamental Data and Performances of Tech Stocks | |
|
We now take in-depth look at all Tech stocks including charts, multi-period performances and overall trends (as measured by Smart Investing & Trading Score). One can sort Tech stocks (click link to choose) by Daily, Weekly and by Year-to-Date performances. Also, one can sort by size of the company or by market capitalization. |
| Select Your Default Chart Type: | |||||
| |||||
| Click on stock symbol or name for detailed view. Click on to add stock symbol to your watchlist and to view watchlist. Quick View: Move mouse or cursor over "Daily" to quickly view daily technical stock chart and over "Weekly" to view weekly technical stock chart. | |||||


 | RCI Rogers Communications Inc. |
| Sector: Technology | |
| SubSector: Wireless Communications | |
| MarketCap: 22111.6 Millions | |
| Recent Price: 39.51 Smart Investing & Trading Score: 57 | |
| Day Percent Change: 1.06% Day Change: 0.41 | |
| Week Change: 2.5% Year-to-date Change: -15.6% | |
| RCI Links: Profile News Message Board | |
| Charts:- Daily , Weekly | |
| Add RCI to Watchlist: View: Get Complete RCI Trend Analysis ➞ | |
 | PINC Premier, Inc. |
| Sector: Technology | |
| SubSector: Healthcare Information Services | |
| MarketCap: 2044.85 Millions | |
| Recent Price: 21.18 Smart Investing & Trading Score: 57 | |
| Day Percent Change: 0.62% Day Change: 0.13 | |
| Week Change: 0% Year-to-date Change: -5.3% | |
| PINC Links: Profile News Message Board | |
| Charts:- Daily , Weekly | |
| Add PINC to Watchlist: View: Get Complete PINC Trend Analysis ➞ | |
 | PRGS Progress Software Corporation |
| Sector: Technology | |
| SubSector: Application Software | |
| MarketCap: 1407.22 Millions | |
| Recent Price: 51.48 Smart Investing & Trading Score: 57 | |
| Day Percent Change: 0.58% Day Change: 0.30 | |
| Week Change: 2.13% Year-to-date Change: -5.2% | |
| PRGS Links: Profile News Message Board | |
| Charts:- Daily , Weekly | |
| Add PRGS to Watchlist: View: Get Complete PRGS Trend Analysis ➞ | |
 | GIB CGI Inc. |
| Sector: Technology | |
| SubSector: Information Technology Services | |
| MarketCap: 13185.3 Millions | |
| Recent Price: 106.16 Smart Investing & Trading Score: 57 | |
| Day Percent Change: 0.25% Day Change: 0.27 | |
| Week Change: 2.07% Year-to-date Change: -1.0% | |
| GIB Links: Profile News Message Board | |
| Charts:- Daily , Weekly | |
| Add GIB to Watchlist: View: Get Complete GIB Trend Analysis ➞ | |
 | MYNA Mynaric AG |
| Sector: Technology | |
| SubSector: Communication Equipment | |
| MarketCap: 152 Millions | |
| Recent Price: 5.54 Smart Investing & Trading Score: 57 | |
| Day Percent Change: 0.01% Day Change: 0.00 | |
| Week Change: -0.71% Year-to-date Change: -10.6% | |
| MYNA Links: Profile News Message Board | |
| Charts:- Daily , Weekly | |
| Add MYNA to Watchlist: View: Get Complete MYNA Trend Analysis ➞ | |
 | MODN Model N, Inc. |
| Sector: Technology | |
| SubSector: Application Software | |
| MarketCap: 670.162 Millions | |
| Recent Price: 29.61 Smart Investing & Trading Score: 56 | |
| Day Percent Change: 0.17% Day Change: 0.05 | |
| Week Change: -0.03% Year-to-date Change: 10.0% | |
| MODN Links: Profile News Message Board | |
| Charts:- Daily , Weekly | |
| Add MODN to Watchlist: View: Get Complete MODN Trend Analysis ➞ | |
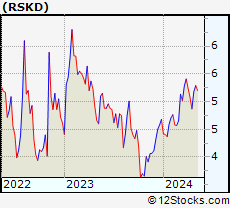 | RSKD Riskified Ltd. |
| Sector: Technology | |
| SubSector: Software - Application | |
| MarketCap: 819 Millions | |
| Recent Price: 5.06 Smart Investing & Trading Score: 56 | |
| Day Percent Change: 2.85% Day Change: 0.14 | |
| Week Change: 3.9% Year-to-date Change: 8.1% | |
| RSKD Links: Profile News Message Board | |
| Charts:- Daily , Weekly | |
| Add RSKD to Watchlist: View: Get Complete RSKD Trend Analysis ➞ | |
 | HOOD Robinhood Markets, Inc. |
| Sector: Technology | |
| SubSector: Software - Infrastructure | |
| MarketCap: 9200 Millions | |
| Recent Price: 17.55 Smart Investing & Trading Score: 56 | |
| Day Percent Change: 2.01% Day Change: 0.35 | |
| Week Change: 5.5% Year-to-date Change: 38.4% | |
| HOOD Links: Profile News Message Board | |
| Charts:- Daily , Weekly | |
| Add HOOD to Watchlist: View: Get Complete HOOD Trend Analysis ➞ | |
 | HUBB Hubbell Incorporated |
| Sector: Technology | |
| SubSector: Diversified Electronics | |
| MarketCap: 6002.46 Millions | |
| Recent Price: 396.38 Smart Investing & Trading Score: 56 | |
| Day Percent Change: 1.49% Day Change: 5.82 | |
| Week Change: 2.15% Year-to-date Change: 20.5% | |
| HUBB Links: Profile News Message Board | |
| Charts:- Daily , Weekly | |
| Add HUBB to Watchlist: View: Get Complete HUBB Trend Analysis ➞ | |
 | AYI Acuity Brands, Inc. |
| Sector: Technology | |
| SubSector: Diversified Electronics | |
| MarketCap: 3356.66 Millions | |
| Recent Price: 252.78 Smart Investing & Trading Score: 56 | |
| Day Percent Change: 1.27% Day Change: 3.18 | |
| Week Change: 2.32% Year-to-date Change: 23.4% | |
| AYI Links: Profile News Message Board | |
| Charts:- Daily , Weekly | |
| Add AYI to Watchlist: View: Get Complete AYI Trend Analysis ➞ | |
 | STER Sterling Check Corp. |
| Sector: Technology | |
| SubSector: Software - Infrastructure | |
| MarketCap: 1180 Millions | |
| Recent Price: 15.21 Smart Investing & Trading Score: 56 | |
| Day Percent Change: 0.53% Day Change: 0.08 | |
| Week Change: 1.54% Year-to-date Change: 9.2% | |
| STER Links: Profile News Message Board | |
| Charts:- Daily , Weekly | |
| Add STER to Watchlist: View: Get Complete STER Trend Analysis ➞ | |
 | GRMN Garmin Ltd. |
| Sector: Technology | |
| SubSector: Scientific & Technical Instruments | |
| MarketCap: 13909.3 Millions | |
| Recent Price: 141.60 Smart Investing & Trading Score: 56 | |
| Day Percent Change: 0.41% Day Change: 0.58 | |
| Week Change: 1.49% Year-to-date Change: 10.2% | |
| GRMN Links: Profile News Message Board | |
| Charts:- Daily , Weekly | |
| Add GRMN to Watchlist: View: Get Complete GRMN Trend Analysis ➞ | |
 | SMTC Semtech Corporation |
| Sector: Technology | |
| SubSector: Semiconductor - Integrated Circuits | |
| MarketCap: 2285 Millions | |
| Recent Price: 33.40 Smart Investing & Trading Score: 55 | |
| Day Percent Change: 4.15% Day Change: 1.33 | |
| Week Change: 7.57% Year-to-date Change: 52.4% | |
| SMTC Links: Profile News Message Board | |
| Charts:- Daily , Weekly | |
| Add SMTC to Watchlist: View: Get Complete SMTC Trend Analysis ➞ | |
 | PCTY Paylocity Holding Corporation |
| Sector: Technology | |
| SubSector: Application Software | |
| MarketCap: 4972.82 Millions | |
| Recent Price: 163.47 Smart Investing & Trading Score: 55 | |
| Day Percent Change: 2.45% Day Change: 3.91 | |
| Week Change: 3.97% Year-to-date Change: -0.8% | |
| PCTY Links: Profile News Message Board | |
| Charts:- Daily , Weekly | |
| Add PCTY to Watchlist: View: Get Complete PCTY Trend Analysis ➞ | |
 | FRSH Freshworks Inc. |
| Sector: Technology | |
| SubSector: Software - Application | |
| MarketCap: 5000 Millions | |
| Recent Price: 18.57 Smart Investing & Trading Score: 55 | |
| Day Percent Change: 2.15% Day Change: 0.39 | |
| Week Change: 5.57% Year-to-date Change: -21.0% | |
| FRSH Links: Profile News Message Board | |
| Charts:- Daily , Weekly | |
| Add FRSH to Watchlist: View: Get Complete FRSH Trend Analysis ➞ | |
 | FTNT Fortinet, Inc. |
| Sector: Technology | |
| SubSector: Application Software | |
| MarketCap: 16993.8 Millions | |
| Recent Price: 64.56 Smart Investing & Trading Score: 55 | |
| Day Percent Change: 1.37% Day Change: 0.87 | |
| Week Change: 1.83% Year-to-date Change: 10.3% | |
| FTNT Links: Profile News Message Board | |
| Charts:- Daily , Weekly | |
| Add FTNT to Watchlist: View: Get Complete FTNT Trend Analysis ➞ | |
 | JKHY Jack Henry & Associates, Inc. |
| Sector: Technology | |
| SubSector: Information Technology Services | |
| MarketCap: 10695.4 Millions | |
| Recent Price: 166.66 Smart Investing & Trading Score: 55 | |
| Day Percent Change: 1.11% Day Change: 1.82 | |
| Week Change: 0.64% Year-to-date Change: 2.0% | |
| JKHY Links: Profile News Message Board | |
| Charts:- Daily , Weekly | |
| Add JKHY to Watchlist: View: Get Complete JKHY Trend Analysis ➞ | |
 | ESE ESCO Technologies Inc. |
| Sector: Technology | |
| SubSector: Scientific & Technical Instruments | |
| MarketCap: 1968.03 Millions | |
| Recent Price: 102.34 Smart Investing & Trading Score: 55 | |
| Day Percent Change: 0.61% Day Change: 0.62 | |
| Week Change: 1.41% Year-to-date Change: -12.6% | |
| ESE Links: Profile News Message Board | |
| Charts:- Daily , Weekly | |
| Add ESE to Watchlist: View: Get Complete ESE Trend Analysis ➞ | |
 | TCX Tucows Inc. |
| Sector: Technology | |
| SubSector: Internet Information Providers | |
| MarketCap: 557.78 Millions | |
| Recent Price: 17.62 Smart Investing & Trading Score: 54 | |
| Day Percent Change: 0.00% Day Change: 0.00 | |
| Week Change: 0.63% Year-to-date Change: -34.7% | |
| TCX Links: Profile News Message Board | |
| Charts:- Daily , Weekly | |
| Add TCX to Watchlist: View: Get Complete TCX Trend Analysis ➞ | |
 | SIMO Silicon Motion Technology Corporation |
| Sector: Technology | |
| SubSector: Diversified Electronics | |
| MarketCap: 1186.66 Millions | |
| Recent Price: 73.14 Smart Investing & Trading Score: 54 | |
| Day Percent Change: 0.93% Day Change: 0.67 | |
| Week Change: 1.82% Year-to-date Change: 19.4% | |
| SIMO Links: Profile News Message Board | |
| Charts:- Daily , Weekly | |
| Add SIMO to Watchlist: View: Get Complete SIMO Trend Analysis ➞ | |
 | VZIO VIZIO Holding Corp. |
| Sector: Technology | |
| SubSector: Consumer Electronics | |
| MarketCap: 1300 Millions | |
| Recent Price: 10.76 Smart Investing & Trading Score: 54 | |
| Day Percent Change: 0.00% Day Change: 0.00 | |
| Week Change: -0.19% Year-to-date Change: 39.6% | |
| VZIO Links: Profile News Message Board | |
| Charts:- Daily , Weekly | |
| Add VZIO to Watchlist: View: Get Complete VZIO Trend Analysis ➞ | |
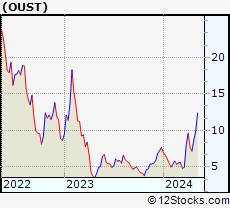 | OUST Ouster, Inc. |
| Sector: Technology | |
| SubSector: Electronic Components | |
| MarketCap: 193 Millions | |
| Recent Price: 7.33 Smart Investing & Trading Score: 53 | |
| Day Percent Change: 4.27% Day Change: 0.30 | |
| Week Change: 2.37% Year-to-date Change: -4.5% | |
| OUST Links: Profile News Message Board | |
| Charts:- Daily , Weekly | |
| Add OUST to Watchlist: View: Get Complete OUST Trend Analysis ➞ | |
 | DGII Digi International Inc. |
| Sector: Technology | |
| SubSector: Communication Equipment | |
| MarketCap: 257.339 Millions | |
| Recent Price: 30.14 Smart Investing & Trading Score: 53 | |
| Day Percent Change: 2.20% Day Change: 0.65 | |
| Week Change: 2.83% Year-to-date Change: 15.9% | |
| DGII Links: Profile News Message Board | |
| Charts:- Daily , Weekly | |
| Add DGII to Watchlist: View: Get Complete DGII Trend Analysis ➞ | |
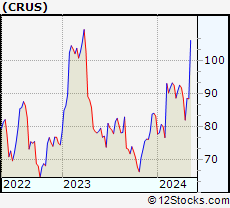 | CRUS Cirrus Logic, Inc. |
| Sector: Technology | |
| SubSector: Semiconductor - Specialized | |
| MarketCap: 3852.6 Millions | |
| Recent Price: 85.34 Smart Investing & Trading Score: 53 | |
| Day Percent Change: 1.03% Day Change: 0.87 | |
| Week Change: 4.05% Year-to-date Change: 2.6% | |
| CRUS Links: Profile News Message Board | |
| Charts:- Daily , Weekly | |
| Add CRUS to Watchlist: View: Get Complete CRUS Trend Analysis ➞ | |
 | FENG Phoenix New Media Limited |
| Sector: Technology | |
| SubSector: Internet Information Providers | |
| MarketCap: 107.08 Millions | |
| Recent Price: 1.86 Smart Investing & Trading Score: 53 | |
| Day Percent Change: 0.00% Day Change: 0.00 | |
| Week Change: 2.2% Year-to-date Change: 36.8% | |
| FENG Links: Profile News Message Board | |
| Charts:- Daily , Weekly | |
| Add FENG to Watchlist: View: Get Complete FENG Trend Analysis ➞ | |
| For tabular summary view of above stock list: Summary View ➞ 0 - 25 , 25 - 50 , 50 - 75 , 75 - 100 , 100 - 125 , 125 - 150 , 150 - 175 , 175 - 200 , 200 - 225 , 225 - 250 , 250 - 275 , 275 - 300 , 300 - 325 , 325 - 350 , 350 - 375 , 375 - 400 , 400 - 425 , 425 - 450 , 450 - 475 , 475 - 500 , 500 - 525 | ||
| Click To Change The Sort Order: By Market Cap or Company Size Performance: Year-to-date, Week and Day | |
| Select Chart Type: | ||
|
Best Stocks Today 12Stocks.com |
© 2024 12Stocks.com Terms & Conditions Privacy Contact Us
All Information Provided Only For Education And Not To Be Used For Investing or Trading. See Terms & Conditions


One More Thing ... Get Best Stocks Delivered Daily!
Never Ever Miss A Move With Our Top Ten Stocks Lists
Find Best Stocks In Any Market - Bull or Bear Market
Take A Peek At Our Top Ten Stocks Lists: Daily, Weekly, Year-to-Date & Top Trends
Find Best Stocks In Any Market - Bull or Bear Market
Take A Peek At Our Top Ten Stocks Lists: Daily, Weekly, Year-to-Date & Top Trends
Technology Stocks With Best Up Trends [0-bearish to 100-bullish]: Payoneer Global[100], Descartes Systems[100], Grab [100], Cricut [100], Badger Meter[100], Liberty Latin[100], JD.com [100], Telefonica S.A[100], Vodafone [100], EchoStar [100], Full Truck[100]
Best Technology Stocks Year-to-Date:
Pagaya [584.67%], CXApp [175.68%], Super Micro[167.81%], Smith Micro[160.29%], MicroStrategy [113.41%], GigaCloud [97.98%], SoundHound AI[89.95%], NextNav [89.66%], D-Wave Quantum[84.07%], AppLovin [79.12%], Matterport [72.04%] Best Technology Stocks This Week:
Matterport [166.95%], BigBear.ai [18.62%], MicroStrategy [14.8%], Bitdeer [14.78%], SoundHound AI[14.51%], Rigetti Computing[13.64%], Stem [13.55%], IonQ [13.54%], Aerohive Networks[11.81%], CommScope Holding[11.06%], Digital Turbine[10.81%] Best Technology Stocks Daily:
Rigetti Computing[10.62%], BigBear.ai [10.26%], Digital Turbine[10.22%], HealthStream [9.12%], Stem [8.64%], 8x8 [8.18%], LivePerson [8.05%], SoundHound AI[7.54%], IonQ [7.48%], Sunrun [7.26%], D-Wave Quantum[6.95%]