
 Login Sign Up


| |||||
 |  | ||||

| 12Stocks.com Market Intelligence |
Best Tech Stocks
| In a hurry? Tech Stocks Lists: Performance & Trends, Stock Charts, FANG Stocks
Sort Tech stocks: Daily, Weekly, Year-to-Date, Market Cap & Trends. Filter Tech stocks list by size:All Tech Large Mid-Range Small and MicroCap |
| 12Stocks.com Tech Stocks Performances & Trends Daily | |||||||||
|
|  The overall Smart Investing & Trading Score is 45 (0-bearish to 100-bullish) which puts Technology sector in short term neutral trend. The Smart Investing & Trading Score from previous trading session is 38 and hence an improvement of trend.
| ||||||||
Here are the Smart Investing & Trading Scores of the most requested Technology stocks at 12Stocks.com (click stock name for detailed review):
|


| 12Stocks.com: Investing in Technology sector with Stocks | |
|
The following table helps investors and traders sort through current performance and trends (as measured by Smart Investing & Trading Score) of various
stocks in the Tech sector. Quick View: Move mouse or cursor over stock symbol (ticker) to view short-term technical chart and over stock name to view long term chart. Click on  to add stock symbol to your watchlist and to add stock symbol to your watchlist and  to view watchlist. Click on any ticker or stock name for detailed market intelligence report for that stock. to view watchlist. Click on any ticker or stock name for detailed market intelligence report for that stock. |
12Stocks.com Performance of Stocks in Tech Sector
| Ticker | Stock Name | Watchlist | Category | Recent Price | Smart Investing & Trading Score | Change % | YTD Change% |
| OLED | Universal Display |   | Semiconductor | 156.44 | 42 | 1.65% | -18.21% |
| ACLS | Axcelis | | Semiconductor | 98.68 | 42 | 1.48% | -23.91% |
| KLIC | Kulicke and | | Semiconductor | 46.73 | 42 | 1.21% | -14.60% |
| YALA | Yalla | | Software | 4.71 | 42 | 1.07% | -23.16% |
| DV | DoubleVerify | | Software - | 30.79 | 42 | 0.98% | -16.29% |
| ADBE | Adobe | | Software | 477.12 | 42 | 0.89% | -20.03% |
| TTWO | Take-Two Interactive | | Software | 142.83 | 42 | 0.78% | -11.26% |
| FN | Fabrinet | | Electronic | 169.93 | 42 | 0.75% | -10.72% |
| CIEN | Ciena | | Communication | 45.04 | 42 | 0.72% | 0.07% |
| NOW | ServiceNow | | IT | 746.29 | 42 | 0.72% | 5.63% |
| RPD | Rapid7 | | Software | 46.49 | 42 | 0.69% | -18.58% |
| INTC | Intel | | Semiconductor | 34.50 | 42 | 0.64% | -31.34% |
| INTA | Intapp | | Software - | 31.09 | 42 | 0.58% | -18.55% |
| GRPN | on | | Internet | 10.60 | 42 | 0.57% | -17.45% |
| EXTR | Extreme Networks | | Communication | 11.15 | 42 | 0.54% | -36.79% |
| ST | Sensata | | Instruments | 34.42 | 42 | 0.47% | -8.38% |
| PINC | Premier | | Healthcare Information | 21.12 | 42 | 0.43% | -5.55% |
| AMPL | Amplitude | | Software - | 9.84 | 42 | 0.15% | -22.92% |
| RMBS | Rambus | | Semiconductor- | 56.52 | 42 | 0.14% | -17.19% |
| PATH | UiPath | | Software - Infrastructure | 19.57 | 42 | 0.13% | -21.24% |
| NCNO | nCino | | Software | 30.18 | 42 | 0.07% | -10.26% |
| KLTR | Kaltura | | Software - | 1.25 | 42 | 0.00% | -36.22% |
| PHR | Phreesia | | Healthcare Information | 21.94 | 42 | -5.19% | -5.23% |
| TUYA | Tuya | | Software - Infrastructure | 1.65 | 42 | -4.62% | -28.10% |
| BTDR | Bitdeer | | Software - | 6.46 | 42 | -3.58% | -37.34% |
| For chart view version of above stock list: Chart View ➞ 0 - 25 , 25 - 50 , 50 - 75 , 75 - 100 , 100 - 125 , 125 - 150 , 150 - 175 , 175 - 200 , 200 - 225 , 225 - 250 , 250 - 275 , 275 - 300 , 300 - 325 , 325 - 350 , 350 - 375 , 375 - 400 , 400 - 425 , 425 - 450 , 450 - 475 , 475 - 500 , 500 - 525 , 525 - 550 , 550 - 575 , 575 - 600 , 600 - 625 , 625 - 650 | ||
 | Click To Change The Sort Order: By Market Cap or Company Size Performance: Year-to-date, Week and Day |  |
|
Get the most comprehensive stock market coverage daily at 12Stocks.com ➞ Best Stocks Today ➞ Best Stocks Weekly ➞ Best Stocks Year-to-Date ➞ Best Stocks Trends ➞  Best Stocks Today 12Stocks.com Best Nasdaq Stocks ➞ Best S&P 500 Stocks ➞ Best Tech Stocks ➞ Best Biotech Stocks ➞ |
| Detailed Overview of Tech Stocks |
| Tech Technical Overview, Leaders & Laggards, Top Tech ETF Funds & Detailed Tech Stocks List, Charts, Trends & More |
| Tech Sector: Technical Analysis, Trends & YTD Performance | |
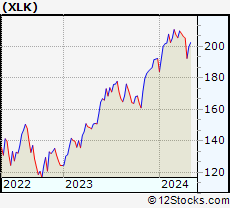
| Technology sector is composed of stocks
from semiconductors, software, web, social media
and services subsectors. Technology sector, as represented by XLK, an exchange-traded fund [ETF] that holds basket of tech stocks (e.g, Intel, Google) is up by 2.88% and is currently underperforming the overall market by -2.78% year-to-date. Below is a quick view of technical charts and trends: |
|
 XLK Weekly Chart |
|
| Long Term Trend: Good | |
| Medium Term Trend: Not Good | |
 XLK Daily Chart |
|
| Short Term Trend: Very Good | |
| Overall Trend Score: 45 | |
| YTD Performance: 2.88% | |
| **Trend Scores & Views Are Only For Educational Purposes And Not For Investing | |
| 12Stocks.com: Top Performing Technology Sector Stocks | ||||||||||||||||||||||||||||||||||||||||||||||||
 The top performing Technology sector stocks year to date are
Now, more recently, over last week, the top performing Technology sector stocks on the move are


|
||||||||||||||||||||||||||||||||||||||||||||||||
| 12Stocks.com: Investing in Tech Sector using Exchange Traded Funds | |
|
The following table shows list of key exchange traded funds (ETF) that
help investors track Tech Index. For detailed view, check out our ETF Funds section of our website. Quick View: Move mouse or cursor over ETF symbol (ticker) to view short-term technical chart and over ETF name to view long term chart. Click on ticker or stock name for detailed view. Click on to add stock symbol to your watchlist and to view watchlist. |
12Stocks.com List of ETFs that track Tech Index
| Ticker | ETF Name | Watchlist | Recent Price | Smart Investing & Trading Score | Change % | Week % | Year-to-date % |
| XLK | Technology | | 198.03 | 45 | 0.46 | 2.86 | 2.88% |
| QQQ | QQQ | | 426.51 | 58 | 0.34 | 2.86 | 4.15% |
| IYW | Technology | | 128.84 | 58 | 0.25 | 3.28 | 4.96% |
| VGT | Information Technology | | 495.24 | 45 | 0.16 | 3.2 | 2.32% |
| IXN | Global Tech | | 70.84 | 43 | 0.47 | 3.08 | 3.9% |
| IGV | Tech-Software | | 80.94 | 32 | 0.10 | 3.07 | -0.23% |
| XSD | Semiconductor | | 215.54 | 30 | 2.30 | 5.89 | -4.11% |
| TQQQ | QQQ | | 53.71 | 58 | 0.98 | 8.55 | 5.94% |
| SQQQ | Short QQQ | | 11.81 | 37 | -0.84 | -8.02 | -12.19% |
| SOXL | Semicondct Bull 3X | | 35.49 | 58 | 4.05 | 15.26 | 13.03% |
| SOXS | Semicondct Bear 3X | | 39.61 | 58 | -3.81 | -14.13 | 580.58% |
| SOXX | PHLX Semiconductor | | 208.54 | 58 | 1.30 | 5.12 | 8.6% |
| QTEC | First -100-Tech | | 181.14 | 58 | 0.69 | 4.14 | 3.23% |
| SMH | Semiconductor | | 208.04 | 58 | 0.12 | 4.43 | 18.97% |
| 12Stocks.com: Charts, Trends, Fundamental Data and Performances of Tech Stocks | |
|
We now take in-depth look at all Tech stocks including charts, multi-period performances and overall trends (as measured by Smart Investing & Trading Score). One can sort Tech stocks (click link to choose) by Daily, Weekly and by Year-to-Date performances. Also, one can sort by size of the company or by market capitalization. |
| Select Your Default Chart Type: | |||||
| |||||
| Click on stock symbol or name for detailed view. Click on to add stock symbol to your watchlist and to view watchlist. Quick View: Move mouse or cursor over "Daily" to quickly view daily technical stock chart and over "Weekly" to view weekly technical stock chart. | |||||


 | OLED Universal Display Corporation |
| Sector: Technology | |
| SubSector: Semiconductor Equipment & Materials | |
| MarketCap: 5660.08 Millions | |
| Recent Price: 156.44 Smart Investing & Trading Score: 42 | |
| Day Percent Change: 1.65% Day Change: 2.54 | |
| Week Change: 4.43% Year-to-date Change: -18.2% | |
| OLED Links: Profile News Message Board | |
| Charts:- Daily , Weekly | |
| Add OLED to Watchlist: View: Get Complete OLED Trend Analysis ➞ | |
 | ACLS Axcelis Technologies, Inc. |
| Sector: Technology | |
| SubSector: Semiconductor Equipment & Materials | |
| MarketCap: 498.518 Millions | |
| Recent Price: 98.68 Smart Investing & Trading Score: 42 | |
| Day Percent Change: 1.48% Day Change: 1.44 | |
| Week Change: 4.1% Year-to-date Change: -23.9% | |
| ACLS Links: Profile News Message Board | |
| Charts:- Daily , Weekly | |
| Add ACLS to Watchlist: View: Get Complete ACLS Trend Analysis ➞ | |
 | KLIC Kulicke and Soffa Industries, Inc. |
| Sector: Technology | |
| SubSector: Semiconductor Equipment & Materials | |
| MarketCap: 1336.68 Millions | |
| Recent Price: 46.73 Smart Investing & Trading Score: 42 | |
| Day Percent Change: 1.21% Day Change: 0.56 | |
| Week Change: 4.08% Year-to-date Change: -14.6% | |
| KLIC Links: Profile News Message Board | |
| Charts:- Daily , Weekly | |
| Add KLIC to Watchlist: View: Get Complete KLIC Trend Analysis ➞ | |
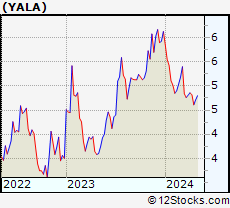 | YALA Yalla Group Limited |
| Sector: Technology | |
| SubSector: Software Application | |
| MarketCap: 28987 Millions | |
| Recent Price: 4.71 Smart Investing & Trading Score: 42 | |
| Day Percent Change: 1.07% Day Change: 0.05 | |
| Week Change: 2.17% Year-to-date Change: -23.2% | |
| YALA Links: Profile News Message Board | |
| Charts:- Daily , Weekly | |
| Add YALA to Watchlist: View: Get Complete YALA Trend Analysis ➞ | |
 | DV DoubleVerify Holdings, Inc. |
| Sector: Technology | |
| SubSector: Software - Application | |
| MarketCap: 6500 Millions | |
| Recent Price: 30.79 Smart Investing & Trading Score: 42 | |
| Day Percent Change: 0.98% Day Change: 0.30 | |
| Week Change: 4.62% Year-to-date Change: -16.3% | |
| DV Links: Profile News Message Board | |
| Charts:- Daily , Weekly | |
| Add DV to Watchlist: View: Get Complete DV Trend Analysis ➞ | |
 | ADBE Adobe Inc. |
| Sector: Technology | |
| SubSector: Application Software | |
| MarketCap: 157868 Millions | |
| Recent Price: 477.12 Smart Investing & Trading Score: 42 | |
| Day Percent Change: 0.89% Day Change: 4.22 | |
| Week Change: 2.6% Year-to-date Change: -20.0% | |
| ADBE Links: Profile News Message Board | |
| Charts:- Daily , Weekly | |
| Add ADBE to Watchlist: View: Get Complete ADBE Trend Analysis ➞ | |
 | TTWO Take-Two Interactive Software, Inc. |
| Sector: Technology | |
| SubSector: Multimedia & Graphics Software | |
| MarketCap: 12479.6 Millions | |
| Recent Price: 142.83 Smart Investing & Trading Score: 42 | |
| Day Percent Change: 0.78% Day Change: 1.11 | |
| Week Change: 1.59% Year-to-date Change: -11.3% | |
| TTWO Links: Profile News Message Board | |
| Charts:- Daily , Weekly | |
| Add TTWO to Watchlist: View: Get Complete TTWO Trend Analysis ➞ | |
 | FN Fabrinet |
| Sector: Technology | |
| SubSector: Electronic Equipment | |
| MarketCap: 1876 Millions | |
| Recent Price: 169.93 Smart Investing & Trading Score: 42 | |
| Day Percent Change: 0.75% Day Change: 1.26 | |
| Week Change: 4.69% Year-to-date Change: -10.7% | |
| FN Links: Profile News Message Board | |
| Charts:- Daily , Weekly | |
| Add FN to Watchlist: View: Get Complete FN Trend Analysis ➞ | |
 | CIEN Ciena Corporation |
| Sector: Technology | |
| SubSector: Communication Equipment | |
| MarketCap: 6206.99 Millions | |
| Recent Price: 45.04 Smart Investing & Trading Score: 42 | |
| Day Percent Change: 0.72% Day Change: 0.32 | |
| Week Change: 3.4% Year-to-date Change: 0.1% | |
| CIEN Links: Profile News Message Board | |
| Charts:- Daily , Weekly | |
| Add CIEN to Watchlist: View: Get Complete CIEN Trend Analysis ➞ | |
 | NOW ServiceNow, Inc. |
| Sector: Technology | |
| SubSector: Information Technology Services | |
| MarketCap: 53599.1 Millions | |
| Recent Price: 746.29 Smart Investing & Trading Score: 42 | |
| Day Percent Change: 0.72% Day Change: 5.34 | |
| Week Change: 4.54% Year-to-date Change: 5.6% | |
| NOW Links: Profile News Message Board | |
| Charts:- Daily , Weekly | |
| Add NOW to Watchlist: View: Get Complete NOW Trend Analysis ➞ | |
 | RPD Rapid7, Inc. |
| Sector: Technology | |
| SubSector: Application Software | |
| MarketCap: 1981.12 Millions | |
| Recent Price: 46.49 Smart Investing & Trading Score: 42 | |
| Day Percent Change: 0.69% Day Change: 0.32 | |
| Week Change: 4.92% Year-to-date Change: -18.6% | |
| RPD Links: Profile News Message Board | |
| Charts:- Daily , Weekly | |
| Add RPD to Watchlist: View: Get Complete RPD Trend Analysis ➞ | |
 | INTC Intel Corporation |
| Sector: Technology | |
| SubSector: Semiconductor - Broad Line | |
| MarketCap: 222357 Millions | |
| Recent Price: 34.50 Smart Investing & Trading Score: 42 | |
| Day Percent Change: 0.64% Day Change: 0.22 | |
| Week Change: 0.88% Year-to-date Change: -31.3% | |
| INTC Links: Profile News Message Board | |
| Charts:- Daily , Weekly | |
| Add INTC to Watchlist: View: Get Complete INTC Trend Analysis ➞ | |
 | INTA Intapp, Inc. |
| Sector: Technology | |
| SubSector: Software - Application | |
| MarketCap: 2820 Millions | |
| Recent Price: 31.09 Smart Investing & Trading Score: 42 | |
| Day Percent Change: 0.58% Day Change: 0.18 | |
| Week Change: 1.07% Year-to-date Change: -18.6% | |
| INTA Links: Profile News Message Board | |
| Charts:- Daily , Weekly | |
| Add INTA to Watchlist: View: Get Complete INTA Trend Analysis ➞ | |
 | GRPN Groupon, Inc. |
| Sector: Technology | |
| SubSector: Internet Information Providers | |
| MarketCap: 363.18 Millions | |
| Recent Price: 10.60 Smart Investing & Trading Score: 42 | |
| Day Percent Change: 0.57% Day Change: 0.06 | |
| Week Change: 11.46% Year-to-date Change: -17.5% | |
| GRPN Links: Profile News Message Board | |
| Charts:- Daily , Weekly | |
| Add GRPN to Watchlist: View: Get Complete GRPN Trend Analysis ➞ | |
 | EXTR Extreme Networks, Inc. |
| Sector: Technology | |
| SubSector: Communication Equipment | |
| MarketCap: 339.939 Millions | |
| Recent Price: 11.15 Smart Investing & Trading Score: 42 | |
| Day Percent Change: 0.54% Day Change: 0.06 | |
| Week Change: 1.64% Year-to-date Change: -36.8% | |
| EXTR Links: Profile News Message Board | |
| Charts:- Daily , Weekly | |
| Add EXTR to Watchlist: View: Get Complete EXTR Trend Analysis ➞ | |
 | ST Sensata Technologies Holding plc |
| Sector: Technology | |
| SubSector: Scientific & Technical Instruments | |
| MarketCap: 4434.23 Millions | |
| Recent Price: 34.42 Smart Investing & Trading Score: 42 | |
| Day Percent Change: 0.47% Day Change: 0.16 | |
| Week Change: 2.14% Year-to-date Change: -8.4% | |
| ST Links: Profile News Message Board | |
| Charts:- Daily , Weekly | |
| Add ST to Watchlist: View: Get Complete ST Trend Analysis ➞ | |
 | PINC Premier, Inc. |
| Sector: Technology | |
| SubSector: Healthcare Information Services | |
| MarketCap: 2044.85 Millions | |
| Recent Price: 21.12 Smart Investing & Trading Score: 42 | |
| Day Percent Change: 0.43% Day Change: 0.09 | |
| Week Change: -0.28% Year-to-date Change: -5.6% | |
| PINC Links: Profile News Message Board | |
| Charts:- Daily , Weekly | |
| Add PINC to Watchlist: View: Get Complete PINC Trend Analysis ➞ | |
 | AMPL Amplitude, Inc. |
| Sector: Technology | |
| SubSector: Software - Application | |
| MarketCap: 1320 Millions | |
| Recent Price: 9.84 Smart Investing & Trading Score: 42 | |
| Day Percent Change: 0.15% Day Change: 0.02 | |
| Week Change: 3.96% Year-to-date Change: -22.9% | |
| AMPL Links: Profile News Message Board | |
| Charts:- Daily , Weekly | |
| Add AMPL to Watchlist: View: Get Complete AMPL Trend Analysis ➞ | |
 | RMBS Rambus Inc. |
| Sector: Technology | |
| SubSector: Semiconductor- Memory Chips | |
| MarketCap: 1296 Millions | |
| Recent Price: 56.52 Smart Investing & Trading Score: 42 | |
| Day Percent Change: 0.14% Day Change: 0.08 | |
| Week Change: 3.37% Year-to-date Change: -17.2% | |
| RMBS Links: Profile News Message Board | |
| Charts:- Daily , Weekly | |
| Add RMBS to Watchlist: View: Get Complete RMBS Trend Analysis ➞ | |
 | PATH UiPath Inc. |
| Sector: Technology | |
| SubSector: Software - Infrastructure | |
| MarketCap: 9580 Millions | |
| Recent Price: 19.57 Smart Investing & Trading Score: 42 | |
| Day Percent Change: 0.13% Day Change: 0.02 | |
| Week Change: 4.4% Year-to-date Change: -21.2% | |
| PATH Links: Profile News Message Board | |
| Charts:- Daily , Weekly | |
| Add PATH to Watchlist: View: Get Complete PATH Trend Analysis ➞ | |
 | NCNO nCino, Inc. |
| Sector: Technology | |
| SubSector: Software Application | |
| MarketCap: 74187 Millions | |
| Recent Price: 30.18 Smart Investing & Trading Score: 42 | |
| Day Percent Change: 0.07% Day Change: 0.02 | |
| Week Change: 1.22% Year-to-date Change: -10.3% | |
| NCNO Links: Profile News Message Board | |
| Charts:- Daily , Weekly | |
| Add NCNO to Watchlist: View: Get Complete NCNO Trend Analysis ➞ | |
 | KLTR Kaltura, Inc. |
| Sector: Technology | |
| SubSector: Software - Application | |
| MarketCap: 293 Millions | |
| Recent Price: 1.25 Smart Investing & Trading Score: 42 | |
| Day Percent Change: 0.00% Day Change: 0.00 | |
| Week Change: 4.17% Year-to-date Change: -36.2% | |
| KLTR Links: Profile News Message Board | |
| Charts:- Daily , Weekly | |
| Add KLTR to Watchlist: View: Get Complete KLTR Trend Analysis ➞ | |
 | PHR Phreesia, Inc. |
| Sector: Technology | |
| SubSector: Healthcare Information Services | |
| MarketCap: 810.255 Millions | |
| Recent Price: 21.94 Smart Investing & Trading Score: 42 | |
| Day Percent Change: -5.19% Day Change: -1.20 | |
| Week Change: 1.11% Year-to-date Change: -5.2% | |
| PHR Links: Profile News Message Board | |
| Charts:- Daily , Weekly | |
| Add PHR to Watchlist: View: Get Complete PHR Trend Analysis ➞ | |
 | TUYA Tuya Inc. |
| Sector: Technology | |
| SubSector: Software - Infrastructure | |
| MarketCap: 1050 Millions | |
| Recent Price: 1.65 Smart Investing & Trading Score: 42 | |
| Day Percent Change: -4.62% Day Change: -0.08 | |
| Week Change: 5.1% Year-to-date Change: -28.1% | |
| TUYA Links: Profile News Message Board | |
| Charts:- Daily , Weekly | |
| Add TUYA to Watchlist: View: Get Complete TUYA Trend Analysis ➞ | |
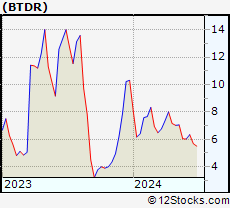 | BTDR Bitdeer Technologies Group |
| Sector: Technology | |
| SubSector: Software - Application | |
| MarketCap: 1100 Millions | |
| Recent Price: 6.46 Smart Investing & Trading Score: 42 | |
| Day Percent Change: -3.58% Day Change: -0.24 | |
| Week Change: 7.31% Year-to-date Change: -37.3% | |
| BTDR Links: Profile News Message Board | |
| Charts:- Daily , Weekly | |
| Add BTDR to Watchlist: View: Get Complete BTDR Trend Analysis ➞ | |
| For tabular summary view of above stock list: Summary View ➞ 0 - 25 , 25 - 50 , 50 - 75 , 75 - 100 , 100 - 125 , 125 - 150 , 150 - 175 , 175 - 200 , 200 - 225 , 225 - 250 , 250 - 275 , 275 - 300 , 300 - 325 , 325 - 350 , 350 - 375 , 375 - 400 , 400 - 425 , 425 - 450 , 450 - 475 , 475 - 500 , 500 - 525 , 525 - 550 , 550 - 575 , 575 - 600 , 600 - 625 , 625 - 650 | ||
| Click To Change The Sort Order: By Market Cap or Company Size Performance: Year-to-date, Week and Day | |
| Select Chart Type: | ||
|
Best Stocks Today 12Stocks.com |
© 2024 12Stocks.com Terms & Conditions Privacy Contact Us
All Information Provided Only For Education And Not To Be Used For Investing or Trading. See Terms & Conditions


One More Thing ... Get Best Stocks Delivered Daily!
Never Ever Miss A Move With Our Top Ten Stocks Lists
Find Best Stocks In Any Market - Bull or Bear Market
Take A Peek At Our Top Ten Stocks Lists: Daily, Weekly, Year-to-Date & Top Trends
Find Best Stocks In Any Market - Bull or Bear Market
Take A Peek At Our Top Ten Stocks Lists: Daily, Weekly, Year-to-Date & Top Trends
Technology Stocks With Best Up Trends [0-bearish to 100-bullish]: Amesite [100], Ribbon [100], Allegro MicroSystems[100], Texas [100], Microchip [100], EchoStar [100], Analog Devices[100], Vishay Inter[100], JD.com [100], Sea [100], Jamf Holding[100]
Best Technology Stocks Year-to-Date:
Pagaya [581.02%], MicroCloud Hologram[574.82%], MediaCo Holding[364.79%], Uxin [169.61%], CXApp [167.95%], Super Micro[165.5%], Smith Micro[162.71%], SoundHound AI[103.27%], MicroStrategy [100.38%], GigaCloud [96.01%], NextNav [95.73%] Best Technology Stocks This Week:
Matterport [166.09%], Amesite [69.72%], WiMi Hologram[64.85%], Ribbon [25.97%], HashiCorp [23.7%], SoundHound AI[22.54%], Intchains [20.36%], iQIYI [17.99%], Bilibili [16.87%], FTC Solar[16.56%], BigBear.ai [16.55%] Best Technology Stocks Daily:
Amesite [65.50%], WiMi Hologram[58.53%], Ribbon [26.46%], Intchains [22.28%], Uxin [13.86%], Bilibili [10.97%], Comtech Tele[10.76%], Mitcham Industries[9.88%], Navitas Semiconductor[8.83%], FTC Solar[8.51%], AMTD Digital[8.33%]