
 Login Sign Up


| |||||
 |  | ||||

| 12Stocks.com Market Intelligence |
Best Tech Stocks
| In a hurry? Tech Stocks Lists: Performance & Trends, Stock Charts, FANG Stocks
Sort Tech stocks: Daily, Weekly, Year-to-Date, Market Cap & Trends. Filter Tech stocks list by size:All Tech Large Mid-Range Small and MicroCap |
| 12Stocks.com Tech Stocks Performances & Trends Daily | |||||||||
|
|  The overall Smart Investing & Trading Score is 10 (0-bearish to 100-bullish) which puts Technology sector in short term bearish trend. The Smart Investing & Trading Score from previous trading session is 21 and hence a deterioration of trend.
| ||||||||
Here are the Smart Investing & Trading Scores of the most requested Technology stocks at 12Stocks.com (click stock name for detailed review):
|


| 12Stocks.com: Investing in Technology sector with Stocks | |
|
The following table helps investors and traders sort through current performance and trends (as measured by Smart Investing & Trading Score) of various
stocks in the Tech sector. Quick View: Move mouse or cursor over stock symbol (ticker) to view short-term technical chart and over stock name to view long term chart. Click on  to add stock symbol to your watchlist and to add stock symbol to your watchlist and  to view watchlist. Click on any ticker or stock name for detailed market intelligence report for that stock. to view watchlist. Click on any ticker or stock name for detailed market intelligence report for that stock. |
12Stocks.com Performance of Stocks in Tech Sector
| Ticker | Stock Name | Watchlist | Category | Recent Price | Smart Investing & Trading Score | Change % | YTD Change% |
| OMCL | Omnicell |   | Healthcare Information | 27.23 | 56 | 1.57 | -27.64% |
| APPS | Digital Turbine | | Software | 1.94 | 67 | 1.57 | -71.72% |
| SBAC | SBA | | Communication | 189.03 | 10 | 1.56 | -25.49% |
| ASUR | Asure Software | | Software | 7.47 | 74 | 1.56 | -21.53% |
| RGTI | Rigetti Computing | | Computer Hardware | 1.30 | 52 | 1.56 | 32.64% |
| CCI | Crown Castle | | Communication | 95.23 | 52 | 1.55 | -17.33% |
| RNG | RingCentral | | Software | 30.08 | 12 | 1.55 | -11.40% |
| ALKT | Alkami | | Software - | 24.44 | 39 | 1.54 | 1.12% |
| BOX | Box | | Software | 26.41 | 36 | 1.50 | 3.12% |
| S | SentinelOne | | Software - Infrastructure | 21.44 | 64 | 1.47 | -21.87% |
| LYFT | Lyft | | Software | 15.87 | 10 | 1.47 | 5.87% |
| PUBM | PubMatic | | Software | 22.77 | 31 | 1.47 | 39.69% |
| APPF | AppFolio | | Software | 230.08 | 22 | 1.46 | 32.81% |
| TLS | Telos | | IT | 3.49 | 47 | 1.45 | -4.38% |
| IBEX | IBEX | | Software | 13.29 | 38 | 1.45 | -29.98% |
| KVHI | KVH Industries | | Communication | 4.93 | 68 | 1.44 | -6.27% |
| AGMH | AGM | | Software | 1.05 | 10 | 1.44 | -41.71% |
| DV | DoubleVerify | | Software - | 29.72 | 28 | 1.43 | -19.20% |
| DNB | Dun & Bradstreet | | IT | 9.23 | 43 | 1.43 | -21.11% |
| ADBE | Adobe | | Software | 469.47 | 28 | 1.43 | -21.31% |
| RDVT | Red Violet | | Software | 17.02 | 17 | 1.43 | -14.77% |
| MSFT | Microsoft | | Software | 394.85 | 10 | 1.42 | 5.00% |
| LDOS | Leidos | | IT | 142.19 | 100 | 1.40 | 31.37% |
| CHTR | Charter | | CATV | 259.49 | 57 | 1.39 | -33.24% |
| DBX | Dropbox | | Software | 23.48 | 40 | 1.38 | -20.35% |
| For chart view version of above stock list: Chart View ➞ 0 - 25 , 25 - 50 , 50 - 75 , 75 - 100 , 100 - 125 , 125 - 150 , 150 - 175 , 175 - 200 , 200 - 225 , 225 - 250 , 250 - 275 , 275 - 300 , 300 - 325 , 325 - 350 , 350 - 375 , 375 - 400 , 400 - 425 , 425 - 450 , 450 - 475 , 475 - 500 , 500 - 525 , 525 - 550 , 550 - 575 , 575 - 600 , 600 - 625 , 625 - 650 | ||
 | Click To Change The Sort Order: By Market Cap or Company Size Performance: Year-to-date, Week and Day |  |
|
Get the most comprehensive stock market coverage daily at 12Stocks.com ➞ Best Stocks Today ➞ Best Stocks Weekly ➞ Best Stocks Year-to-Date ➞ Best Stocks Trends ➞  Best Stocks Today 12Stocks.com Best Nasdaq Stocks ➞ Best S&P 500 Stocks ➞ Best Tech Stocks ➞ Best Biotech Stocks ➞ |
| Detailed Overview of Tech Stocks |
| Tech Technical Overview, Leaders & Laggards, Top Tech ETF Funds & Detailed Tech Stocks List, Charts, Trends & More |
| Tech Sector: Technical Analysis, Trends & YTD Performance | |
| Technology sector is composed of stocks
from semiconductors, software, web, social media
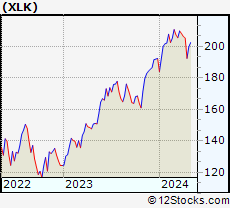
and services subsectors. Technology sector, as represented by XLK, an exchange-traded fund [ETF] that holds basket of tech stocks (e.g, Intel, Google) is up by 0.92% and is currently underperforming the overall market by -3.62% year-to-date. Below is a quick view of technical charts and trends: |
|
 XLK Weekly Chart |
|
| Long Term Trend: Not Good | |
| Medium Term Trend: Not Good | |
 XLK Daily Chart |
|
| Short Term Trend: Deteriorating | |
| Overall Trend Score: 10 | |
| YTD Performance: 0.92% | |
| **Trend Scores & Views Are Only For Educational Purposes And Not For Investing | |
| 12Stocks.com: Top Performing Technology Sector Stocks | ||||||||||||||||||||||||||||||||||||||||||||||||
 The top performing Technology sector stocks year to date are
Now, more recently, over last week, the top performing Technology sector stocks on the move are


|
||||||||||||||||||||||||||||||||||||||||||||||||
| 12Stocks.com: Investing in Tech Sector using Exchange Traded Funds | |
|
The following table shows list of key exchange traded funds (ETF) that
help investors track Tech Index. For detailed view, check out our ETF Funds section of our website. Quick View: Move mouse or cursor over ETF symbol (ticker) to view short-term technical chart and over ETF name to view long term chart. Click on ticker or stock name for detailed view. Click on to add stock symbol to your watchlist and to view watchlist. |
12Stocks.com List of ETFs that track Tech Index
| Ticker | ETF Name | Watchlist | Recent Price | Smart Investing & Trading Score | Change % | Week % | Year-to-date % |
| XLK | Technology | | 194.26 | 10 | -1.00 | -2.79 | 0.92% |
| QQQ | QQQ | | 421.30 | 17 | -0.77 | -2.25 | 2.88% |
| IYW | Technology | | 127.10 | 0 | -0.83 | -2.94 | 3.54% |
| VGT | Information Technology | | 488.98 | 7 | -1.16 | -2.97 | 1.03% |
| IXN | Global Tech | | 69.83 | 10 | -0.92 | -2.74 | 2.42% |
| IGV | Tech-Software | | 79.07 | 0 | 0.18 | -2.49 | -2.54% |
| XSD | Semiconductor | | 217.32 | 30 | -3.20 | -3.28 | -3.32% |
| TQQQ | QQQ | | 51.59 | 17 | -2.16 | -6.67 | 1.77% |
| SQQQ | Short QQQ | | 12.23 | 78 | 2.34 | 7 | -9.07% |
| SOXL | Semicondct Bull 3X | | 34.37 | 7 | -9.98 | -13.53 | 9.46% |
| SOXS | Semicondct Bear 3X | | 40.33 | 73 | 10.27 | 14.89 | 592.87% |
| SOXX | PHLX Semiconductor | | 206.75 | 7 | -3.38 | -4.68 | 7.66% |
| QTEC | First -100-Tech | | 177.40 | 0 | -1.48 | -3.58 | 1.1% |
| SMH | Semiconductor | | 207.75 | 20 | -2.96 | -4.54 | 18.8% |
| 12Stocks.com: Charts, Trends, Fundamental Data and Performances of Tech Stocks | |
|
We now take in-depth look at all Tech stocks including charts, multi-period performances and overall trends (as measured by Smart Investing & Trading Score). One can sort Tech stocks (click link to choose) by Daily, Weekly and by Year-to-Date performances. Also, one can sort by size of the company or by market capitalization. |
| Select Your Default Chart Type: | |||||
| |||||
| Click on stock symbol or name for detailed view. Click on to add stock symbol to your watchlist and to view watchlist. Quick View: Move mouse or cursor over "Daily" to quickly view daily technical stock chart and over "Weekly" to view weekly technical stock chart. | |||||


 | OMCL Omnicell, Inc. |
| Sector: Technology | |
| SubSector: Healthcare Information Services | |
| MarketCap: 2781.05 Millions | |
| Recent Price: 27.23 Smart Investing & Trading Score: 56 | |
| Day Percent Change: 1.57% Day Change: 0.42 | |
| Week Change: -2.26% Year-to-date Change: -27.6% | |
| OMCL Links: Profile News Message Board | |
| Charts:- Daily , Weekly | |
| Add OMCL to Watchlist: View: Get Complete OMCL Trend Analysis ➞ | |
 | APPS Digital Turbine, Inc. |
| Sector: Technology | |
| SubSector: Application Software | |
| MarketCap: 437.262 Millions | |
| Recent Price: 1.94 Smart Investing & Trading Score: 67 | |
| Day Percent Change: 1.57% Day Change: 0.03 | |
| Week Change: 6.59% Year-to-date Change: -71.7% | |
| APPS Links: Profile News Message Board | |
| Charts:- Daily , Weekly | |
| Add APPS to Watchlist: View: Get Complete APPS Trend Analysis ➞ | |
 | SBAC SBA Communications Corporation |
| Sector: Technology | |
| SubSector: Diversified Communication Services | |
| MarketCap: 26712.3 Millions | |
| Recent Price: 189.03 Smart Investing & Trading Score: 10 | |
| Day Percent Change: 1.56% Day Change: 2.91 | |
| Week Change: -3.67% Year-to-date Change: -25.5% | |
| SBAC Links: Profile News Message Board | |
| Charts:- Daily , Weekly | |
| Add SBAC to Watchlist: View: Get Complete SBAC Trend Analysis ➞ | |
 | ASUR Asure Software, Inc. |
| Sector: Technology | |
| SubSector: Business Software & Services | |
| MarketCap: 103.758 Millions | |
| Recent Price: 7.47 Smart Investing & Trading Score: 74 | |
| Day Percent Change: 1.56% Day Change: 0.11 | |
| Week Change: 2.75% Year-to-date Change: -21.5% | |
| ASUR Links: Profile News Message Board | |
| Charts:- Daily , Weekly | |
| Add ASUR to Watchlist: View: Get Complete ASUR Trend Analysis ➞ | |
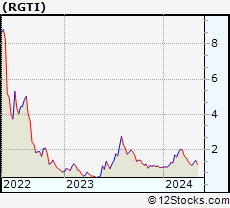 | RGTI Rigetti Computing, Inc. |
| Sector: Technology | |
| SubSector: Computer Hardware | |
| MarketCap: 163 Millions | |
| Recent Price: 1.30 Smart Investing & Trading Score: 52 | |
| Day Percent Change: 1.56% Day Change: 0.02 | |
| Week Change: 3.17% Year-to-date Change: 32.6% | |
| RGTI Links: Profile News Message Board | |
| Charts:- Daily , Weekly | |
| Add RGTI to Watchlist: View: Get Complete RGTI Trend Analysis ➞ | |
 | CCI Crown Castle International Corp. (REIT) |
| Sector: Technology | |
| SubSector: Diversified Communication Services | |
| MarketCap: 57615.4 Millions | |
| Recent Price: 95.23 Smart Investing & Trading Score: 52 | |
| Day Percent Change: 1.55% Day Change: 1.45 | |
| Week Change: 1.76% Year-to-date Change: -17.3% | |
| CCI Links: Profile News Message Board | |
| Charts:- Daily , Weekly | |
| Add CCI to Watchlist: View: Get Complete CCI Trend Analysis ➞ | |
 | RNG RingCentral, Inc. |
| Sector: Technology | |
| SubSector: Application Software | |
| MarketCap: 17755.3 Millions | |
| Recent Price: 30.08 Smart Investing & Trading Score: 12 | |
| Day Percent Change: 1.55% Day Change: 0.46 | |
| Week Change: -1.83% Year-to-date Change: -11.4% | |
| RNG Links: Profile News Message Board | |
| Charts:- Daily , Weekly | |
| Add RNG to Watchlist: View: Get Complete RNG Trend Analysis ➞ | |
 | ALKT Alkami Technology, Inc. |
| Sector: Technology | |
| SubSector: Software - Application | |
| MarketCap: 1530 Millions | |
| Recent Price: 24.44 Smart Investing & Trading Score: 39 | |
| Day Percent Change: 1.54% Day Change: 0.37 | |
| Week Change: -0.29% Year-to-date Change: 1.1% | |
| ALKT Links: Profile News Message Board | |
| Charts:- Daily , Weekly | |
| Add ALKT to Watchlist: View: Get Complete ALKT Trend Analysis ➞ | |
 | BOX Box, Inc. |
| Sector: Technology | |
| SubSector: Application Software | |
| MarketCap: 2154.42 Millions | |
| Recent Price: 26.41 Smart Investing & Trading Score: 36 | |
| Day Percent Change: 1.50% Day Change: 0.39 | |
| Week Change: -1.64% Year-to-date Change: 3.1% | |
| BOX Links: Profile News Message Board | |
| Charts:- Daily , Weekly | |
| Add BOX to Watchlist: View: Get Complete BOX Trend Analysis ➞ | |
 | S SentinelOne, Inc. |
| Sector: Technology | |
| SubSector: Software - Infrastructure | |
| MarketCap: 4420 Millions | |
| Recent Price: 21.44 Smart Investing & Trading Score: 64 | |
| Day Percent Change: 1.47% Day Change: 0.31 | |
| Week Change: -0.56% Year-to-date Change: -21.9% | |
| S Links: Profile News Message Board | |
| Charts:- Daily , Weekly | |
| Add S to Watchlist: View: Get Complete S Trend Analysis ➞ | |
 | LYFT Lyft, Inc. |
| Sector: Technology | |
| SubSector: Application Software | |
| MarketCap: 7923.22 Millions | |
| Recent Price: 15.87 Smart Investing & Trading Score: 10 | |
| Day Percent Change: 1.47% Day Change: 0.23 | |
| Week Change: -3.05% Year-to-date Change: 5.9% | |
| LYFT Links: Profile News Message Board | |
| Charts:- Daily , Weekly | |
| Add LYFT to Watchlist: View: Get Complete LYFT Trend Analysis ➞ | |
 | PUBM PubMatic, Inc. |
| Sector: Technology | |
| SubSector: Software Application | |
| MarketCap: 56787 Millions | |
| Recent Price: 22.77 Smart Investing & Trading Score: 31 | |
| Day Percent Change: 1.47% Day Change: 0.33 | |
| Week Change: -1.9% Year-to-date Change: 39.7% | |
| PUBM Links: Profile News Message Board | |
| Charts:- Daily , Weekly | |
| Add PUBM to Watchlist: View: Get Complete PUBM Trend Analysis ➞ | |
 | APPF AppFolio, Inc. |
| Sector: Technology | |
| SubSector: Application Software | |
| MarketCap: 3412.02 Millions | |
| Recent Price: 230.08 Smart Investing & Trading Score: 22 | |
| Day Percent Change: 1.46% Day Change: 3.30 | |
| Week Change: -5.22% Year-to-date Change: 32.8% | |
| APPF Links: Profile News Message Board | |
| Charts:- Daily , Weekly | |
| Add APPF to Watchlist: View: Get Complete APPF Trend Analysis ➞ | |
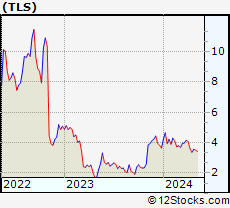 | TLS Telos Corporation |
| Sector: Technology | |
| SubSector: Information Technology Services | |
| MarketCap: 11787 Millions | |
| Recent Price: 3.49 Smart Investing & Trading Score: 47 | |
| Day Percent Change: 1.45% Day Change: 0.05 | |
| Week Change: -2.24% Year-to-date Change: -4.4% | |
| TLS Links: Profile News Message Board | |
| Charts:- Daily , Weekly | |
| Add TLS to Watchlist: View: Get Complete TLS Trend Analysis ➞ | |
 | IBEX IBEX Limited |
| Sector: Technology | |
| SubSector: Software Application | |
| MarketCap: 37787 Millions | |
| Recent Price: 13.29 Smart Investing & Trading Score: 38 | |
| Day Percent Change: 1.45% Day Change: 0.19 | |
| Week Change: 0.68% Year-to-date Change: -30.0% | |
| IBEX Links: Profile News Message Board | |
| Charts:- Daily , Weekly | |
| Add IBEX to Watchlist: View: Get Complete IBEX Trend Analysis ➞ | |
 | KVHI KVH Industries, Inc. |
| Sector: Technology | |
| SubSector: Communication Equipment | |
| MarketCap: 169.939 Millions | |
| Recent Price: 4.93 Smart Investing & Trading Score: 68 | |
| Day Percent Change: 1.44% Day Change: 0.07 | |
| Week Change: 3.14% Year-to-date Change: -6.3% | |
| KVHI Links: Profile News Message Board | |
| Charts:- Daily , Weekly | |
| Add KVHI to Watchlist: View: Get Complete KVHI Trend Analysis ➞ | |
 | AGMH AGM Group Holdings Inc. |
| Sector: Technology | |
| SubSector: Application Software | |
| MarketCap: 320.362 Millions | |
| Recent Price: 1.05 Smart Investing & Trading Score: 10 | |
| Day Percent Change: 1.44% Day Change: 0.01 | |
| Week Change: -0.47% Year-to-date Change: -41.7% | |
| AGMH Links: Profile News Message Board | |
| Charts:- Daily , Weekly | |
| Add AGMH to Watchlist: View: Get Complete AGMH Trend Analysis ➞ | |
 | DV DoubleVerify Holdings, Inc. |
| Sector: Technology | |
| SubSector: Software - Application | |
| MarketCap: 6500 Millions | |
| Recent Price: 29.72 Smart Investing & Trading Score: 28 | |
| Day Percent Change: 1.43% Day Change: 0.42 | |
| Week Change: -1.69% Year-to-date Change: -19.2% | |
| DV Links: Profile News Message Board | |
| Charts:- Daily , Weekly | |
| Add DV to Watchlist: View: Get Complete DV Trend Analysis ➞ | |
 | DNB Dun & Bradstreet Holdings, Inc. |
| Sector: Technology | |
| SubSector: Information Technology Services | |
| MarketCap: 10887 Millions | |
| Recent Price: 9.23 Smart Investing & Trading Score: 43 | |
| Day Percent Change: 1.43% Day Change: 0.13 | |
| Week Change: -1.28% Year-to-date Change: -21.1% | |
| DNB Links: Profile News Message Board | |
| Charts:- Daily , Weekly | |
| Add DNB to Watchlist: View: Get Complete DNB Trend Analysis ➞ | |
 | ADBE Adobe Inc. |
| Sector: Technology | |
| SubSector: Application Software | |
| MarketCap: 157868 Millions | |
| Recent Price: 469.47 Smart Investing & Trading Score: 28 | |
| Day Percent Change: 1.43% Day Change: 6.64 | |
| Week Change: -1.69% Year-to-date Change: -21.3% | |
| ADBE Links: Profile News Message Board | |
| Charts:- Daily , Weekly | |
| Add ADBE to Watchlist: View: Get Complete ADBE Trend Analysis ➞ | |
 | RDVT Red Violet, Inc. |
| Sector: Technology | |
| SubSector: Application Software | |
| MarketCap: 215.162 Millions | |
| Recent Price: 17.02 Smart Investing & Trading Score: 17 | |
| Day Percent Change: 1.43% Day Change: 0.24 | |
| Week Change: 0.18% Year-to-date Change: -14.8% | |
| RDVT Links: Profile News Message Board | |
| Charts:- Daily , Weekly | |
| Add RDVT to Watchlist: View: Get Complete RDVT Trend Analysis ➞ | |
 | MSFT Microsoft Corporation |
| Sector: Technology | |
| SubSector: Business Software & Services | |
| MarketCap: 1154150 Millions | |
| Recent Price: 394.85 Smart Investing & Trading Score: 10 | |
| Day Percent Change: 1.42% Day Change: 5.52 | |
| Week Change: -2.82% Year-to-date Change: 5.0% | |
| MSFT Links: Profile News Message Board | |
| Charts:- Daily , Weekly | |
| Add MSFT to Watchlist: View: Get Complete MSFT Trend Analysis ➞ | |
 | LDOS Leidos Holdings, Inc. |
| Sector: Technology | |
| SubSector: Information Technology Services | |
| MarketCap: 11707.5 Millions | |
| Recent Price: 142.19 Smart Investing & Trading Score: 100 | |
| Day Percent Change: 1.40% Day Change: 1.97 | |
| Week Change: 9.07% Year-to-date Change: 31.4% | |
| LDOS Links: Profile News Message Board | |
| Charts:- Daily , Weekly | |
| Add LDOS to Watchlist: View: Get Complete LDOS Trend Analysis ➞ | |
 | CHTR Charter Communications, Inc. |
| Sector: Technology | |
| SubSector: CATV Systems | |
| MarketCap: 82268.3 Millions | |
| Recent Price: 259.49 Smart Investing & Trading Score: 57 | |
| Day Percent Change: 1.39% Day Change: 3.55 | |
| Week Change: 1.92% Year-to-date Change: -33.2% | |
| CHTR Links: Profile News Message Board | |
| Charts:- Daily , Weekly | |
| Add CHTR to Watchlist: View: Get Complete CHTR Trend Analysis ➞ | |
 | DBX Dropbox, Inc. |
| Sector: Technology | |
| SubSector: Application Software | |
| MarketCap: 7588.32 Millions | |
| Recent Price: 23.48 Smart Investing & Trading Score: 40 | |
| Day Percent Change: 1.38% Day Change: 0.32 | |
| Week Change: -2.77% Year-to-date Change: -20.4% | |
| DBX Links: Profile News Message Board | |
| Charts:- Daily , Weekly | |
| Add DBX to Watchlist: View: Get Complete DBX Trend Analysis ➞ | |
| For tabular summary view of above stock list: Summary View ➞ 0 - 25 , 25 - 50 , 50 - 75 , 75 - 100 , 100 - 125 , 125 - 150 , 150 - 175 , 175 - 200 , 200 - 225 , 225 - 250 , 250 - 275 , 275 - 300 , 300 - 325 , 325 - 350 , 350 - 375 , 375 - 400 , 400 - 425 , 425 - 450 , 450 - 475 , 475 - 500 , 500 - 525 , 525 - 550 , 550 - 575 , 575 - 600 , 600 - 625 , 625 - 650 | ||
| Click To Change The Sort Order: By Market Cap or Company Size Performance: Year-to-date, Week and Day | |
| Select Chart Type: | ||
|
Best Stocks Today 12Stocks.com |
© 2024 12Stocks.com Terms & Conditions Privacy Contact Us
All Information Provided Only For Education And Not To Be Used For Investing or Trading. See Terms & Conditions


One More Thing ... Get Best Stocks Delivered Daily!
Never Ever Miss A Move With Our Top Ten Stocks Lists
Find Best Stocks In Any Market - Bull or Bear Market
Take A Peek At Our Top Ten Stocks Lists: Daily, Weekly, Year-to-Date & Top Trends
Find Best Stocks In Any Market - Bull or Bear Market
Take A Peek At Our Top Ten Stocks Lists: Daily, Weekly, Year-to-Date & Top Trends
Technology Stocks With Best Up Trends [0-bearish to 100-bullish]: A10 Networks[100], Garmin [100], Conduent [100], Snap [100], CTS [100], 21Vianet [100], Ouster [100], Silicom [100], Descartes Systems[100], Leidos [100], Premier [100]
Best Technology Stocks Year-to-Date:
MediaCo Holding[425.82%], Bakkt [182.96%], Uxin [178.17%], Smith Micro[174.82%], Super Micro[159.62%], CXApp [159.46%], SoundHound AI[105.14%], CuriosityStream [104.59%], NextNav [104.27%], MediaAlpha [89.39%], Cheetah Mobile[78.07%] Best Technology Stocks This Week:
Bakkt [1478.68%], SYLA [73.71%], MediaCo Holding[29.48%], Mitcham Industries[28.6%], Koninklijke Philips[27.01%], Harmonic [20.65%], Phoenix New[20.57%], Quantum [16.67%], Cogint [14.95%], Viomi [14.75%], Garmin [13.92%] Best Technology Stocks Daily:
SYLA [130.82%], MediaCo Holding[27.27%], A10 Networks[17.69%], Garmin [13.12%], AMTD Digital[10.64%], Cambium Networks[10.62%], Conduent [10.48%], Luna Innovations[8.50%], Arqit Quantum[8.50%], DigitalOcean [8.13%], Endava [7.76%]