
 Login Sign Up


| |||||
 |  | ||||

| 12Stocks.com Market Intelligence |
Best Tech Stocks
| In a hurry? Tech Stocks Lists: Performance & Trends, Stock Charts, FANG Stocks
Sort Tech stocks: Daily, Weekly, Year-to-Date, Market Cap & Trends. Filter Tech stocks list by size:All Tech Large Mid-Range Small and MicroCap |
| 12Stocks.com Tech Stocks Performances & Trends Daily | |||||||||
|
|  The overall Smart Investing & Trading Score is 26 (0-bearish to 100-bullish) which puts Technology sector in short term bearish to neutral trend. The Smart Investing & Trading Score from previous trading session is 33 and a deterioration of trend continues.
| ||||||||
Here are the Smart Investing & Trading Scores of the most requested Technology stocks at 12Stocks.com (click stock name for detailed review):
|


| 12Stocks.com: Investing in Technology sector with Stocks | |
|
The following table helps investors and traders sort through current performance and trends (as measured by Smart Investing & Trading Score) of various
stocks in the Tech sector. Quick View: Move mouse or cursor over stock symbol (ticker) to view short-term technical chart and over stock name to view long term chart. Click on  to add stock symbol to your watchlist and to add stock symbol to your watchlist and  to view watchlist. Click on any ticker or stock name for detailed market intelligence report for that stock. to view watchlist. Click on any ticker or stock name for detailed market intelligence report for that stock. |
12Stocks.com Performance of Stocks in Tech Sector
| Ticker | Stock Name | Watchlist | Category | Recent Price | Smart Investing & Trading Score | Change % | YTD Change% |
| GSAT | Globalstar |   | Wireless | 1.29 | 20 | -0.77 | -33.51% |
| AFRM | Affirm | | Software - Infrastructure | 30.82 | 0 | -0.77 | -37.05% |
| MORN | Morningstar | | IT | 297.63 | 26 | -0.78 | 3.98% |
| ASX | ASE | | Semiconductor | 10.74 | 36 | -0.78 | 14.19% |
| TIGR | UP Fintech | | Software | 3.16 | 0 | -0.78 | -28.51% |
| IDT | IDT | | Communication | 36.43 | 41 | -0.79 | 6.86% |
| WK | Workiva | | Software | 77.57 | 10 | -0.79 | -23.60% |
| HPQ | HP | | Computer | 27.73 | 0 | -0.80 | -7.83% |
| TRMB | Trimble | | Instruments | 58.93 | 36 | -0.81 | 10.77% |
| RCM | R1 RCM | | Healthcare Information | 12.23 | 36 | -0.81 | 15.70% |
| VNT | Vontier | | Instruments | 40.74 | 36 | -0.83 | 17.92% |
| IIIV | i3 Verticals | | Software | 22.62 | 36 | -0.83 | 6.85% |
| NOVT | Novanta | | Instruments | 159.82 | 26 | -0.84 | -5.10% |
| ESE | ESCO | | Instruments | 99.36 | 0 | -0.86 | -15.10% |
| DGII | Digi | | Communication | 30.14 | 36 | -0.86 | 15.92% |
| QCOM | QUALCOMM | | Communication | 168.35 | 44 | -0.87 | 16.40% |
| AGYS | Agilysys | | Software | 82.08 | 35 | -0.87 | -3.23% |
| HIMX | Himax | | Semiconductor | 5.11 | 10 | -0.87 | -15.90% |
| RDFN | Redfin | | Internet | 5.69 | 0 | -0.87 | -44.86% |
| WDAY | Workday | | Software | 257.35 | 0 | -0.88 | -6.78% |
| MAX | MediaAlpha | | Internet Content & Information | 19.06 | 41 | -0.88 | 71.40% |
| JD | JD.com | | Internet | 25.20 | 36 | -0.89 | -12.79% |
| SY | So-Young | | Healthcare Information | 1.10 | 90 | -0.90 | -14.73% |
| PAR | PAR | | Software | 41.63 | 0 | -0.90 | -4.39% |
| GRND | Grindr | | Software - | 9.94 | 46 | -0.90 | 10.94% |
| For chart view version of above stock list: Chart View ➞ 0 - 25 , 25 - 50 , 50 - 75 , 75 - 100 , 100 - 125 , 125 - 150 , 150 - 175 , 175 - 200 , 200 - 225 , 225 - 250 , 250 - 275 , 275 - 300 , 300 - 325 , 325 - 350 , 350 - 375 , 375 - 400 , 400 - 425 , 425 - 450 , 450 - 475 , 475 - 500 , 500 - 525 , 525 - 550 , 550 - 575 , 575 - 600 , 600 - 625 , 625 - 650 | ||
 | Click To Change The Sort Order: By Market Cap or Company Size Performance: Year-to-date, Week and Day |  |
|
Get the most comprehensive stock market coverage daily at 12Stocks.com ➞ Best Stocks Today ➞ Best Stocks Weekly ➞ Best Stocks Year-to-Date ➞ Best Stocks Trends ➞  Best Stocks Today 12Stocks.com Best Nasdaq Stocks ➞ Best S&P 500 Stocks ➞ Best Tech Stocks ➞ Best Biotech Stocks ➞ |
| Detailed Overview of Tech Stocks |
| Tech Technical Overview, Leaders & Laggards, Top Tech ETF Funds & Detailed Tech Stocks List, Charts, Trends & More |
| Tech Sector: Technical Analysis, Trends & YTD Performance | |
| Technology sector is composed of stocks
from semiconductors, software, web, social media
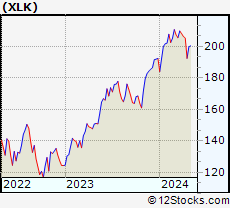
and services subsectors. Technology sector, as represented by XLK, an exchange-traded fund [ETF] that holds basket of tech stocks (e.g, Intel, Google) is up by 4.9% and is currently underperforming the overall market by -0.23% year-to-date. Below is a quick view of technical charts and trends: |
|
 XLK Weekly Chart |
|
| Long Term Trend: Good | |
| Medium Term Trend: Not Good | |
 XLK Daily Chart |
|
| Short Term Trend: Not Good | |
| Overall Trend Score: 26 | |
| YTD Performance: 4.9% | |
| **Trend Scores & Views Are Only For Educational Purposes And Not For Investing | |
| 12Stocks.com: Top Performing Technology Sector Stocks | ||||||||||||||||||||||||||||||||||||||||||||||||
 The top performing Technology sector stocks year to date are
Now, more recently, over last week, the top performing Technology sector stocks on the move are


|
||||||||||||||||||||||||||||||||||||||||||||||||
| 12Stocks.com: Investing in Tech Sector using Exchange Traded Funds | |
|
The following table shows list of key exchange traded funds (ETF) that
help investors track Tech Index. For detailed view, check out our ETF Funds section of our website. Quick View: Move mouse or cursor over ETF symbol (ticker) to view short-term technical chart and over ETF name to view long term chart. Click on ticker or stock name for detailed view. Click on to add stock symbol to your watchlist and to view watchlist. |
12Stocks.com List of ETFs that track Tech Index
| Ticker | ETF Name | Watchlist | Recent Price | Smart Investing & Trading Score | Change % | Week % | Year-to-date % |
| XLK | Technology | | 201.91 | 26 | 0.18 | -1.71 | 4.9% |
| QQQ | QQQ | | 431.51 | 33 | 0.13 | -1.54 | 5.37% |
| IYW | Technology | | 131.49 | 26 | 0.27 | -1.84 | 7.12% |
| VGT | Information Technology | | 505.14 | 26 | 0.05 | -1.85 | 4.37% |
| IXN | Global Tech | | 72.44 | 26 | -1.84 | -1.84 | 6.26% |
| IGV | Tech-Software | | 80.69 | 0 | 0.27 | -2.5 | -0.53% |
| XSD | Semiconductor | | 218.43 | 26 | -1.58 | -2.12 | -2.83% |
| TQQQ | QQQ | | 55.96 | 26 | 0.34 | -4.7 | 10.37% |
| SQQQ | Short QQQ | | 11.41 | 69 | -0.26 | 4.78 | -15.17% |
| SOXL | Semicondct Bull 3X | | 40.42 | 31 | 1.61 | -2.63 | 28.73% |
| SOXS | Semicondct Bear 3X | | 36.19 | 90 | -1.17 | 928.13 | 521.82% |
| SOXX | PHLX Semiconductor | | 216.36 | 38 | 0.46 | -0.78 | 12.67% |
| QTEC | First -100-Tech | | 182.93 | 33 | 0.15 | -1.66 | 4.25% |
| SMH | Semiconductor | | 219.05 | 41 | 0.78 | -0.74 | 25.26% |
| 12Stocks.com: Charts, Trends, Fundamental Data and Performances of Tech Stocks | |
|
We now take in-depth look at all Tech stocks including charts, multi-period performances and overall trends (as measured by Smart Investing & Trading Score). One can sort Tech stocks (click link to choose) by Daily, Weekly and by Year-to-Date performances. Also, one can sort by size of the company or by market capitalization. |
| Select Your Default Chart Type: | |||||
| |||||
| Click on stock symbol or name for detailed view. Click on to add stock symbol to your watchlist and to view watchlist. Quick View: Move mouse or cursor over "Daily" to quickly view daily technical stock chart and over "Weekly" to view weekly technical stock chart. | |||||


 | GSAT Globalstar, Inc. |
| Sector: Technology | |
| SubSector: Wireless Communications | |
| MarketCap: 485.127 Millions | |
| Recent Price: 1.29 Smart Investing & Trading Score: 20 | |
| Day Percent Change: -0.77% Day Change: -0.01 | |
| Week Change: -3.01% Year-to-date Change: -33.5% | |
| GSAT Links: Profile News Message Board | |
| Charts:- Daily , Weekly | |
| Add GSAT to Watchlist: View: Get Complete GSAT Trend Analysis ➞ | |
 | AFRM Affirm Holdings, Inc. |
| Sector: Technology | |
| SubSector: Software - Infrastructure | |
| MarketCap: 4560 Millions | |
| Recent Price: 30.82 Smart Investing & Trading Score: 0 | |
| Day Percent Change: -0.77% Day Change: -0.24 | |
| Week Change: -5.52% Year-to-date Change: -37.1% | |
| AFRM Links: Profile News Message Board | |
| Charts:- Daily , Weekly | |
| Add AFRM to Watchlist: View: Get Complete AFRM Trend Analysis ➞ | |
 | MORN Morningstar, Inc. |
| Sector: Technology | |
| SubSector: Information & Delivery Services | |
| MarketCap: 4997.87 Millions | |
| Recent Price: 297.63 Smart Investing & Trading Score: 26 | |
| Day Percent Change: -0.78% Day Change: -2.35 | |
| Week Change: -2.69% Year-to-date Change: 4.0% | |
| MORN Links: Profile News Message Board | |
| Charts:- Daily , Weekly | |
| Add MORN to Watchlist: View: Get Complete MORN Trend Analysis ➞ | |
 | ASX ASE Technology Holding Co., Ltd. |
| Sector: Technology | |
| SubSector: Semiconductor Equipment & Materials | |
| MarketCap: 8513.18 Millions | |
| Recent Price: 10.74 Smart Investing & Trading Score: 36 | |
| Day Percent Change: -0.78% Day Change: -0.09 | |
| Week Change: -0.97% Year-to-date Change: 14.2% | |
| ASX Links: Profile News Message Board | |
| Charts:- Daily , Weekly | |
| Add ASX to Watchlist: View: Get Complete ASX Trend Analysis ➞ | |
 | TIGR UP Fintech Holding Limited |
| Sector: Technology | |
| SubSector: Application Software | |
| MarketCap: 385.062 Millions | |
| Recent Price: 3.16 Smart Investing & Trading Score: 0 | |
| Day Percent Change: -0.78% Day Change: -0.02 | |
| Week Change: -3.95% Year-to-date Change: -28.5% | |
| TIGR Links: Profile News Message Board | |
| Charts:- Daily , Weekly | |
| Add TIGR to Watchlist: View: Get Complete TIGR Trend Analysis ➞ | |
 | IDT IDT Corporation |
| Sector: Technology | |
| SubSector: Diversified Communication Services | |
| MarketCap: 130.064 Millions | |
| Recent Price: 36.43 Smart Investing & Trading Score: 41 | |
| Day Percent Change: -0.79% Day Change: -0.29 | |
| Week Change: -1.38% Year-to-date Change: 6.9% | |
| IDT Links: Profile News Message Board | |
| Charts:- Daily , Weekly | |
| Add IDT to Watchlist: View: Get Complete IDT Trend Analysis ➞ | |
 | WK Workiva Inc. |
| Sector: Technology | |
| SubSector: Application Software | |
| MarketCap: 1537.42 Millions | |
| Recent Price: 77.57 Smart Investing & Trading Score: 10 | |
| Day Percent Change: -0.79% Day Change: -0.62 | |
| Week Change: -1.15% Year-to-date Change: -23.6% | |
| WK Links: Profile News Message Board | |
| Charts:- Daily , Weekly | |
| Add WK to Watchlist: View: Get Complete WK Trend Analysis ➞ | |
 | HPQ HP Inc. |
| Sector: Technology | |
| SubSector: Diversified Computer Systems | |
| MarketCap: 22107.8 Millions | |
| Recent Price: 27.73 Smart Investing & Trading Score: 0 | |
| Day Percent Change: -0.80% Day Change: -0.23 | |
| Week Change: -2.79% Year-to-date Change: -7.8% | |
| HPQ Links: Profile News Message Board | |
| Charts:- Daily , Weekly | |
| Add HPQ to Watchlist: View: Get Complete HPQ Trend Analysis ➞ | |
 | TRMB Trimble Inc. |
| Sector: Technology | |
| SubSector: Scientific & Technical Instruments | |
| MarketCap: 7990.33 Millions | |
| Recent Price: 58.93 Smart Investing & Trading Score: 36 | |
| Day Percent Change: -0.81% Day Change: -0.48 | |
| Week Change: -2.66% Year-to-date Change: 10.8% | |
| TRMB Links: Profile News Message Board | |
| Charts:- Daily , Weekly | |
| Add TRMB to Watchlist: View: Get Complete TRMB Trend Analysis ➞ | |
 | RCM R1 RCM Inc. |
| Sector: Technology | |
| SubSector: Healthcare Information Services | |
| MarketCap: 1082.15 Millions | |
| Recent Price: 12.23 Smart Investing & Trading Score: 36 | |
| Day Percent Change: -0.81% Day Change: -0.10 | |
| Week Change: -1.92% Year-to-date Change: 15.7% | |
| RCM Links: Profile News Message Board | |
| Charts:- Daily , Weekly | |
| Add RCM to Watchlist: View: Get Complete RCM Trend Analysis ➞ | |
 | VNT Vontier Corporation |
| Sector: Technology | |
| SubSector: Scientific & Technical Instruments | |
| MarketCap: 53787 Millions | |
| Recent Price: 40.74 Smart Investing & Trading Score: 36 | |
| Day Percent Change: -0.83% Day Change: -0.34 | |
| Week Change: -2% Year-to-date Change: 17.9% | |
| VNT Links: Profile News Message Board | |
| Charts:- Daily , Weekly | |
| Add VNT to Watchlist: View: Get Complete VNT Trend Analysis ➞ | |
 | IIIV i3 Verticals, Inc. |
| Sector: Technology | |
| SubSector: Business Software & Services | |
| MarketCap: 448.458 Millions | |
| Recent Price: 22.62 Smart Investing & Trading Score: 36 | |
| Day Percent Change: -0.83% Day Change: -0.19 | |
| Week Change: -1.57% Year-to-date Change: 6.9% | |
| IIIV Links: Profile News Message Board | |
| Charts:- Daily , Weekly | |
| Add IIIV to Watchlist: View: Get Complete IIIV Trend Analysis ➞ | |
 | NOVT Novanta Inc. |
| Sector: Technology | |
| SubSector: Scientific & Technical Instruments | |
| MarketCap: 2680.83 Millions | |
| Recent Price: 159.82 Smart Investing & Trading Score: 26 | |
| Day Percent Change: -0.84% Day Change: -1.36 | |
| Week Change: -1.95% Year-to-date Change: -5.1% | |
| NOVT Links: Profile News Message Board | |
| Charts:- Daily , Weekly | |
| Add NOVT to Watchlist: View: Get Complete NOVT Trend Analysis ➞ | |
 | ESE ESCO Technologies Inc. |
| Sector: Technology | |
| SubSector: Scientific & Technical Instruments | |
| MarketCap: 1968.03 Millions | |
| Recent Price: 99.36 Smart Investing & Trading Score: 0 | |
| Day Percent Change: -0.86% Day Change: -0.86 | |
| Week Change: -2.11% Year-to-date Change: -15.1% | |
| ESE Links: Profile News Message Board | |
| Charts:- Daily , Weekly | |
| Add ESE to Watchlist: View: Get Complete ESE Trend Analysis ➞ | |
 | DGII Digi International Inc. |
| Sector: Technology | |
| SubSector: Communication Equipment | |
| MarketCap: 257.339 Millions | |
| Recent Price: 30.14 Smart Investing & Trading Score: 36 | |
| Day Percent Change: -0.86% Day Change: -0.26 | |
| Week Change: -2.49% Year-to-date Change: 15.9% | |
| DGII Links: Profile News Message Board | |
| Charts:- Daily , Weekly | |
| Add DGII to Watchlist: View: Get Complete DGII Trend Analysis ➞ | |
 | QCOM QUALCOMM Incorporated |
| Sector: Technology | |
| SubSector: Communication Equipment | |
| MarketCap: 77517.7 Millions | |
| Recent Price: 168.35 Smart Investing & Trading Score: 44 | |
| Day Percent Change: -0.87% Day Change: -1.49 | |
| Week Change: -1.71% Year-to-date Change: 16.4% | |
| QCOM Links: Profile News Message Board | |
| Charts:- Daily , Weekly | |
| Add QCOM to Watchlist: View: Get Complete QCOM Trend Analysis ➞ | |
 | AGYS Agilysys, Inc. |
| Sector: Technology | |
| SubSector: Application Software | |
| MarketCap: 391.862 Millions | |
| Recent Price: 82.08 Smart Investing & Trading Score: 35 | |
| Day Percent Change: -0.87% Day Change: -0.72 | |
| Week Change: -0.38% Year-to-date Change: -3.2% | |
| AGYS Links: Profile News Message Board | |
| Charts:- Daily , Weekly | |
| Add AGYS to Watchlist: View: Get Complete AGYS Trend Analysis ➞ | |
 | HIMX Himax Technologies, Inc. |
| Sector: Technology | |
| SubSector: Semiconductor - Specialized | |
| MarketCap: 496.16 Millions | |
| Recent Price: 5.11 Smart Investing & Trading Score: 10 | |
| Day Percent Change: -0.87% Day Change: -0.04 | |
| Week Change: -2.58% Year-to-date Change: -15.9% | |
| HIMX Links: Profile News Message Board | |
| Charts:- Daily , Weekly | |
| Add HIMX to Watchlist: View: Get Complete HIMX Trend Analysis ➞ | |
 | RDFN Redfin Corporation |
| Sector: Technology | |
| SubSector: Internet Information Providers | |
| MarketCap: 1356.2 Millions | |
| Recent Price: 5.69 Smart Investing & Trading Score: 0 | |
| Day Percent Change: -0.87% Day Change: -0.05 | |
| Week Change: -5.01% Year-to-date Change: -44.9% | |
| RDFN Links: Profile News Message Board | |
| Charts:- Daily , Weekly | |
| Add RDFN to Watchlist: View: Get Complete RDFN Trend Analysis ➞ | |
 | WDAY Workday, Inc. |
| Sector: Technology | |
| SubSector: Application Software | |
| MarketCap: 31372.1 Millions | |
| Recent Price: 257.35 Smart Investing & Trading Score: 0 | |
| Day Percent Change: -0.88% Day Change: -2.28 | |
| Week Change: -2.4% Year-to-date Change: -6.8% | |
| WDAY Links: Profile News Message Board | |
| Charts:- Daily , Weekly | |
| Add WDAY to Watchlist: View: Get Complete WDAY Trend Analysis ➞ | |
 | MAX MediaAlpha, Inc. |
| Sector: Technology | |
| SubSector: Internet Content & Information | |
| MarketCap: 22537 Millions | |
| Recent Price: 19.06 Smart Investing & Trading Score: 41 | |
| Day Percent Change: -0.88% Day Change: -0.17 | |
| Week Change: -4.99% Year-to-date Change: 71.4% | |
| MAX Links: Profile News Message Board | |
| Charts:- Daily , Weekly | |
| Add MAX to Watchlist: View: Get Complete MAX Trend Analysis ➞ | |
 | JD JD.com, Inc. |
| Sector: Technology | |
| SubSector: Internet Information Providers | |
| MarketCap: 59907.3 Millions | |
| Recent Price: 25.20 Smart Investing & Trading Score: 36 | |
| Day Percent Change: -0.89% Day Change: -0.23 | |
| Week Change: -0.77% Year-to-date Change: -12.8% | |
| JD Links: Profile News Message Board | |
| Charts:- Daily , Weekly | |
| Add JD to Watchlist: View: Get Complete JD Trend Analysis ➞ | |
 | SY So-Young International Inc. |
| Sector: Technology | |
| SubSector: Healthcare Information Services | |
| MarketCap: 1000.55 Millions | |
| Recent Price: 1.10 Smart Investing & Trading Score: 90 | |
| Day Percent Change: -0.90% Day Change: -0.01 | |
| Week Change: -5.98% Year-to-date Change: -14.7% | |
| SY Links: Profile News Message Board | |
| Charts:- Daily , Weekly | |
| Add SY to Watchlist: View: Get Complete SY Trend Analysis ➞ | |
 | PAR PAR Technology Corporation |
| Sector: Technology | |
| SubSector: Application Software | |
| MarketCap: 255.862 Millions | |
| Recent Price: 41.63 Smart Investing & Trading Score: 0 | |
| Day Percent Change: -0.90% Day Change: -0.38 | |
| Week Change: -4.01% Year-to-date Change: -4.4% | |
| PAR Links: Profile News Message Board | |
| Charts:- Daily , Weekly | |
| Add PAR to Watchlist: View: Get Complete PAR Trend Analysis ➞ | |
 | GRND Grindr Inc. |
| Sector: Technology | |
| SubSector: Software - Application | |
| MarketCap: 929 Millions | |
| Recent Price: 9.94 Smart Investing & Trading Score: 46 | |
| Day Percent Change: -0.90% Day Change: -0.09 | |
| Week Change: -2.93% Year-to-date Change: 10.9% | |
| GRND Links: Profile News Message Board | |
| Charts:- Daily , Weekly | |
| Add GRND to Watchlist: View: Get Complete GRND Trend Analysis ➞ | |
| For tabular summary view of above stock list: Summary View ➞ 0 - 25 , 25 - 50 , 50 - 75 , 75 - 100 , 100 - 125 , 125 - 150 , 150 - 175 , 175 - 200 , 200 - 225 , 225 - 250 , 250 - 275 , 275 - 300 , 300 - 325 , 325 - 350 , 350 - 375 , 375 - 400 , 400 - 425 , 425 - 450 , 450 - 475 , 475 - 500 , 500 - 525 , 525 - 550 , 550 - 575 , 575 - 600 , 600 - 625 , 625 - 650 | ||
| Click To Change The Sort Order: By Market Cap or Company Size Performance: Year-to-date, Week and Day | |
| Select Chart Type: | ||
|
Best Stocks Today 12Stocks.com |
© 2024 12Stocks.com Terms & Conditions Privacy Contact Us
All Information Provided Only For Education And Not To Be Used For Investing or Trading. See Terms & Conditions


One More Thing ... Get Best Stocks Delivered Daily!
Never Ever Miss A Move With Our Top Ten Stocks Lists
Find Best Stocks In Any Market - Bull or Bear Market
Take A Peek At Our Top Ten Stocks Lists: Daily, Weekly, Year-to-Date & Top Trends
Find Best Stocks In Any Market - Bull or Bear Market
Take A Peek At Our Top Ten Stocks Lists: Daily, Weekly, Year-to-Date & Top Trends
Technology Stocks With Best Up Trends [0-bearish to 100-bullish]: Universal Electronics[100], Encore Wire[100], So-Young [90], Sea [83], Cheetah Mobile[83], Model N[83], NextNav [81], Descartes Systems[78], Hawaiian Telcom[78], Array [76], Camtek [75]
Best Technology Stocks Year-to-Date:
MicroCloud Hologram[556.12%], MediaCo Holding[479.81%], Super Micro[230.09%], CXApp [196.53%], Uxin [136.8%], Smith Micro[127.6%], CuriosityStream [112%], MicroStrategy [99.54%], D-Wave Quantum[94.32%], GigaCloud [92.19%], SoundHound AI[90.65%] Best Technology Stocks This Week:
Snap One[29.3%], Mynaric AG[14.1%], Encore Wire[11.1%], Applied Optoelectronics[8.37%], NextNav [7.22%], Arqit Quantum[6.7%], Sea [6.18%], Universal Electronics[6.17%], Momo [5%], Camtek [4.88%], on [4.63%] Best Technology Stocks Daily:
NextNav [12.62%], Rigetti Computing[9.72%], Applied Optoelectronics[9.05%], on [8.50%], GigaCloud [8.38%], D-Wave Quantum[7.91%], Sea [7.31%], WiMi Hologram[6.62%], Super Micro[6.29%], Mynaric AG[5.53%], Luna Innovations[5.37%]