
 Login Sign Up


| |||||
 |  | ||||

| 12Stocks.com Market Intelligence |
Best Tech Stocks
| In a hurry? Tech Stocks Lists: Performance & Trends, Stock Charts, FANG Stocks
Sort Tech stocks: Daily, Weekly, Year-to-Date, Market Cap & Trends. Filter Tech stocks list by size:All Tech Large Mid-Range Small and MicroCap |
| 12Stocks.com Tech Stocks Performances & Trends Daily | |||||||||
|
|  The overall Smart Investing & Trading Score is 32 (0-bearish to 100-bullish) which puts Technology sector in short term bearish to neutral trend. The Smart Investing & Trading Score from previous trading session is 38 and hence a deterioration of trend.
| ||||||||
Here are the Smart Investing & Trading Scores of the most requested Technology stocks at 12Stocks.com (click stock name for detailed review):
|


| 12Stocks.com: Investing in Technology sector with Stocks | |
|
The following table helps investors and traders sort through current performance and trends (as measured by Smart Investing & Trading Score) of various
stocks in the Tech sector. Quick View: Move mouse or cursor over stock symbol (ticker) to view short-term technical chart and over stock name to view long term chart. Click on  to add stock symbol to your watchlist and to add stock symbol to your watchlist and  to view watchlist. Click on any ticker or stock name for detailed market intelligence report for that stock. to view watchlist. Click on any ticker or stock name for detailed market intelligence report for that stock. |
12Stocks.com Performance of Stocks in Tech Sector
| Ticker | Stock Name | Watchlist | Category | Recent Price | Smart Investing & Trading Score | Change % | YTD Change% |
| YOU | Clear Secure |   | Software - | 17.81 | 25 | -0.25 | -14.07% |
| AEIS | Advanced Energy | | Electronics | 92.84 | 42 | -0.28 | -14.76% |
| DAO | Youdao | | Internet | 3.59 | 41 | -0.28 | -8.88% |
| LRCX | Lam Research | | Semiconductor | 884.89 | 58 | -0.29 | 12.98% |
| VEEV | Veeva Systems | | Healthcare Information | 200.52 | 25 | -0.29 | 4.16% |
| WK | Workiva | | Software | 80.06 | 57 | -0.29 | -21.15% |
| NTNX | Nutanix | | Software | 60.89 | 58 | -0.29 | 27.68% |
| STER | Sterling Check | | Software - Infrastructure | 15.27 | 56 | -0.29 | 9.62% |
| GTLB | GitLab | | Software - | 55.92 | 35 | -0.29 | -11.76% |
| TRMB | Trimble | | Instruments | 59.51 | 68 | -0.30 | 11.86% |
| PDFS | | Software | 30.08 | 32 | -0.30 | -6.41% | |
| ESE | ESCO | | Instruments | 104.28 | 90 | -0.32 | -10.89% |
| KT | KT | | Telecom | 12.65 | 49 | -0.32 | -5.88% |
| XNET | Xunlei | | Software | 1.55 | 90 | -0.32 | -4.01% |
| TSM | Taiwan Semiconductor | | Semiconductor | 132.97 | 68 | -0.34 | 27.86% |
| AMD | Advanced Micro | | Semiconductor | 151.74 | 32 | -0.35 | 2.94% |
| SOHU | Sohu.com | | Internet | 11.23 | 68 | -0.35 | 13.09% |
| VOD | Vodafone | | Wireless | 8.66 | 65 | -0.35 | -0.46% |
| CVLT | Commvault Systems | | Software | 96.83 | 70 | -0.35 | 21.26% |
| DELL | Dell | | Personal Computers | 120.20 | 53 | -0.36 | 57.12% |
| NXT | Nextracker | | Solar | 44.25 | 18 | -0.36 | -5.31% |
| CTSH | Cognizant | | IT | 67.52 | 18 | -0.37 | -10.61% |
| GIB | CGI | | IT | 104.90 | 25 | -0.37 | -2.15% |
| ALTR | Altair Engineering | | Semiconductor | 83.45 | 42 | -0.39 | -0.83% |
| ACIW | ACI Worldwide | | Software | 33.33 | 100 | -0.39 | 8.92% |
| For chart view version of above stock list: Chart View ➞ 0 - 25 , 25 - 50 , 50 - 75 , 75 - 100 , 100 - 125 , 125 - 150 , 150 - 175 , 175 - 200 , 200 - 225 , 225 - 250 , 250 - 275 , 275 - 300 , 300 - 325 , 325 - 350 , 350 - 375 , 375 - 400 , 400 - 425 , 425 - 450 , 450 - 475 , 475 - 500 , 500 - 525 , 525 - 550 , 550 - 575 , 575 - 600 , 600 - 625 , 625 - 650 | ||
 | Click To Change The Sort Order: By Market Cap or Company Size Performance: Year-to-date, Week and Day |  |
|
Get the most comprehensive stock market coverage daily at 12Stocks.com ➞ Best Stocks Today ➞ Best Stocks Weekly ➞ Best Stocks Year-to-Date ➞ Best Stocks Trends ➞  Best Stocks Today 12Stocks.com Best Nasdaq Stocks ➞ Best S&P 500 Stocks ➞ Best Tech Stocks ➞ Best Biotech Stocks ➞ |
| Detailed Overview of Tech Stocks |
| Tech Technical Overview, Leaders & Laggards, Top Tech ETF Funds & Detailed Tech Stocks List, Charts, Trends & More |
| Tech Sector: Technical Analysis, Trends & YTD Performance | |
| Technology sector is composed of stocks
from semiconductors, software, web, social media
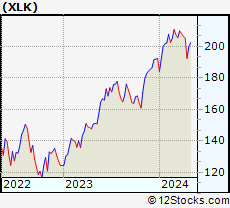
and services subsectors. Technology sector, as represented by XLK, an exchange-traded fund [ETF] that holds basket of tech stocks (e.g, Intel, Google) is up by 2.88% and is currently underperforming the overall market by -2.78% year-to-date. Below is a quick view of technical charts and trends: |
|
 XLK Weekly Chart |
|
| Long Term Trend: Good | |
| Medium Term Trend: Not Good | |
 XLK Daily Chart |
|
| Short Term Trend: Very Good | |
| Overall Trend Score: 32 | |
| YTD Performance: 2.88% | |
| **Trend Scores & Views Are Only For Educational Purposes And Not For Investing | |
| 12Stocks.com: Top Performing Technology Sector Stocks | ||||||||||||||||||||||||||||||||||||||||||||||||
 The top performing Technology sector stocks year to date are
Now, more recently, over last week, the top performing Technology sector stocks on the move are


|
||||||||||||||||||||||||||||||||||||||||||||||||
| 12Stocks.com: Investing in Tech Sector using Exchange Traded Funds | |
|
The following table shows list of key exchange traded funds (ETF) that
help investors track Tech Index. For detailed view, check out our ETF Funds section of our website. Quick View: Move mouse or cursor over ETF symbol (ticker) to view short-term technical chart and over ETF name to view long term chart. Click on ticker or stock name for detailed view. Click on to add stock symbol to your watchlist and to view watchlist. |
12Stocks.com List of ETFs that track Tech Index
| Ticker | ETF Name | Watchlist | Recent Price | Smart Investing & Trading Score | Change % | Week % | Year-to-date % |
| XLK | Technology | | 198.03 | 32 | 0.46 | 2.86 | 2.88% |
| QQQ | QQQ | | 426.51 | 58 | 0.34 | 2.86 | 4.15% |
| IYW | Technology | | 128.84 | 43 | 0.25 | 3.28 | 4.96% |
| VGT | Information Technology | | 495.24 | 30 | 0.16 | 3.2 | 2.32% |
| IXN | Global Tech | | 70.84 | 43 | 0.47 | 3.08 | 3.9% |
| IGV | Tech-Software | | 80.94 | 17 | 0.10 | 3.07 | -0.23% |
| XSD | Semiconductor | | 215.54 | 30 | 2.30 | 5.89 | -4.11% |
| TQQQ | QQQ | | 53.71 | 58 | 0.98 | 8.55 | 5.94% |
| SQQQ | Short QQQ | | 11.81 | 37 | -0.84 | -8.02 | -12.19% |
| SOXL | Semicondct Bull 3X | | 35.49 | 58 | 4.05 | 15.26 | 13.03% |
| SOXS | Semicondct Bear 3X | | 39.61 | 58 | -3.81 | -14.13 | 580.58% |
| SOXX | PHLX Semiconductor | | 208.54 | 43 | 1.30 | 5.12 | 8.6% |
| QTEC | First -100-Tech | | 181.14 | 30 | 0.69 | 4.14 | 3.23% |
| SMH | Semiconductor | | 208.04 | 58 | 0.12 | 4.43 | 18.97% |
| 12Stocks.com: Charts, Trends, Fundamental Data and Performances of Tech Stocks | |
|
We now take in-depth look at all Tech stocks including charts, multi-period performances and overall trends (as measured by Smart Investing & Trading Score). One can sort Tech stocks (click link to choose) by Daily, Weekly and by Year-to-Date performances. Also, one can sort by size of the company or by market capitalization. |
| Select Your Default Chart Type: | |||||
| |||||
| Click on stock symbol or name for detailed view. Click on to add stock symbol to your watchlist and to view watchlist. Quick View: Move mouse or cursor over "Daily" to quickly view daily technical stock chart and over "Weekly" to view weekly technical stock chart. | |||||


 | YOU Clear Secure, Inc. |
| Sector: Technology | |
| SubSector: Software - Application | |
| MarketCap: 3510 Millions | |
| Recent Price: 17.81 Smart Investing & Trading Score: 25 | |
| Day Percent Change: -0.25% Day Change: -0.05 | |
| Week Change: 0.14% Year-to-date Change: -14.1% | |
| YOU Links: Profile News Message Board | |
| Charts:- Daily , Weekly | |
| Add YOU to Watchlist: View: Get Complete YOU Trend Analysis ➞ | |
 | AEIS Advanced Energy Industries, Inc. |
| Sector: Technology | |
| SubSector: Diversified Electronics | |
| MarketCap: 1641.86 Millions | |
| Recent Price: 92.84 Smart Investing & Trading Score: 42 | |
| Day Percent Change: -0.28% Day Change: -0.26 | |
| Week Change: 3.5% Year-to-date Change: -14.8% | |
| AEIS Links: Profile News Message Board | |
| Charts:- Daily , Weekly | |
| Add AEIS to Watchlist: View: Get Complete AEIS Trend Analysis ➞ | |
 | DAO Youdao, Inc. |
| Sector: Technology | |
| SubSector: Internet Information Providers | |
| MarketCap: 2073.2 Millions | |
| Recent Price: 3.59 Smart Investing & Trading Score: 41 | |
| Day Percent Change: -0.28% Day Change: -0.01 | |
| Week Change: 1.13% Year-to-date Change: -8.9% | |
| DAO Links: Profile News Message Board | |
| Charts:- Daily , Weekly | |
| Add DAO to Watchlist: View: Get Complete DAO Trend Analysis ➞ | |
 | LRCX Lam Research Corporation |
| Sector: Technology | |
| SubSector: Semiconductor Equipment & Materials | |
| MarketCap: 31806 Millions | |
| Recent Price: 884.89 Smart Investing & Trading Score: 58 | |
| Day Percent Change: -0.29% Day Change: -2.53 | |
| Week Change: 1.68% Year-to-date Change: 13.0% | |
| LRCX Links: Profile News Message Board | |
| Charts:- Daily , Weekly | |
| Add LRCX to Watchlist: View: Get Complete LRCX Trend Analysis ➞ | |
 | VEEV Veeva Systems Inc. |
| Sector: Technology | |
| SubSector: Healthcare Information Services | |
| MarketCap: 21492.1 Millions | |
| Recent Price: 200.52 Smart Investing & Trading Score: 25 | |
| Day Percent Change: -0.29% Day Change: -0.58 | |
| Week Change: 1.08% Year-to-date Change: 4.2% | |
| VEEV Links: Profile News Message Board | |
| Charts:- Daily , Weekly | |
| Add VEEV to Watchlist: View: Get Complete VEEV Trend Analysis ➞ | |
 | WK Workiva Inc. |
| Sector: Technology | |
| SubSector: Application Software | |
| MarketCap: 1537.42 Millions | |
| Recent Price: 80.06 Smart Investing & Trading Score: 57 | |
| Day Percent Change: -0.29% Day Change: -0.23 | |
| Week Change: 2.83% Year-to-date Change: -21.2% | |
| WK Links: Profile News Message Board | |
| Charts:- Daily , Weekly | |
| Add WK to Watchlist: View: Get Complete WK Trend Analysis ➞ | |
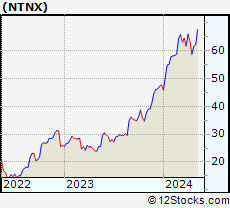 | NTNX Nutanix, Inc. |
| Sector: Technology | |
| SubSector: Technical & System Software | |
| MarketCap: 3376.6 Millions | |
| Recent Price: 60.89 Smart Investing & Trading Score: 58 | |
| Day Percent Change: -0.29% Day Change: -0.18 | |
| Week Change: 3.64% Year-to-date Change: 27.7% | |
| NTNX Links: Profile News Message Board | |
| Charts:- Daily , Weekly | |
| Add NTNX to Watchlist: View: Get Complete NTNX Trend Analysis ➞ | |
 | STER Sterling Check Corp. |
| Sector: Technology | |
| SubSector: Software - Infrastructure | |
| MarketCap: 1180 Millions | |
| Recent Price: 15.27 Smart Investing & Trading Score: 56 | |
| Day Percent Change: -0.29% Day Change: -0.04 | |
| Week Change: 1.94% Year-to-date Change: 9.6% | |
| STER Links: Profile News Message Board | |
| Charts:- Daily , Weekly | |
| Add STER to Watchlist: View: Get Complete STER Trend Analysis ➞ | |
 | GTLB GitLab Inc. |
| Sector: Technology | |
| SubSector: Software - Application | |
| MarketCap: 7840 Millions | |
| Recent Price: 55.92 Smart Investing & Trading Score: 35 | |
| Day Percent Change: -0.29% Day Change: -0.16 | |
| Week Change: 8.6% Year-to-date Change: -11.8% | |
| GTLB Links: Profile News Message Board | |
| Charts:- Daily , Weekly | |
| Add GTLB to Watchlist: View: Get Complete GTLB Trend Analysis ➞ | |
 | TRMB Trimble Inc. |
| Sector: Technology | |
| SubSector: Scientific & Technical Instruments | |
| MarketCap: 7990.33 Millions | |
| Recent Price: 59.51 Smart Investing & Trading Score: 68 | |
| Day Percent Change: -0.30% Day Change: -0.18 | |
| Week Change: 2.66% Year-to-date Change: 11.9% | |
| TRMB Links: Profile News Message Board | |
| Charts:- Daily , Weekly | |
| Add TRMB to Watchlist: View: Get Complete TRMB Trend Analysis ➞ | |
 | PDFS PDF Solutions, Inc. |
| Sector: Technology | |
| SubSector: Technical & System Software | |
| MarketCap: 345.1 Millions | |
| Recent Price: 30.08 Smart Investing & Trading Score: 32 | |
| Day Percent Change: -0.30% Day Change: -0.09 | |
| Week Change: 1.76% Year-to-date Change: -6.4% | |
| PDFS Links: Profile News Message Board | |
| Charts:- Daily , Weekly | |
| Add PDFS to Watchlist: View: Get Complete PDFS Trend Analysis ➞ | |
 | ESE ESCO Technologies Inc. |
| Sector: Technology | |
| SubSector: Scientific & Technical Instruments | |
| MarketCap: 1968.03 Millions | |
| Recent Price: 104.28 Smart Investing & Trading Score: 90 | |
| Day Percent Change: -0.32% Day Change: -0.34 | |
| Week Change: 3.33% Year-to-date Change: -10.9% | |
| ESE Links: Profile News Message Board | |
| Charts:- Daily , Weekly | |
| Add ESE to Watchlist: View: Get Complete ESE Trend Analysis ➞ | |
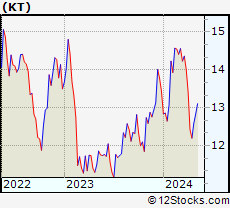 | KT KT Corporation |
| Sector: Technology | |
| SubSector: Telecom Services - Foreign | |
| MarketCap: 4216.89 Millions | |
| Recent Price: 12.65 Smart Investing & Trading Score: 49 | |
| Day Percent Change: -0.32% Day Change: -0.04 | |
| Week Change: 3.69% Year-to-date Change: -5.9% | |
| KT Links: Profile News Message Board | |
| Charts:- Daily , Weekly | |
| Add KT to Watchlist: View: Get Complete KT Trend Analysis ➞ | |
 | XNET Xunlei Limited |
| Sector: Technology | |
| SubSector: Application Software | |
| MarketCap: 203.662 Millions | |
| Recent Price: 1.55 Smart Investing & Trading Score: 90 | |
| Day Percent Change: -0.32% Day Change: -0.01 | |
| Week Change: 5.07% Year-to-date Change: -4.0% | |
| XNET Links: Profile News Message Board | |
| Charts:- Daily , Weekly | |
| Add XNET to Watchlist: View: Get Complete XNET Trend Analysis ➞ | |
 | TSM Taiwan Semiconductor Manufacturing Company Limited |
| Sector: Technology | |
| SubSector: Semiconductor - Integrated Circuits | |
| MarketCap: 239384 Millions | |
| Recent Price: 132.97 Smart Investing & Trading Score: 68 | |
| Day Percent Change: -0.34% Day Change: -0.46 | |
| Week Change: 4.13% Year-to-date Change: 27.9% | |
| TSM Links: Profile News Message Board | |
| Charts:- Daily , Weekly | |
| Add TSM to Watchlist: View: Get Complete TSM Trend Analysis ➞ | |
 | AMD Advanced Micro Devices, Inc. |
| Sector: Technology | |
| SubSector: Semiconductor - Broad Line | |
| MarketCap: 54275.1 Millions | |
| Recent Price: 151.74 Smart Investing & Trading Score: 32 | |
| Day Percent Change: -0.35% Day Change: -0.53 | |
| Week Change: 3.48% Year-to-date Change: 2.9% | |
| AMD Links: Profile News Message Board | |
| Charts:- Daily , Weekly | |
| Add AMD to Watchlist: View: Get Complete AMD Trend Analysis ➞ | |
 | SOHU Sohu.com Limited |
| Sector: Technology | |
| SubSector: Internet Information Providers | |
| MarketCap: 243.48 Millions | |
| Recent Price: 11.23 Smart Investing & Trading Score: 68 | |
| Day Percent Change: -0.35% Day Change: -0.04 | |
| Week Change: 2.37% Year-to-date Change: 13.1% | |
| SOHU Links: Profile News Message Board | |
| Charts:- Daily , Weekly | |
| Add SOHU to Watchlist: View: Get Complete SOHU Trend Analysis ➞ | |
 | VOD Vodafone Group Plc |
| Sector: Technology | |
| SubSector: Wireless Communications | |
| MarketCap: 38154.7 Millions | |
| Recent Price: 8.66 Smart Investing & Trading Score: 65 | |
| Day Percent Change: -0.35% Day Change: -0.03 | |
| Week Change: 3.84% Year-to-date Change: -0.5% | |
| VOD Links: Profile News Message Board | |
| Charts:- Daily , Weekly | |
| Add VOD to Watchlist: View: Get Complete VOD Trend Analysis ➞ | |
 | CVLT Commvault Systems, Inc. |
| Sector: Technology | |
| SubSector: Application Software | |
| MarketCap: 1607.22 Millions | |
| Recent Price: 96.83 Smart Investing & Trading Score: 70 | |
| Day Percent Change: -0.35% Day Change: -0.34 | |
| Week Change: 2.07% Year-to-date Change: 21.3% | |
| CVLT Links: Profile News Message Board | |
| Charts:- Daily , Weekly | |
| Add CVLT to Watchlist: View: Get Complete CVLT Trend Analysis ➞ | |
 | DELL Dell Technologies Inc. |
| Sector: Technology | |
| SubSector: Personal Computers | |
| MarketCap: 26750.6 Millions | |
| Recent Price: 120.20 Smart Investing & Trading Score: 53 | |
| Day Percent Change: -0.36% Day Change: -0.43 | |
| Week Change: 4.64% Year-to-date Change: 57.1% | |
| DELL Links: Profile News Message Board | |
| Charts:- Daily , Weekly | |
| Add DELL to Watchlist: View: Get Complete DELL Trend Analysis ➞ | |
 | NXT Nextracker Inc. |
| Sector: Technology | |
| SubSector: Solar | |
| MarketCap: 5590 Millions | |
| Recent Price: 44.25 Smart Investing & Trading Score: 18 | |
| Day Percent Change: -0.36% Day Change: -0.16 | |
| Week Change: 0.57% Year-to-date Change: -5.3% | |
| NXT Links: Profile News Message Board | |
| Charts:- Daily , Weekly | |
| Add NXT to Watchlist: View: Get Complete NXT Trend Analysis ➞ | |
 | CTSH Cognizant Technology Solutions Corporation |
| Sector: Technology | |
| SubSector: Information Technology Services | |
| MarketCap: 26249.7 Millions | |
| Recent Price: 67.52 Smart Investing & Trading Score: 18 | |
| Day Percent Change: -0.37% Day Change: -0.25 | |
| Week Change: 0.12% Year-to-date Change: -10.6% | |
| CTSH Links: Profile News Message Board | |
| Charts:- Daily , Weekly | |
| Add CTSH to Watchlist: View: Get Complete CTSH Trend Analysis ➞ | |
 | GIB CGI Inc. |
| Sector: Technology | |
| SubSector: Information Technology Services | |
| MarketCap: 13185.3 Millions | |
| Recent Price: 104.90 Smart Investing & Trading Score: 25 | |
| Day Percent Change: -0.37% Day Change: -0.39 | |
| Week Change: 0.86% Year-to-date Change: -2.2% | |
| GIB Links: Profile News Message Board | |
| Charts:- Daily , Weekly | |
| Add GIB to Watchlist: View: Get Complete GIB Trend Analysis ➞ | |
 | ALTR Altair Engineering Inc. |
| Sector: Technology | |
| SubSector: Semiconductor - Specialized | |
| MarketCap: 2072.2 Millions | |
| Recent Price: 83.45 Smart Investing & Trading Score: 42 | |
| Day Percent Change: -0.39% Day Change: -0.33 | |
| Week Change: 1.32% Year-to-date Change: -0.8% | |
| ALTR Links: Profile News Message Board | |
| Charts:- Daily , Weekly | |
| Add ALTR to Watchlist: View: Get Complete ALTR Trend Analysis ➞ | |
 | ACIW ACI Worldwide, Inc. |
| Sector: Technology | |
| SubSector: Technical & System Software | |
| MarketCap: 2645.7 Millions | |
| Recent Price: 33.33 Smart Investing & Trading Score: 100 | |
| Day Percent Change: -0.39% Day Change: -0.13 | |
| Week Change: 4.32% Year-to-date Change: 8.9% | |
| ACIW Links: Profile News Message Board | |
| Charts:- Daily , Weekly | |
| Add ACIW to Watchlist: View: Get Complete ACIW Trend Analysis ➞ | |
| For tabular summary view of above stock list: Summary View ➞ 0 - 25 , 25 - 50 , 50 - 75 , 75 - 100 , 100 - 125 , 125 - 150 , 150 - 175 , 175 - 200 , 200 - 225 , 225 - 250 , 250 - 275 , 275 - 300 , 300 - 325 , 325 - 350 , 350 - 375 , 375 - 400 , 400 - 425 , 425 - 450 , 450 - 475 , 475 - 500 , 500 - 525 , 525 - 550 , 550 - 575 , 575 - 600 , 600 - 625 , 625 - 650 | ||
| Click To Change The Sort Order: By Market Cap or Company Size Performance: Year-to-date, Week and Day | |
| Select Chart Type: | ||
|
Best Stocks Today 12Stocks.com |
© 2024 12Stocks.com Terms & Conditions Privacy Contact Us
All Information Provided Only For Education And Not To Be Used For Investing or Trading. See Terms & Conditions


One More Thing ... Get Best Stocks Delivered Daily!
Never Ever Miss A Move With Our Top Ten Stocks Lists
Find Best Stocks In Any Market - Bull or Bear Market
Take A Peek At Our Top Ten Stocks Lists: Daily, Weekly, Year-to-Date & Top Trends
Find Best Stocks In Any Market - Bull or Bear Market
Take A Peek At Our Top Ten Stocks Lists: Daily, Weekly, Year-to-Date & Top Trends
Technology Stocks With Best Up Trends [0-bearish to 100-bullish]: Amesite [100], Ribbon [100], Allegro MicroSystems[100], Texas [100], Microchip [100], EchoStar [100], Analog Devices[100], Vishay Inter[100], JD.com [100], Sea [100], Jamf Holding[100]
Best Technology Stocks Year-to-Date:
Pagaya [581.02%], MicroCloud Hologram[574.82%], MediaCo Holding[364.79%], Uxin [169.61%], CXApp [167.95%], Super Micro[165.5%], Smith Micro[162.71%], SoundHound AI[103.27%], MicroStrategy [100.38%], GigaCloud [96.01%], NextNav [95.73%] Best Technology Stocks This Week:
Matterport [166.09%], Amesite [69.72%], WiMi Hologram[64.85%], Ribbon [25.97%], HashiCorp [23.7%], SoundHound AI[22.54%], Intchains [20.36%], iQIYI [17.99%], Bilibili [16.87%], FTC Solar[16.56%], BigBear.ai [16.55%] Best Technology Stocks Daily:
Amesite [65.50%], WiMi Hologram[58.53%], Ribbon [26.46%], Intchains [22.28%], Uxin [13.86%], Bilibili [10.97%], Comtech Tele[10.76%], Mitcham Industries[9.88%], Navitas Semiconductor[8.83%], FTC Solar[8.51%], AMTD Digital[8.33%]