
 Login Sign Up


| |||||
 |  | ||||

| 12Stocks.com Market Intelligence |
Best Tech Stocks
| In a hurry? Tech Stocks Lists: Performance & Trends, Stock Charts, FANG Stocks
Sort Tech stocks: Daily, Weekly, Year-to-Date, Market Cap & Trends. Filter Tech stocks list by size:All Tech Large Mid-Range Small and MicroCap |
| 12Stocks.com Tech Stocks Performances & Trends Daily | |||||||||
|
|  The overall Smart Investing & Trading Score is 10 (0-bearish to 100-bullish) which puts Technology sector in short term bearish trend. The Smart Investing & Trading Score from previous trading session is 0 and hence an improvement of trend.
| ||||||||
Here are the Smart Investing & Trading Scores of the most requested Technology stocks at 12Stocks.com (click stock name for detailed review):
|


| 12Stocks.com: Investing in Technology sector with Stocks | |
|
The following table helps investors and traders sort through current performance and trends (as measured by Smart Investing & Trading Score) of various
stocks in the Tech sector. Quick View: Move mouse or cursor over stock symbol (ticker) to view short-term technical chart and over stock name to view long term chart. Click on  to add stock symbol to your watchlist and to add stock symbol to your watchlist and  to view watchlist. Click on any ticker or stock name for detailed market intelligence report for that stock. to view watchlist. Click on any ticker or stock name for detailed market intelligence report for that stock. |
12Stocks.com Performance of Stocks in Tech Sector
| Ticker | Stock Name | Watchlist | Category | Recent Price | Smart Investing & Trading Score | Change % | YTD Change% |
| MLAB | Mesa |   | Instruments | 102.26 | 83 | 1.51 | -2.40% |
| PWFL | PowerFleet | | Communication | 4.06 | 53 | 1.50 | 18.71% |
| TTMI | TTM | | Circuit Boards | 14.26 | 58 | 1.49 | -9.80% |
| AEIS | Advanced Energy | | Electronics | 91.03 | 10 | 1.48 | -16.42% |
| PCTY | Paylocity Holding | | Software | 159.55 | 55 | 1.48 | -3.22% |
| CRSR | Corsair Gaming | | Computer Hardware | 10.95 | 25 | 1.48 | -22.40% |
| PSFE | Paysafe | | Software - Infrastructure | 14.44 | 28 | 1.48 | 11.94% |
| NTES | NetEase | | Internet | 94.88 | 49 | 1.47 | 1.85% |
| ASML | ASML Holding | | Semiconductor | 872.05 | 23 | 1.46 | 15.21% |
| MX | MagnaChip Semiconductor | | Semiconductor | 4.85 | 30 | 1.46 | -35.33% |
| DSGX | Descartes Systems | | Software | 91.64 | 90 | 1.46 | 9.02% |
| MKSI | MKS | | Instruments | 109.72 | 41 | 1.43 | 6.66% |
| GOOG | Alphabet | | Internet | 157.95 | 86 | 1.43 | 12.08% |
| RCI | Rogers | | Wireless | 39.09 | 49 | 1.43 | -16.49% |
| PANW | Palo Alto | | Networking | 281.68 | 50 | 1.43 | -4.48% |
| PLAB | Photronics | | Semiconductor | 25.68 | 10 | 1.42 | -18.14% |
| TEAM | Atlassian | | IT | 194.27 | 35 | 1.42 | -18.33% |
| GOOGL | Alphabet | | Internet | 156.28 | 86 | 1.42 | 11.88% |
| KLIC | Kulicke and | | Semiconductor | 45.53 | 10 | 1.40 | -16.79% |
| SPNS | Sapiens | | Software | 30.46 | 51 | 1.40 | 5.25% |
| SPOK | Spok | | Wireless | 15.22 | 42 | 1.40 | -1.68% |
| DXC | DXC | | IT | 20.42 | 67 | 1.39 | -10.71% |
| DBX | Dropbox | | Software | 23.31 | 50 | 1.39 | -20.93% |
| SNX | SYNNEX | | IT | 114.87 | 66 | 1.37 | 6.75% |
| SAP | SAP SE | | Software | 178.18 | 43 | 1.37 | 15.26% |
| For chart view version of above stock list: Chart View ➞ 0 - 25 , 25 - 50 , 50 - 75 , 75 - 100 , 100 - 125 , 125 - 150 , 150 - 175 , 175 - 200 , 200 - 225 , 225 - 250 , 250 - 275 , 275 - 300 , 300 - 325 , 325 - 350 , 350 - 375 , 375 - 400 , 400 - 425 , 425 - 450 , 450 - 475 , 475 - 500 , 500 - 525 , 525 - 550 , 550 - 575 , 575 - 600 , 600 - 625 , 625 - 650 | ||
 | Click To Change The Sort Order: By Market Cap or Company Size Performance: Year-to-date, Week and Day |  |
|
Get the most comprehensive stock market coverage daily at 12Stocks.com ➞ Best Stocks Today ➞ Best Stocks Weekly ➞ Best Stocks Year-to-Date ➞ Best Stocks Trends ➞  Best Stocks Today 12Stocks.com Best Nasdaq Stocks ➞ Best S&P 500 Stocks ➞ Best Tech Stocks ➞ Best Biotech Stocks ➞ |
| Detailed Overview of Tech Stocks |
| Tech Technical Overview, Leaders & Laggards, Top Tech ETF Funds & Detailed Tech Stocks List, Charts, Trends & More |
| Tech Sector: Technical Analysis, Trends & YTD Performance | |
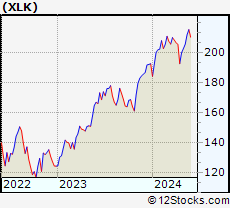
| Technology sector is composed of stocks
from semiconductors, software, web, social media
and services subsectors. Technology sector, as represented by XLK, an exchange-traded fund [ETF] that holds basket of tech stocks (e.g, Intel, Google) is up by 0.92% and is currently underperforming the overall market by -3.47% year-to-date. Below is a quick view of technical charts and trends: |
|
 XLK Weekly Chart |
|
| Long Term Trend: Not Good | |
| Medium Term Trend: Not Good | |
 XLK Daily Chart |
|
| Short Term Trend: Not Good | |
| Overall Trend Score: 10 | |
| YTD Performance: 0.92% | |
| **Trend Scores & Views Are Only For Educational Purposes And Not For Investing | |
| 12Stocks.com: Top Performing Technology Sector Stocks | ||||||||||||||||||||||||||||||||||||||||||||||||
 The top performing Technology sector stocks year to date are
Now, more recently, over last week, the top performing Technology sector stocks on the move are


|
||||||||||||||||||||||||||||||||||||||||||||||||
| 12Stocks.com: Investing in Tech Sector using Exchange Traded Funds | |
|
The following table shows list of key exchange traded funds (ETF) that
help investors track Tech Index. For detailed view, check out our ETF Funds section of our website. Quick View: Move mouse or cursor over ETF symbol (ticker) to view short-term technical chart and over ETF name to view long term chart. Click on ticker or stock name for detailed view. Click on to add stock symbol to your watchlist and to view watchlist. |
12Stocks.com List of ETFs that track Tech Index
| Ticker | ETF Name | Watchlist | Recent Price | Smart Investing & Trading Score | Change % | Week % | Year-to-date % |
| XLK | Technology | | 194.25 | 10 | 0.89 | 0.89 | 0.92% |
| QQQ | QQQ | | 414.32 | 13 | -0.08 | -0.08 | 1.17% |
| IYW | Technology | | 126.24 | 23 | 1.19 | 1.19 | 2.84% |
| VGT | Information Technology | | 486.46 | 10 | 1.37 | 1.37 | 0.51% |
| IXN | Global Tech | | 69.38 | 23 | 0.96 | 0.96 | 1.76% |
| IGV | Tech-Software | | 79.48 | 25 | 1.21 | 1.21 | -2.03% |
| XSD | Semiconductor | | 206.62 | 10 | 1.50 | 1.5 | -8.08% |
| TQQQ | QQQ | | 50.92 | 10 | 2.91 | 2.91 | 0.43% |
| SQQQ | Short QQQ | | 12.47 | 64 | -2.88 | -2.88 | -7.29% |
| SOXL | Semicondct Bull 3X | | 32.07 | 23 | 4.16 | 4.16 | 2.13% |
| SOXS | Semicondct Bear 3X | | 43.97 | 80 | -4.68 | -4.68 | 655.5% |
| SOXX | PHLX Semiconductor | | 201.66 | 36 | 1.65 | 1.65 | 5.01% |
| QTEC | First -100-Tech | | 176.36 | 10 | 1.39 | 1.39 | 0.51% |
| SMH | Semiconductor | | 203.02 | 36 | 1.91 | 1.91 | 16.1% |
| 12Stocks.com: Charts, Trends, Fundamental Data and Performances of Tech Stocks | |
|
We now take in-depth look at all Tech stocks including charts, multi-period performances and overall trends (as measured by Smart Investing & Trading Score). One can sort Tech stocks (click link to choose) by Daily, Weekly and by Year-to-Date performances. Also, one can sort by size of the company or by market capitalization. |
| Select Your Default Chart Type: | |||||
| |||||
| Click on stock symbol or name for detailed view. Click on to add stock symbol to your watchlist and to view watchlist. Quick View: Move mouse or cursor over "Daily" to quickly view daily technical stock chart and over "Weekly" to view weekly technical stock chart. | |||||


 | MLAB Mesa Laboratories, Inc. |
| Sector: Technology | |
| SubSector: Scientific & Technical Instruments | |
| MarketCap: 935.453 Millions | |
| Recent Price: 102.26 Smart Investing & Trading Score: 83 | |
| Day Percent Change: 1.51% Day Change: 1.52 | |
| Week Change: 1.51% Year-to-date Change: -2.4% | |
| MLAB Links: Profile News Message Board | |
| Charts:- Daily , Weekly | |
| Add MLAB to Watchlist: View: Get Complete MLAB Trend Analysis ➞ | |
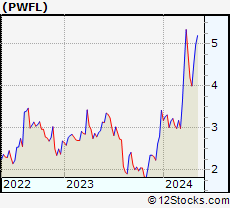 | PWFL PowerFleet, Inc. |
| Sector: Technology | |
| SubSector: Communication Equipment | |
| MarketCap: 115.239 Millions | |
| Recent Price: 4.06 Smart Investing & Trading Score: 53 | |
| Day Percent Change: 1.50% Day Change: 0.06 | |
| Week Change: 1.5% Year-to-date Change: 18.7% | |
| PWFL Links: Profile News Message Board | |
| Charts:- Daily , Weekly | |
| Add PWFL to Watchlist: View: Get Complete PWFL Trend Analysis ➞ | |
 | TTMI TTM Technologies, Inc. |
| Sector: Technology | |
| SubSector: Printed Circuit Boards | |
| MarketCap: 1028.35 Millions | |
| Recent Price: 14.26 Smart Investing & Trading Score: 58 | |
| Day Percent Change: 1.49% Day Change: 0.21 | |
| Week Change: 1.49% Year-to-date Change: -9.8% | |
| TTMI Links: Profile News Message Board | |
| Charts:- Daily , Weekly | |
| Add TTMI to Watchlist: View: Get Complete TTMI Trend Analysis ➞ | |
 | AEIS Advanced Energy Industries, Inc. |
| Sector: Technology | |
| SubSector: Diversified Electronics | |
| MarketCap: 1641.86 Millions | |
| Recent Price: 91.03 Smart Investing & Trading Score: 10 | |
| Day Percent Change: 1.48% Day Change: 1.33 | |
| Week Change: 1.48% Year-to-date Change: -16.4% | |
| AEIS Links: Profile News Message Board | |
| Charts:- Daily , Weekly | |
| Add AEIS to Watchlist: View: Get Complete AEIS Trend Analysis ➞ | |
 | PCTY Paylocity Holding Corporation |
| Sector: Technology | |
| SubSector: Application Software | |
| MarketCap: 4972.82 Millions | |
| Recent Price: 159.55 Smart Investing & Trading Score: 55 | |
| Day Percent Change: 1.48% Day Change: 2.33 | |
| Week Change: 1.48% Year-to-date Change: -3.2% | |
| PCTY Links: Profile News Message Board | |
| Charts:- Daily , Weekly | |
| Add PCTY to Watchlist: View: Get Complete PCTY Trend Analysis ➞ | |
 | CRSR Corsair Gaming, Inc. |
| Sector: Technology | |
| SubSector: Computer Hardware | |
| MarketCap: 32187 Millions | |
| Recent Price: 10.95 Smart Investing & Trading Score: 25 | |
| Day Percent Change: 1.48% Day Change: 0.16 | |
| Week Change: 1.48% Year-to-date Change: -22.4% | |
| CRSR Links: Profile News Message Board | |
| Charts:- Daily , Weekly | |
| Add CRSR to Watchlist: View: Get Complete CRSR Trend Analysis ➞ | |
 | PSFE Paysafe Limited |
| Sector: Technology | |
| SubSector: Software - Infrastructure | |
| MarketCap: 605 Millions | |
| Recent Price: 14.44 Smart Investing & Trading Score: 28 | |
| Day Percent Change: 1.48% Day Change: 0.21 | |
| Week Change: 1.48% Year-to-date Change: 11.9% | |
| PSFE Links: Profile News Message Board | |
| Charts:- Daily , Weekly | |
| Add PSFE to Watchlist: View: Get Complete PSFE Trend Analysis ➞ | |
 | NTES NetEase, Inc. |
| Sector: Technology | |
| SubSector: Internet Software & Services | |
| MarketCap: 40105.1 Millions | |
| Recent Price: 94.88 Smart Investing & Trading Score: 49 | |
| Day Percent Change: 1.47% Day Change: 1.37 | |
| Week Change: 1.47% Year-to-date Change: 1.9% | |
| NTES Links: Profile News Message Board | |
| Charts:- Daily , Weekly | |
| Add NTES to Watchlist: View: Get Complete NTES Trend Analysis ➞ | |
 | ASML ASML Holding N.V. |
| Sector: Technology | |
| SubSector: Semiconductor Equipment & Materials | |
| MarketCap: 102565 Millions | |
| Recent Price: 872.05 Smart Investing & Trading Score: 23 | |
| Day Percent Change: 1.46% Day Change: 12.51 | |
| Week Change: 1.46% Year-to-date Change: 15.2% | |
| ASML Links: Profile News Message Board | |
| Charts:- Daily , Weekly | |
| Add ASML to Watchlist: View: Get Complete ASML Trend Analysis ➞ | |
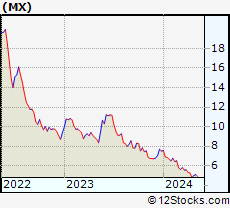 | MX MagnaChip Semiconductor Corporation |
| Sector: Technology | |
| SubSector: Semiconductor - Specialized | |
| MarketCap: 319.16 Millions | |
| Recent Price: 4.85 Smart Investing & Trading Score: 30 | |
| Day Percent Change: 1.46% Day Change: 0.07 | |
| Week Change: 1.46% Year-to-date Change: -35.3% | |
| MX Links: Profile News Message Board | |
| Charts:- Daily , Weekly | |
| Add MX to Watchlist: View: Get Complete MX Trend Analysis ➞ | |
 | DSGX The Descartes Systems Group Inc |
| Sector: Technology | |
| SubSector: Business Software & Services | |
| MarketCap: 2830.58 Millions | |
| Recent Price: 91.64 Smart Investing & Trading Score: 90 | |
| Day Percent Change: 1.46% Day Change: 1.32 | |
| Week Change: 1.46% Year-to-date Change: 9.0% | |
| DSGX Links: Profile News Message Board | |
| Charts:- Daily , Weekly | |
| Add DSGX to Watchlist: View: Get Complete DSGX Trend Analysis ➞ | |
 | MKSI MKS Instruments, Inc. |
| Sector: Technology | |
| SubSector: Scientific & Technical Instruments | |
| MarketCap: 4502.93 Millions | |
| Recent Price: 109.72 Smart Investing & Trading Score: 41 | |
| Day Percent Change: 1.43% Day Change: 1.55 | |
| Week Change: 1.43% Year-to-date Change: 6.7% | |
| MKSI Links: Profile News Message Board | |
| Charts:- Daily , Weekly | |
| Add MKSI to Watchlist: View: Get Complete MKSI Trend Analysis ➞ | |
 | GOOG Alphabet Inc. |
| Sector: Technology | |
| SubSector: Internet Information Providers | |
| MarketCap: 730159 Millions | |
| Recent Price: 157.95 Smart Investing & Trading Score: 86 | |
| Day Percent Change: 1.43% Day Change: 2.23 | |
| Week Change: 1.43% Year-to-date Change: 12.1% | |
| GOOG Links: Profile News Message Board | |
| Charts:- Daily , Weekly | |
| Add GOOG to Watchlist: View: Get Complete GOOG Trend Analysis ➞ | |
 | RCI Rogers Communications Inc. |
| Sector: Technology | |
| SubSector: Wireless Communications | |
| MarketCap: 22111.6 Millions | |
| Recent Price: 39.09 Smart Investing & Trading Score: 49 | |
| Day Percent Change: 1.43% Day Change: 0.55 | |
| Week Change: 1.43% Year-to-date Change: -16.5% | |
| RCI Links: Profile News Message Board | |
| Charts:- Daily , Weekly | |
| Add RCI to Watchlist: View: Get Complete RCI Trend Analysis ➞ | |
 | PANW Palo Alto Networks, Inc. |
| Sector: Technology | |
| SubSector: Networking & Communication Devices | |
| MarketCap: 16039.4 Millions | |
| Recent Price: 281.68 Smart Investing & Trading Score: 50 | |
| Day Percent Change: 1.43% Day Change: 3.97 | |
| Week Change: 1.43% Year-to-date Change: -4.5% | |
| PANW Links: Profile News Message Board | |
| Charts:- Daily , Weekly | |
| Add PANW to Watchlist: View: Get Complete PANW Trend Analysis ➞ | |
 | PLAB Photronics, Inc. |
| Sector: Technology | |
| SubSector: Semiconductor Equipment & Materials | |
| MarketCap: 709.018 Millions | |
| Recent Price: 25.68 Smart Investing & Trading Score: 10 | |
| Day Percent Change: 1.42% Day Change: 0.36 | |
| Week Change: 1.42% Year-to-date Change: -18.1% | |
| PLAB Links: Profile News Message Board | |
| Charts:- Daily , Weekly | |
| Add PLAB to Watchlist: View: Get Complete PLAB Trend Analysis ➞ | |
 | TEAM Atlassian Corporation Plc |
| Sector: Technology | |
| SubSector: Information Technology Services | |
| MarketCap: 32265.7 Millions | |
| Recent Price: 194.27 Smart Investing & Trading Score: 35 | |
| Day Percent Change: 1.42% Day Change: 2.72 | |
| Week Change: 1.42% Year-to-date Change: -18.3% | |
| TEAM Links: Profile News Message Board | |
| Charts:- Daily , Weekly | |
| Add TEAM to Watchlist: View: Get Complete TEAM Trend Analysis ➞ | |
 | GOOGL Alphabet Inc. |
| Sector: Technology | |
| SubSector: Internet Information Providers | |
| MarketCap: 801264 Millions | |
| Recent Price: 156.28 Smart Investing & Trading Score: 86 | |
| Day Percent Change: 1.42% Day Change: 2.19 | |
| Week Change: 1.42% Year-to-date Change: 11.9% | |
| GOOGL Links: Profile News Message Board | |
| Charts:- Daily , Weekly | |
| Add GOOGL to Watchlist: View: Get Complete GOOGL Trend Analysis ➞ | |
 | KLIC Kulicke and Soffa Industries, Inc. |
| Sector: Technology | |
| SubSector: Semiconductor Equipment & Materials | |
| MarketCap: 1336.68 Millions | |
| Recent Price: 45.53 Smart Investing & Trading Score: 10 | |
| Day Percent Change: 1.40% Day Change: 0.63 | |
| Week Change: 1.4% Year-to-date Change: -16.8% | |
| KLIC Links: Profile News Message Board | |
| Charts:- Daily , Weekly | |
| Add KLIC to Watchlist: View: Get Complete KLIC Trend Analysis ➞ | |
 | SPNS Sapiens International Corporation N.V. |
| Sector: Technology | |
| SubSector: Business Software & Services | |
| MarketCap: 841.858 Millions | |
| Recent Price: 30.46 Smart Investing & Trading Score: 51 | |
| Day Percent Change: 1.40% Day Change: 0.42 | |
| Week Change: 1.4% Year-to-date Change: 5.3% | |
| SPNS Links: Profile News Message Board | |
| Charts:- Daily , Weekly | |
| Add SPNS to Watchlist: View: Get Complete SPNS Trend Analysis ➞ | |
 | SPOK Spok Holdings, Inc. |
| Sector: Technology | |
| SubSector: Wireless Communications | |
| MarketCap: 220.827 Millions | |
| Recent Price: 15.22 Smart Investing & Trading Score: 42 | |
| Day Percent Change: 1.40% Day Change: 0.21 | |
| Week Change: 1.4% Year-to-date Change: -1.7% | |
| SPOK Links: Profile News Message Board | |
| Charts:- Daily , Weekly | |
| Add SPOK to Watchlist: View: Get Complete SPOK Trend Analysis ➞ | |
 | DXC DXC Technology Company |
| Sector: Technology | |
| SubSector: Information Technology Services | |
| MarketCap: 3622.28 Millions | |
| Recent Price: 20.42 Smart Investing & Trading Score: 67 | |
| Day Percent Change: 1.39% Day Change: 0.28 | |
| Week Change: 1.39% Year-to-date Change: -10.7% | |
| DXC Links: Profile News Message Board | |
| Charts:- Daily , Weekly | |
| Add DXC to Watchlist: View: Get Complete DXC Trend Analysis ➞ | |
 | DBX Dropbox, Inc. |
| Sector: Technology | |
| SubSector: Application Software | |
| MarketCap: 7588.32 Millions | |
| Recent Price: 23.31 Smart Investing & Trading Score: 50 | |
| Day Percent Change: 1.39% Day Change: 0.32 | |
| Week Change: 1.39% Year-to-date Change: -20.9% | |
| DBX Links: Profile News Message Board | |
| Charts:- Daily , Weekly | |
| Add DBX to Watchlist: View: Get Complete DBX Trend Analysis ➞ | |
 | SNX SYNNEX Corporation |
| Sector: Technology | |
| SubSector: Information Technology Services | |
| MarketCap: 4519.48 Millions | |
| Recent Price: 114.87 Smart Investing & Trading Score: 66 | |
| Day Percent Change: 1.37% Day Change: 1.55 | |
| Week Change: 1.37% Year-to-date Change: 6.8% | |
| SNX Links: Profile News Message Board | |
| Charts:- Daily , Weekly | |
| Add SNX to Watchlist: View: Get Complete SNX Trend Analysis ➞ | |
 | SAP SAP SE |
| Sector: Technology | |
| SubSector: Application Software | |
| MarketCap: 129635 Millions | |
| Recent Price: 178.18 Smart Investing & Trading Score: 43 | |
| Day Percent Change: 1.37% Day Change: 2.41 | |
| Week Change: 1.37% Year-to-date Change: 15.3% | |
| SAP Links: Profile News Message Board | |
| Charts:- Daily , Weekly | |
| Add SAP to Watchlist: View: Get Complete SAP Trend Analysis ➞ | |
| For tabular summary view of above stock list: Summary View ➞ 0 - 25 , 25 - 50 , 50 - 75 , 75 - 100 , 100 - 125 , 125 - 150 , 150 - 175 , 175 - 200 , 200 - 225 , 225 - 250 , 250 - 275 , 275 - 300 , 300 - 325 , 325 - 350 , 350 - 375 , 375 - 400 , 400 - 425 , 425 - 450 , 450 - 475 , 475 - 500 , 500 - 525 , 525 - 550 , 550 - 575 , 575 - 600 , 600 - 625 , 625 - 650 | ||
| Click To Change The Sort Order: By Market Cap or Company Size Performance: Year-to-date, Week and Day | |
| Select Chart Type: | ||
|
Best Stocks Today 12Stocks.com |
© 2024 12Stocks.com Terms & Conditions Privacy Contact Us
All Information Provided Only For Education And Not To Be Used For Investing or Trading. See Terms & Conditions


One More Thing ... Get Best Stocks Delivered Daily!
Never Ever Miss A Move With Our Top Ten Stocks Lists
Find Best Stocks In Any Market - Bull or Bear Market
Take A Peek At Our Top Ten Stocks Lists: Daily, Weekly, Year-to-Date & Top Trends
Find Best Stocks In Any Market - Bull or Bear Market
Take A Peek At Our Top Ten Stocks Lists: Daily, Weekly, Year-to-Date & Top Trends
Technology Stocks With Best Up Trends [0-bearish to 100-bullish]: Matterport [100], Bilibili [100], JD.com [100], Nokia [100], Zuora [100], EchoStar [100], Jamf Holding[100], NextNav [100], Badger Meter[100], Bentley Systems[100], Telefonica S.A[100]
Best Technology Stocks Year-to-Date:
Pagaya [557.66%], MediaCo Holding[327.23%], CXApp [179.54%], Smith Micro[160.29%], Super Micro[152.24%], Uxin [116.83%], MicroStrategy [109.62%], GigaCloud [102.57%], NextNav [88.76%], CuriosityStream [87%], Matterport [77.78%] Best Technology Stocks This Week:
Matterport [175.86%], MicroStrategy [12.77%], So-Young [12.45%], CommScope Holding[10.52%], Bitdeer [10.47%], Akoustis [9.78%], Aerohive Networks[8.49%], Sea [7.94%], Bilibili [7.61%], BigBear.ai [7.59%], Tigo Energy[7.53%] Best Technology Stocks Daily:
Matterport [175.86%], MicroStrategy [12.77%], So-Young [12.45%], CommScope Holding[10.52%], Bitdeer [10.47%], Akoustis [9.78%], Aerohive Networks[8.49%], Sea [7.94%], Bilibili [7.61%], BigBear.ai [7.59%], Tigo Energy[7.53%]