
 Login Sign Up


| |||||
 |  | ||||

| 12Stocks.com Market Intelligence |
Best Tech Stocks
| In a hurry? Tech Stocks Lists: Performance & Trends, Stock Charts, FANG Stocks
Sort Tech stocks: Daily, Weekly, Year-to-Date, Market Cap & Trends. Filter Tech stocks list by size:All Tech Large Mid-Range Small and MicroCap |
| 12Stocks.com Tech Stocks Performances & Trends Daily | |||||||||
|
|  The overall Smart Investing & Trading Score is 32 (0-bearish to 100-bullish) which puts Technology sector in short term bearish to neutral trend. The Smart Investing & Trading Score from previous trading session is 38 and hence a deterioration of trend.
| ||||||||
Here are the Smart Investing & Trading Scores of the most requested Technology stocks at 12Stocks.com (click stock name for detailed review):
|


| 12Stocks.com: Investing in Technology sector with Stocks | |
|
The following table helps investors and traders sort through current performance and trends (as measured by Smart Investing & Trading Score) of various
stocks in the Tech sector. Quick View: Move mouse or cursor over stock symbol (ticker) to view short-term technical chart and over stock name to view long term chart. Click on  to add stock symbol to your watchlist and to add stock symbol to your watchlist and  to view watchlist. Click on any ticker or stock name for detailed market intelligence report for that stock. to view watchlist. Click on any ticker or stock name for detailed market intelligence report for that stock. |
12Stocks.com Performance of Stocks in Tech Sector
| Ticker | Stock Name | Watchlist | Category | Recent Price | Smart Investing & Trading Score | Change % | YTD Change% |
| S | SentinelOne |   | Software - Infrastructure | 21.57 | 42 | 1.84 | -21.39% |
| INFN | Infinera | | Communication | 4.98 | 49 | 1.84 | 4.84% |
| CYBR | CyberArk Software | | Software | 244.53 | 58 | 1.84 | 11.63% |
| SWKS | Skyworks | | Semiconductor | 101.12 | 32 | 1.83 | -10.05% |
| AIP | Arteris | | Semiconductors | 6.66 | 63 | 1.83 | 13.07% |
| TCX | Tucows | | Internet | 17.92 | 42 | 1.82 | -33.63% |
| QNST | QuinStreet | | Internet | 17.65 | 90 | 1.82 | 37.68% |
| APH | Amphenol | | Electronics | 116.31 | 75 | 1.79 | 17.33% |
| ATEN | A10 Networks | | Communication | 13.71 | 100 | 1.78 | 4.10% |
| ASAN | Asana | | Software | 14.98 | 57 | 1.77 | -21.20% |
| CGNT | Cognyte Software | | Software - Infrastructure | 6.93 | 34 | 1.76 | 7.78% |
| DIOD | Diodes | | Semiconductor | 70.90 | 93 | 1.75 | -11.95% |
| ATEX | Anterix | | Telecom | 32.16 | 36 | 1.74 | -3.48% |
| YMM | Full Truck | | Software - | 8.30 | 100 | 1.72 | 18.66% |
| TME | Tencent Music | | Internet | 12.53 | 85 | 1.70 | 39.07% |
| SLP | Simulations Plus | | Software | 46.65 | 68 | 1.69 | 4.25% |
| FROG | JFrog | | Software | 39.82 | 65 | 1.66 | 15.02% |
| NVT | nVent Electric | | Electronics | 73.72 | 48 | 1.65 | 24.76% |
| OLED | Universal Display | | Semiconductor | 156.44 | 42 | 1.65 | -18.21% |
| BAND | Bandwidth | | Software | 18.45 | 53 | 1.65 | 27.51% |
| ATNI | ATN | | Telecom | 28.72 | 49 | 1.63 | -26.30% |
| GOGO | Gogo | | Communication | 8.73 | 74 | 1.63 | -13.82% |
| SIMO | Silicon Motion | | Electronics | 73.73 | 68 | 1.60 | 20.34% |
| UPLD | Upland Software | | Software | 2.25 | 35 | 1.58 | -46.93% |
| MRVL | Marvell | | Semiconductor | 64.85 | 32 | 1.55 | 7.53% |
| For chart view version of above stock list: Chart View ➞ 0 - 25 , 25 - 50 , 50 - 75 , 75 - 100 , 100 - 125 , 125 - 150 , 150 - 175 , 175 - 200 , 200 - 225 , 225 - 250 , 250 - 275 , 275 - 300 , 300 - 325 , 325 - 350 , 350 - 375 , 375 - 400 , 400 - 425 , 425 - 450 , 450 - 475 , 475 - 500 , 500 - 525 , 525 - 550 , 550 - 575 , 575 - 600 , 600 - 625 , 625 - 650 | ||
 | Click To Change The Sort Order: By Market Cap or Company Size Performance: Year-to-date, Week and Day |  |
|
Get the most comprehensive stock market coverage daily at 12Stocks.com ➞ Best Stocks Today ➞ Best Stocks Weekly ➞ Best Stocks Year-to-Date ➞ Best Stocks Trends ➞  Best Stocks Today 12Stocks.com Best Nasdaq Stocks ➞ Best S&P 500 Stocks ➞ Best Tech Stocks ➞ Best Biotech Stocks ➞ |
| Detailed Overview of Tech Stocks |
| Tech Technical Overview, Leaders & Laggards, Top Tech ETF Funds & Detailed Tech Stocks List, Charts, Trends & More |
| Tech Sector: Technical Analysis, Trends & YTD Performance | |
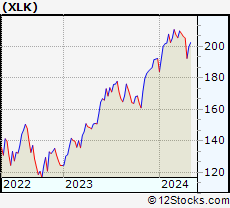
| Technology sector is composed of stocks
from semiconductors, software, web, social media
and services subsectors. Technology sector, as represented by XLK, an exchange-traded fund [ETF] that holds basket of tech stocks (e.g, Intel, Google) is up by 2.88% and is currently underperforming the overall market by -2.78% year-to-date. Below is a quick view of technical charts and trends: |
|
 XLK Weekly Chart |
|
| Long Term Trend: Good | |
| Medium Term Trend: Not Good | |
 XLK Daily Chart |
|
| Short Term Trend: Very Good | |
| Overall Trend Score: 32 | |
| YTD Performance: 2.88% | |
| **Trend Scores & Views Are Only For Educational Purposes And Not For Investing | |
| 12Stocks.com: Top Performing Technology Sector Stocks | ||||||||||||||||||||||||||||||||||||||||||||||||
 The top performing Technology sector stocks year to date are
Now, more recently, over last week, the top performing Technology sector stocks on the move are


|
||||||||||||||||||||||||||||||||||||||||||||||||
| 12Stocks.com: Investing in Tech Sector using Exchange Traded Funds | |
|
The following table shows list of key exchange traded funds (ETF) that
help investors track Tech Index. For detailed view, check out our ETF Funds section of our website. Quick View: Move mouse or cursor over ETF symbol (ticker) to view short-term technical chart and over ETF name to view long term chart. Click on ticker or stock name for detailed view. Click on to add stock symbol to your watchlist and to view watchlist. |
12Stocks.com List of ETFs that track Tech Index
| Ticker | ETF Name | Watchlist | Recent Price | Smart Investing & Trading Score | Change % | Week % | Year-to-date % |
| XLK | Technology | | 198.03 | 32 | 0.46 | 2.86 | 2.88% |
| QQQ | QQQ | | 426.51 | 58 | 0.34 | 2.86 | 4.15% |
| IYW | Technology | | 128.84 | 43 | 0.25 | 3.28 | 4.96% |
| VGT | Information Technology | | 495.24 | 30 | 0.16 | 3.2 | 2.32% |
| IXN | Global Tech | | 70.84 | 43 | 0.47 | 3.08 | 3.9% |
| IGV | Tech-Software | | 80.94 | 17 | 0.10 | 3.07 | -0.23% |
| XSD | Semiconductor | | 215.54 | 30 | 2.30 | 5.89 | -4.11% |
| TQQQ | QQQ | | 53.71 | 58 | 0.98 | 8.55 | 5.94% |
| SQQQ | Short QQQ | | 11.81 | 37 | -0.84 | -8.02 | -12.19% |
| SOXL | Semicondct Bull 3X | | 35.49 | 58 | 4.05 | 15.26 | 13.03% |
| SOXS | Semicondct Bear 3X | | 39.61 | 58 | -3.81 | -14.13 | 580.58% |
| SOXX | PHLX Semiconductor | | 208.54 | 43 | 1.30 | 5.12 | 8.6% |
| QTEC | First -100-Tech | | 181.14 | 30 | 0.69 | 4.14 | 3.23% |
| SMH | Semiconductor | | 208.04 | 58 | 0.12 | 4.43 | 18.97% |
| 12Stocks.com: Charts, Trends, Fundamental Data and Performances of Tech Stocks | |
|
We now take in-depth look at all Tech stocks including charts, multi-period performances and overall trends (as measured by Smart Investing & Trading Score). One can sort Tech stocks (click link to choose) by Daily, Weekly and by Year-to-Date performances. Also, one can sort by size of the company or by market capitalization. |
| Select Your Default Chart Type: | |||||
| |||||
| Click on stock symbol or name for detailed view. Click on to add stock symbol to your watchlist and to view watchlist. Quick View: Move mouse or cursor over "Daily" to quickly view daily technical stock chart and over "Weekly" to view weekly technical stock chart. | |||||


 | S SentinelOne, Inc. |
| Sector: Technology | |
| SubSector: Software - Infrastructure | |
| MarketCap: 4420 Millions | |
| Recent Price: 21.57 Smart Investing & Trading Score: 42 | |
| Day Percent Change: 1.84% Day Change: 0.39 | |
| Week Change: 7.58% Year-to-date Change: -21.4% | |
| S Links: Profile News Message Board | |
| Charts:- Daily , Weekly | |
| Add S to Watchlist: View: Get Complete S Trend Analysis ➞ | |
 | INFN Infinera Corporation |
| Sector: Technology | |
| SubSector: Communication Equipment | |
| MarketCap: 943 Millions | |
| Recent Price: 4.98 Smart Investing & Trading Score: 49 | |
| Day Percent Change: 1.84% Day Change: 0.09 | |
| Week Change: 5.51% Year-to-date Change: 4.8% | |
| INFN Links: Profile News Message Board | |
| Charts:- Daily , Weekly | |
| Add INFN to Watchlist: View: Get Complete INFN Trend Analysis ➞ | |
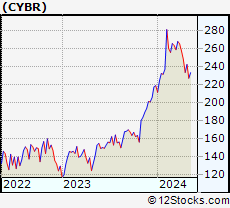 | CYBR CyberArk Software Ltd. |
| Sector: Technology | |
| SubSector: Business Software & Services | |
| MarketCap: 3223.58 Millions | |
| Recent Price: 244.53 Smart Investing & Trading Score: 58 | |
| Day Percent Change: 1.84% Day Change: 4.42 | |
| Week Change: 4.63% Year-to-date Change: 11.6% | |
| CYBR Links: Profile News Message Board | |
| Charts:- Daily , Weekly | |
| Add CYBR to Watchlist: View: Get Complete CYBR Trend Analysis ➞ | |
 | SWKS Skyworks Solutions, Inc. |
| Sector: Technology | |
| SubSector: Semiconductor - Integrated Circuits | |
| MarketCap: 13981 Millions | |
| Recent Price: 101.12 Smart Investing & Trading Score: 32 | |
| Day Percent Change: 1.83% Day Change: 1.82 | |
| Week Change: 5.21% Year-to-date Change: -10.1% | |
| SWKS Links: Profile News Message Board | |
| Charts:- Daily , Weekly | |
| Add SWKS to Watchlist: View: Get Complete SWKS Trend Analysis ➞ | |
 | AIP Arteris, Inc. |
| Sector: Technology | |
| SubSector: Semiconductors | |
| MarketCap: 234 Millions | |
| Recent Price: 6.66 Smart Investing & Trading Score: 63 | |
| Day Percent Change: 1.83% Day Change: 0.12 | |
| Week Change: 4.23% Year-to-date Change: 13.1% | |
| AIP Links: Profile News Message Board | |
| Charts:- Daily , Weekly | |
| Add AIP to Watchlist: View: Get Complete AIP Trend Analysis ➞ | |
 | TCX Tucows Inc. |
| Sector: Technology | |
| SubSector: Internet Information Providers | |
| MarketCap: 557.78 Millions | |
| Recent Price: 17.92 Smart Investing & Trading Score: 42 | |
| Day Percent Change: 1.82% Day Change: 0.32 | |
| Week Change: 2.34% Year-to-date Change: -33.6% | |
| TCX Links: Profile News Message Board | |
| Charts:- Daily , Weekly | |
| Add TCX to Watchlist: View: Get Complete TCX Trend Analysis ➞ | |
 | QNST QuinStreet, Inc. |
| Sector: Technology | |
| SubSector: Internet Software & Services | |
| MarketCap: 411.791 Millions | |
| Recent Price: 17.65 Smart Investing & Trading Score: 90 | |
| Day Percent Change: 1.82% Day Change: 0.31 | |
| Week Change: 5.06% Year-to-date Change: 37.7% | |
| QNST Links: Profile News Message Board | |
| Charts:- Daily , Weekly | |
| Add QNST to Watchlist: View: Get Complete QNST Trend Analysis ➞ | |
 | APH Amphenol Corporation |
| Sector: Technology | |
| SubSector: Diversified Electronics | |
| MarketCap: 23422 Millions | |
| Recent Price: 116.31 Smart Investing & Trading Score: 75 | |
| Day Percent Change: 1.79% Day Change: 2.05 | |
| Week Change: 5.57% Year-to-date Change: 17.3% | |
| APH Links: Profile News Message Board | |
| Charts:- Daily , Weekly | |
| Add APH to Watchlist: View: Get Complete APH Trend Analysis ➞ | |
 | ATEN A10 Networks, Inc. |
| Sector: Technology | |
| SubSector: Communication Equipment | |
| MarketCap: 363.739 Millions | |
| Recent Price: 13.71 Smart Investing & Trading Score: 100 | |
| Day Percent Change: 1.78% Day Change: 0.24 | |
| Week Change: 5.95% Year-to-date Change: 4.1% | |
| ATEN Links: Profile News Message Board | |
| Charts:- Daily , Weekly | |
| Add ATEN to Watchlist: View: Get Complete ATEN Trend Analysis ➞ | |
 | ASAN Asana, Inc. |
| Sector: Technology | |
| SubSector: Software Application | |
| MarketCap: 45087 Millions | |
| Recent Price: 14.98 Smart Investing & Trading Score: 57 | |
| Day Percent Change: 1.77% Day Change: 0.26 | |
| Week Change: 10.15% Year-to-date Change: -21.2% | |
| ASAN Links: Profile News Message Board | |
| Charts:- Daily , Weekly | |
| Add ASAN to Watchlist: View: Get Complete ASAN Trend Analysis ➞ | |
 | CGNT Cognyte Software Ltd. |
| Sector: Technology | |
| SubSector: Software - Infrastructure | |
| MarketCap: 397 Millions | |
| Recent Price: 6.93 Smart Investing & Trading Score: 34 | |
| Day Percent Change: 1.76% Day Change: 0.12 | |
| Week Change: 7.94% Year-to-date Change: 7.8% | |
| CGNT Links: Profile News Message Board | |
| Charts:- Daily , Weekly | |
| Add CGNT to Watchlist: View: Get Complete CGNT Trend Analysis ➞ | |
 | DIOD Diodes Incorporated |
| Sector: Technology | |
| SubSector: Semiconductor - Integrated Circuits | |
| MarketCap: 1967.6 Millions | |
| Recent Price: 70.90 Smart Investing & Trading Score: 93 | |
| Day Percent Change: 1.75% Day Change: 1.22 | |
| Week Change: 5.99% Year-to-date Change: -12.0% | |
| DIOD Links: Profile News Message Board | |
| Charts:- Daily , Weekly | |
| Add DIOD to Watchlist: View: Get Complete DIOD Trend Analysis ➞ | |
 | ATEX Anterix Inc. |
| Sector: Technology | |
| SubSector: Telecom Services - Domestic | |
| MarketCap: 694.077 Millions | |
| Recent Price: 32.16 Smart Investing & Trading Score: 36 | |
| Day Percent Change: 1.74% Day Change: 0.55 | |
| Week Change: 1.13% Year-to-date Change: -3.5% | |
| ATEX Links: Profile News Message Board | |
| Charts:- Daily , Weekly | |
| Add ATEX to Watchlist: View: Get Complete ATEX Trend Analysis ➞ | |
 | YMM Full Truck Alliance Co. Ltd. |
| Sector: Technology | |
| SubSector: Software - Application | |
| MarketCap: 6960 Millions | |
| Recent Price: 8.30 Smart Investing & Trading Score: 100 | |
| Day Percent Change: 1.72% Day Change: 0.14 | |
| Week Change: 6.82% Year-to-date Change: 18.7% | |
| YMM Links: Profile News Message Board | |
| Charts:- Daily , Weekly | |
| Add YMM to Watchlist: View: Get Complete YMM Trend Analysis ➞ | |
 | TME Tencent Music Entertainment Group |
| Sector: Technology | |
| SubSector: Internet Information Providers | |
| MarketCap: 16195 Millions | |
| Recent Price: 12.53 Smart Investing & Trading Score: 85 | |
| Day Percent Change: 1.70% Day Change: 0.21 | |
| Week Change: 10.3% Year-to-date Change: 39.1% | |
| TME Links: Profile News Message Board | |
| Charts:- Daily , Weekly | |
| Add TME to Watchlist: View: Get Complete TME Trend Analysis ➞ | |
 | SLP Simulations Plus, Inc. |
| Sector: Technology | |
| SubSector: Business Software & Services | |
| MarketCap: 564.258 Millions | |
| Recent Price: 46.65 Smart Investing & Trading Score: 68 | |
| Day Percent Change: 1.69% Day Change: 0.77 | |
| Week Change: 3.3% Year-to-date Change: 4.3% | |
| SLP Links: Profile News Message Board | |
| Charts:- Daily , Weekly | |
| Add SLP to Watchlist: View: Get Complete SLP Trend Analysis ➞ | |
 | FROG JFrog Ltd. |
| Sector: Technology | |
| SubSector: Software Application | |
| MarketCap: 62287 Millions | |
| Recent Price: 39.82 Smart Investing & Trading Score: 65 | |
| Day Percent Change: 1.66% Day Change: 0.65 | |
| Week Change: 6.41% Year-to-date Change: 15.0% | |
| FROG Links: Profile News Message Board | |
| Charts:- Daily , Weekly | |
| Add FROG to Watchlist: View: Get Complete FROG Trend Analysis ➞ | |
 | NVT nVent Electric plc |
| Sector: Technology | |
| SubSector: Diversified Electronics | |
| MarketCap: 2752.86 Millions | |
| Recent Price: 73.72 Smart Investing & Trading Score: 48 | |
| Day Percent Change: 1.65% Day Change: 1.20 | |
| Week Change: 2.92% Year-to-date Change: 24.8% | |
| NVT Links: Profile News Message Board | |
| Charts:- Daily , Weekly | |
| Add NVT to Watchlist: View: Get Complete NVT Trend Analysis ➞ | |
 | OLED Universal Display Corporation |
| Sector: Technology | |
| SubSector: Semiconductor Equipment & Materials | |
| MarketCap: 5660.08 Millions | |
| Recent Price: 156.44 Smart Investing & Trading Score: 42 | |
| Day Percent Change: 1.65% Day Change: 2.54 | |
| Week Change: 4.43% Year-to-date Change: -18.2% | |
| OLED Links: Profile News Message Board | |
| Charts:- Daily , Weekly | |
| Add OLED to Watchlist: View: Get Complete OLED Trend Analysis ➞ | |
 | BAND Bandwidth Inc. |
| Sector: Technology | |
| SubSector: Business Software & Services | |
| MarketCap: 1549.38 Millions | |
| Recent Price: 18.45 Smart Investing & Trading Score: 53 | |
| Day Percent Change: 1.65% Day Change: 0.30 | |
| Week Change: 6.34% Year-to-date Change: 27.5% | |
| BAND Links: Profile News Message Board | |
| Charts:- Daily , Weekly | |
| Add BAND to Watchlist: View: Get Complete BAND Trend Analysis ➞ | |
 | ATNI ATN International, Inc. |
| Sector: Technology | |
| SubSector: Telecom Services - Domestic | |
| MarketCap: 1014.77 Millions | |
| Recent Price: 28.72 Smart Investing & Trading Score: 49 | |
| Day Percent Change: 1.63% Day Change: 0.46 | |
| Week Change: 1.41% Year-to-date Change: -26.3% | |
| ATNI Links: Profile News Message Board | |
| Charts:- Daily , Weekly | |
| Add ATNI to Watchlist: View: Get Complete ATNI Trend Analysis ➞ | |
 | GOGO Gogo Inc. |
| Sector: Technology | |
| SubSector: Diversified Communication Services | |
| MarketCap: 307.064 Millions | |
| Recent Price: 8.73 Smart Investing & Trading Score: 74 | |
| Day Percent Change: 1.63% Day Change: 0.14 | |
| Week Change: 4.55% Year-to-date Change: -13.8% | |
| GOGO Links: Profile News Message Board | |
| Charts:- Daily , Weekly | |
| Add GOGO to Watchlist: View: Get Complete GOGO Trend Analysis ➞ | |
 | SIMO Silicon Motion Technology Corporation |
| Sector: Technology | |
| SubSector: Diversified Electronics | |
| MarketCap: 1186.66 Millions | |
| Recent Price: 73.73 Smart Investing & Trading Score: 68 | |
| Day Percent Change: 1.60% Day Change: 1.16 | |
| Week Change: 2.63% Year-to-date Change: 20.3% | |
| SIMO Links: Profile News Message Board | |
| Charts:- Daily , Weekly | |
| Add SIMO to Watchlist: View: Get Complete SIMO Trend Analysis ➞ | |
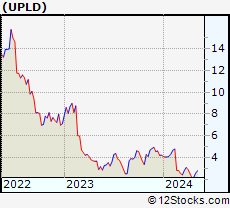 | UPLD Upland Software, Inc. |
| Sector: Technology | |
| SubSector: Application Software | |
| MarketCap: 654.562 Millions | |
| Recent Price: 2.25 Smart Investing & Trading Score: 35 | |
| Day Percent Change: 1.58% Day Change: 0.04 | |
| Week Change: 3.94% Year-to-date Change: -46.9% | |
| UPLD Links: Profile News Message Board | |
| Charts:- Daily , Weekly | |
| Add UPLD to Watchlist: View: Get Complete UPLD Trend Analysis ➞ | |
 | MRVL Marvell Technology Group Ltd. |
| Sector: Technology | |
| SubSector: Semiconductor - Integrated Circuits | |
| MarketCap: 14090.4 Millions | |
| Recent Price: 64.85 Smart Investing & Trading Score: 32 | |
| Day Percent Change: 1.55% Day Change: 0.99 | |
| Week Change: 4.38% Year-to-date Change: 7.5% | |
| MRVL Links: Profile News Message Board | |
| Charts:- Daily , Weekly | |
| Add MRVL to Watchlist: View: Get Complete MRVL Trend Analysis ➞ | |
| For tabular summary view of above stock list: Summary View ➞ 0 - 25 , 25 - 50 , 50 - 75 , 75 - 100 , 100 - 125 , 125 - 150 , 150 - 175 , 175 - 200 , 200 - 225 , 225 - 250 , 250 - 275 , 275 - 300 , 300 - 325 , 325 - 350 , 350 - 375 , 375 - 400 , 400 - 425 , 425 - 450 , 450 - 475 , 475 - 500 , 500 - 525 , 525 - 550 , 550 - 575 , 575 - 600 , 600 - 625 , 625 - 650 | ||
| Click To Change The Sort Order: By Market Cap or Company Size Performance: Year-to-date, Week and Day | |
| Select Chart Type: | ||
|
Best Stocks Today 12Stocks.com |
© 2024 12Stocks.com Terms & Conditions Privacy Contact Us
All Information Provided Only For Education And Not To Be Used For Investing or Trading. See Terms & Conditions


One More Thing ... Get Best Stocks Delivered Daily!
Never Ever Miss A Move With Our Top Ten Stocks Lists
Find Best Stocks In Any Market - Bull or Bear Market
Take A Peek At Our Top Ten Stocks Lists: Daily, Weekly, Year-to-Date & Top Trends
Find Best Stocks In Any Market - Bull or Bear Market
Take A Peek At Our Top Ten Stocks Lists: Daily, Weekly, Year-to-Date & Top Trends
Technology Stocks With Best Up Trends [0-bearish to 100-bullish]: Amesite [100], Ribbon [100], Allegro MicroSystems[100], Texas [100], Microchip [100], EchoStar [100], Analog Devices[100], Vishay Inter[100], JD.com [100], Sea [100], Jamf Holding[100]
Best Technology Stocks Year-to-Date:
Pagaya [581.02%], MicroCloud Hologram[574.82%], MediaCo Holding[364.79%], Uxin [169.61%], CXApp [167.95%], Super Micro[165.5%], Smith Micro[162.71%], SoundHound AI[103.27%], MicroStrategy [100.38%], GigaCloud [96.01%], NextNav [95.73%] Best Technology Stocks This Week:
Matterport [166.09%], Amesite [69.72%], WiMi Hologram[64.85%], Ribbon [25.97%], HashiCorp [23.7%], SoundHound AI[22.54%], Intchains [20.36%], iQIYI [17.99%], Bilibili [16.87%], FTC Solar[16.56%], BigBear.ai [16.55%] Best Technology Stocks Daily:
Amesite [65.50%], WiMi Hologram[58.53%], Ribbon [26.46%], Intchains [22.28%], Uxin [13.86%], Bilibili [10.97%], Comtech Tele[10.76%], Mitcham Industries[9.88%], Navitas Semiconductor[8.83%], FTC Solar[8.51%], AMTD Digital[8.33%]