
 Login Sign Up


| |||||
 |  | ||||

| 12Stocks.com Market Intelligence |
Best Tech Stocks
| In a hurry? Tech Stocks Lists: Performance & Trends, Stock Charts, FANG Stocks
Sort Tech stocks: Daily, Weekly, Year-to-Date, Market Cap & Trends. Filter Tech stocks list by size:All Tech Large Mid-Range Small and MicroCap |
| 12Stocks.com Tech Stocks Performances & Trends Daily | |||||||||
|
|  The overall Smart Investing & Trading Score is 38 (0-bearish to 100-bullish) which puts Technology sector in short term bearish to neutral trend. The Smart Investing & Trading Score from previous trading session is 10 and hence an improvement of trend.
| ||||||||
Here are the Smart Investing & Trading Scores of the most requested Technology stocks at 12Stocks.com (click stock name for detailed review):
|

| 12Stocks.com: Investing in Technology sector with Stocks | |
|
The following table helps investors and traders sort through current performance and trends (as measured by Smart Investing & Trading Score) of various
stocks in the Tech sector. Quick View: Move mouse or cursor over stock symbol (ticker) to view short-term technical chart and over stock name to view long term chart. Click on  to add stock symbol to your watchlist and to add stock symbol to your watchlist and  to view watchlist. Click on any ticker or stock name for detailed market intelligence report for that stock. to view watchlist. Click on any ticker or stock name for detailed market intelligence report for that stock. |
12Stocks.com Performance of Stocks in Tech Sector
| Ticker | Stock Name | Watchlist | Category | Recent Price | Smart Investing & Trading Score | Change % | YTD Change% |
| LASR | nLIGHT |   | Semiconductor | 10.95 | 32 | 1.67 | -18.89% |
| MSFT | Microsoft | | Software | 407.57 | 58 | 1.65 | 8.38% |
| VICR | Vicor | | Electronics | 35.18 | 52 | 1.65 | -21.72% |
| GDDY | GoDaddy | | Internet | 123.40 | 63 | 1.64 | 16.24% |
| DASH | DoorDash | | Internet Content & Information | 129.36 | 49 | 1.64 | 30.92% |
| IT | Gartner | | IT | 450.26 | 25 | 1.63 | -0.19% |
| API | Agora | | Software | 2.49 | 49 | 1.63 | -5.68% |
| ST | Sensata | | Instruments | 34.26 | 42 | 1.63 | -8.81% |
| PCOR | Procore | | Software - | 71.73 | 38 | 1.63 | 2.65% |
| PDFS | | Software | 30.17 | 25 | 1.62 | -6.13% | |
| LITE | Lumentum | | Communication | 42.01 | 17 | 1.62 | -19.86% |
| SPT | Sprout Social | | Software | 52.12 | 17 | 1.62 | -15.17% |
| PYCR | Paycor HCM | | Software - | 17.55 | 42 | 1.62 | -18.98% |
| TEF | Telefonica S.A | | Telecom | 4.43 | 100 | 1.61 | 13.59% |
| UMC | United Microelectronics | | Semiconductor | 7.60 | 32 | 1.60 | -10.17% |
| SATS | EchoStar | | Communication | 15.30 | 100 | 1.59 | -7.66% |
| STX | Seagate | | Data Storage | 86.53 | 75 | 1.58 | 1.36% |
| MLNK | MeridianLink | | Software - | 18.00 | 24 | 1.58 | -27.33% |
| YELP | Yelp | | Internet | 40.15 | 50 | 1.57 | -15.19% |
| BHE | Benchmark Electronics | | Circuit Boards | 30.55 | 100 | 1.56 | 10.53% |
| MRVL | Marvell | | Semiconductor | 63.86 | 17 | 1.56 | 5.89% |
| DT | Dynatrace | | Software | 46.25 | 42 | 1.56 | -15.43% |
| DOCU | DocuSign | | Software | 56.71 | 30 | 1.56 | -4.61% |
| NTAP | NetApp | | Data Storage | 99.42 | 56 | 1.54 | 12.77% |
| LBTYA | Liberty Global | | CATV | 16.70 | 42 | 1.52 | -6.02% |
| For chart view version of above stock list: Chart View ➞ 0 - 25 , 25 - 50 , 50 - 75 , 75 - 100 , 100 - 125 , 125 - 150 , 150 - 175 , 175 - 200 , 200 - 225 , 225 - 250 , 250 - 275 , 275 - 300 , 300 - 325 , 325 - 350 , 350 - 375 , 375 - 400 , 400 - 425 , 425 - 450 , 450 - 475 , 475 - 500 , 500 - 525 , 525 - 550 , 550 - 575 , 575 - 600 , 600 - 625 , 625 - 650 | ||
 | Click To Change The Sort Order: By Market Cap or Company Size Performance: Year-to-date, Week and Day |  |
|
Get the most comprehensive stock market coverage daily at 12Stocks.com ➞ Best Stocks Today ➞ Best Stocks Weekly ➞ Best Stocks Year-to-Date ➞ Best Stocks Trends ➞  Best Stocks Today 12Stocks.com Best Nasdaq Stocks ➞ Best S&P 500 Stocks ➞ Best Tech Stocks ➞ Best Biotech Stocks ➞ |
| Detailed Overview of Tech Stocks |
| Tech Technical Overview, Leaders & Laggards, Top Tech ETF Funds & Detailed Tech Stocks List, Charts, Trends & More |
| Tech Sector: Technical Analysis, Trends & YTD Performance | |
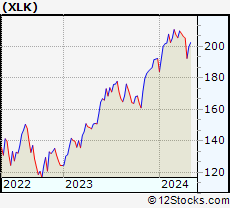
| Technology sector is composed of stocks
from semiconductors, software, web, social media
and services subsectors. Technology sector, as represented by XLK, an exchange-traded fund [ETF] that holds basket of tech stocks (e.g, Intel, Google) is up by 2.42% and is currently underperforming the overall market by -3.22% year-to-date. Below is a quick view of technical charts and trends: |
|
 XLK Weekly Chart |
|
| Long Term Trend: Not Good | |
| Medium Term Trend: Not Good | |
 XLK Daily Chart |
|
| Short Term Trend: Very Good | |
| Overall Trend Score: 38 | |
| YTD Performance: 2.42% | |
| **Trend Scores & Views Are Only For Educational Purposes And Not For Investing | |
| 12Stocks.com: Top Performing Technology Sector Stocks | ||||||||||||||||||||||||||||||||||||||||||||||||
 The top performing Technology sector stocks year to date are
Now, more recently, over last week, the top performing Technology sector stocks on the move are


|
||||||||||||||||||||||||||||||||||||||||||||||||
| 12Stocks.com: Investing in Tech Sector using Exchange Traded Funds | |
|
The following table shows list of key exchange traded funds (ETF) that
help investors track Tech Index. For detailed view, check out our ETF Funds section of our website. Quick View: Move mouse or cursor over ETF symbol (ticker) to view short-term technical chart and over ETF name to view long term chart. Click on ticker or stock name for detailed view. Click on to add stock symbol to your watchlist and to view watchlist. |
12Stocks.com List of ETFs that track Tech Index
| Ticker | ETF Name | Watchlist | Recent Price | Smart Investing & Trading Score | Change % | Week % | Year-to-date % |
| XLK | Technology | | 197.13 | 38 | 1.48 | 2.39 | 2.42% |
| QQQ | QQQ | | 425.07 | 51 | 2.59 | 2.51 | 3.8% |
| IYW | Technology | | 128.52 | 51 | 1.81 | 3.02 | 4.7% |
| VGT | Information Technology | | 494.45 | 38 | 1.64 | 3.03 | 2.16% |
| IXN | Global Tech | | 70.51 | 51 | 1.63 | 2.6 | 3.42% |
| IGV | Tech-Software | | 80.86 | 32 | 1.74 | 2.97 | -0.33% |
| XSD | Semiconductor | | 210.70 | 38 | 1.97 | 3.51 | -6.27% |
| TQQQ | QQQ | | 53.19 | 58 | 4.46 | 7.5 | 4.91% |
| SQQQ | Short QQQ | | 11.91 | 37 | -4.49 | -7.24 | -11.45% |
| SOXL | Semicondct Bull 3X | | 34.11 | 43 | 6.36 | 10.78 | 8.63% |
| SOXS | Semicondct Bear 3X | | 41.18 | 66 | -6.35 | -10.73 | 607.56% |
| SOXX | PHLX Semiconductor | | 205.87 | 51 | 2.09 | 3.77 | 7.21% |
| QTEC | First -100-Tech | | 179.90 | 45 | 2.01 | 3.43 | 2.52% |
| SMH | Semiconductor | | 207.80 | 51 | 2.35 | 4.31 | 18.83% |
| 12Stocks.com: Charts, Trends, Fundamental Data and Performances of Tech Stocks | |
|
We now take in-depth look at all Tech stocks including charts, multi-period performances and overall trends (as measured by Smart Investing & Trading Score). One can sort Tech stocks (click link to choose) by Daily, Weekly and by Year-to-Date performances. Also, one can sort by size of the company or by market capitalization. |
| Select Your Default Chart Type: | |||||
| |||||
| Click on stock symbol or name for detailed view. Click on to add stock symbol to your watchlist and to view watchlist. Quick View: Move mouse or cursor over "Daily" to quickly view daily technical stock chart and over "Weekly" to view weekly technical stock chart. | |||||


 | LASR nLIGHT, Inc. |
| Sector: Technology | |
| SubSector: Semiconductor - Broad Line | |
| MarketCap: 445.642 Millions | |
| Recent Price: 10.95 Smart Investing & Trading Score: 32 | |
| Day Percent Change: 1.67% Day Change: 0.18 | |
| Week Change: 0.74% Year-to-date Change: -18.9% | |
| LASR Links: Profile News Message Board | |
| Charts:- Daily , Weekly | |
| Add LASR to Watchlist: View: Get Complete LASR Trend Analysis ➞ | |
 | MSFT Microsoft Corporation |
| Sector: Technology | |
| SubSector: Business Software & Services | |
| MarketCap: 1154150 Millions | |
| Recent Price: 407.57 Smart Investing & Trading Score: 58 | |
| Day Percent Change: 1.65% Day Change: 6.61 | |
| Week Change: 2.12% Year-to-date Change: 8.4% | |
| MSFT Links: Profile News Message Board | |
| Charts:- Daily , Weekly | |
| Add MSFT to Watchlist: View: Get Complete MSFT Trend Analysis ➞ | |
 | VICR Vicor Corporation |
| Sector: Technology | |
| SubSector: Diversified Electronics | |
| MarketCap: 1526.76 Millions | |
| Recent Price: 35.18 Smart Investing & Trading Score: 52 | |
| Day Percent Change: 1.65% Day Change: 0.57 | |
| Week Change: 3.87% Year-to-date Change: -21.7% | |
| VICR Links: Profile News Message Board | |
| Charts:- Daily , Weekly | |
| Add VICR to Watchlist: View: Get Complete VICR Trend Analysis ➞ | |
 | GDDY GoDaddy Inc. |
| Sector: Technology | |
| SubSector: Internet Software & Services | |
| MarketCap: 9570.51 Millions | |
| Recent Price: 123.40 Smart Investing & Trading Score: 63 | |
| Day Percent Change: 1.64% Day Change: 1.99 | |
| Week Change: 2.73% Year-to-date Change: 16.2% | |
| GDDY Links: Profile News Message Board | |
| Charts:- Daily , Weekly | |
| Add GDDY to Watchlist: View: Get Complete GDDY Trend Analysis ➞ | |
 | DASH DoorDash, Inc. |
| Sector: Technology | |
| SubSector: Internet Content & Information | |
| MarketCap: 59087 Millions | |
| Recent Price: 129.36 Smart Investing & Trading Score: 49 | |
| Day Percent Change: 1.64% Day Change: 2.09 | |
| Week Change: 1.48% Year-to-date Change: 30.9% | |
| DASH Links: Profile News Message Board | |
| Charts:- Daily , Weekly | |
| Add DASH to Watchlist: View: Get Complete DASH Trend Analysis ➞ | |
 | IT Gartner, Inc. |
| Sector: Technology | |
| SubSector: Information Technology Services | |
| MarketCap: 7767.98 Millions | |
| Recent Price: 450.26 Smart Investing & Trading Score: 25 | |
| Day Percent Change: 1.63% Day Change: 7.20 | |
| Week Change: 2.24% Year-to-date Change: -0.2% | |
| IT Links: Profile News Message Board | |
| Charts:- Daily , Weekly | |
| Add IT to Watchlist: View: Get Complete IT Trend Analysis ➞ | |
 | API Agora, Inc. |
| Sector: Technology | |
| SubSector: Software Application | |
| MarketCap: 42787 Millions | |
| Recent Price: 2.49 Smart Investing & Trading Score: 49 | |
| Day Percent Change: 1.63% Day Change: 0.04 | |
| Week Change: 3.32% Year-to-date Change: -5.7% | |
| API Links: Profile News Message Board | |
| Charts:- Daily , Weekly | |
| Add API to Watchlist: View: Get Complete API Trend Analysis ➞ | |
 | ST Sensata Technologies Holding plc |
| Sector: Technology | |
| SubSector: Scientific & Technical Instruments | |
| MarketCap: 4434.23 Millions | |
| Recent Price: 34.26 Smart Investing & Trading Score: 42 | |
| Day Percent Change: 1.63% Day Change: 0.55 | |
| Week Change: 1.66% Year-to-date Change: -8.8% | |
| ST Links: Profile News Message Board | |
| Charts:- Daily , Weekly | |
| Add ST to Watchlist: View: Get Complete ST Trend Analysis ➞ | |
 | PCOR Procore Technologies, Inc. |
| Sector: Technology | |
| SubSector: Software - Application | |
| MarketCap: 9180 Millions | |
| Recent Price: 71.73 Smart Investing & Trading Score: 38 | |
| Day Percent Change: 1.63% Day Change: 1.15 | |
| Week Change: 2.05% Year-to-date Change: 2.7% | |
| PCOR Links: Profile News Message Board | |
| Charts:- Daily , Weekly | |
| Add PCOR to Watchlist: View: Get Complete PCOR Trend Analysis ➞ | |
 | PDFS PDF Solutions, Inc. |
| Sector: Technology | |
| SubSector: Technical & System Software | |
| MarketCap: 345.1 Millions | |
| Recent Price: 30.17 Smart Investing & Trading Score: 25 | |
| Day Percent Change: 1.62% Day Change: 0.48 | |
| Week Change: 2.06% Year-to-date Change: -6.1% | |
| PDFS Links: Profile News Message Board | |
| Charts:- Daily , Weekly | |
| Add PDFS to Watchlist: View: Get Complete PDFS Trend Analysis ➞ | |
 | LITE Lumentum Holdings Inc. |
| Sector: Technology | |
| SubSector: Communication Equipment | |
| MarketCap: 4990.49 Millions | |
| Recent Price: 42.01 Smart Investing & Trading Score: 17 | |
| Day Percent Change: 1.62% Day Change: 0.67 | |
| Week Change: 0.65% Year-to-date Change: -19.9% | |
| LITE Links: Profile News Message Board | |
| Charts:- Daily , Weekly | |
| Add LITE to Watchlist: View: Get Complete LITE Trend Analysis ➞ | |
 | SPT Sprout Social, Inc. |
| Sector: Technology | |
| SubSector: Software Application | |
| MarketCap: 25087 Millions | |
| Recent Price: 52.12 Smart Investing & Trading Score: 17 | |
| Day Percent Change: 1.62% Day Change: 0.83 | |
| Week Change: 2.12% Year-to-date Change: -15.2% | |
| SPT Links: Profile News Message Board | |
| Charts:- Daily , Weekly | |
| Add SPT to Watchlist: View: Get Complete SPT Trend Analysis ➞ | |
 | PYCR Paycor HCM, Inc. |
| Sector: Technology | |
| SubSector: Software - Application | |
| MarketCap: 4220 Millions | |
| Recent Price: 17.55 Smart Investing & Trading Score: 42 | |
| Day Percent Change: 1.62% Day Change: 0.28 | |
| Week Change: 3.42% Year-to-date Change: -19.0% | |
| PYCR Links: Profile News Message Board | |
| Charts:- Daily , Weekly | |
| Add PYCR to Watchlist: View: Get Complete PYCR Trend Analysis ➞ | |
 | TEF Telefonica, S.A. |
| Sector: Technology | |
| SubSector: Telecom Services - Foreign | |
| MarketCap: 26698.4 Millions | |
| Recent Price: 4.43 Smart Investing & Trading Score: 100 | |
| Day Percent Change: 1.61% Day Change: 0.07 | |
| Week Change: 3.75% Year-to-date Change: 13.6% | |
| TEF Links: Profile News Message Board | |
| Charts:- Daily , Weekly | |
| Add TEF to Watchlist: View: Get Complete TEF Trend Analysis ➞ | |
 | UMC United Microelectronics Corporation |
| Sector: Technology | |
| SubSector: Semiconductor Equipment & Materials | |
| MarketCap: 5672.78 Millions | |
| Recent Price: 7.60 Smart Investing & Trading Score: 32 | |
| Day Percent Change: 1.60% Day Change: 0.12 | |
| Week Change: 2.7% Year-to-date Change: -10.2% | |
| UMC Links: Profile News Message Board | |
| Charts:- Daily , Weekly | |
| Add UMC to Watchlist: View: Get Complete UMC Trend Analysis ➞ | |
 | SATS EchoStar Corporation |
| Sector: Technology | |
| SubSector: Communication Equipment | |
| MarketCap: 3175.69 Millions | |
| Recent Price: 15.30 Smart Investing & Trading Score: 100 | |
| Day Percent Change: 1.59% Day Change: 0.24 | |
| Week Change: 5.15% Year-to-date Change: -7.7% | |
| SATS Links: Profile News Message Board | |
| Charts:- Daily , Weekly | |
| Add SATS to Watchlist: View: Get Complete SATS Trend Analysis ➞ | |
 | STX Seagate Technology plc |
| Sector: Technology | |
| SubSector: Data Storage Devices | |
| MarketCap: 10814.7 Millions | |
| Recent Price: 86.53 Smart Investing & Trading Score: 75 | |
| Day Percent Change: 1.58% Day Change: 1.35 | |
| Week Change: 4.94% Year-to-date Change: 1.4% | |
| STX Links: Profile News Message Board | |
| Charts:- Daily , Weekly | |
| Add STX to Watchlist: View: Get Complete STX Trend Analysis ➞ | |
 | MLNK MeridianLink, Inc. |
| Sector: Technology | |
| SubSector: Software - Application | |
| MarketCap: 1630 Millions | |
| Recent Price: 18.00 Smart Investing & Trading Score: 24 | |
| Day Percent Change: 1.58% Day Change: 0.28 | |
| Week Change: 4.59% Year-to-date Change: -27.3% | |
| MLNK Links: Profile News Message Board | |
| Charts:- Daily , Weekly | |
| Add MLNK to Watchlist: View: Get Complete MLNK Trend Analysis ➞ | |
 | YELP Yelp Inc. |
| Sector: Technology | |
| SubSector: Internet Information Providers | |
| MarketCap: 1430.1 Millions | |
| Recent Price: 40.15 Smart Investing & Trading Score: 50 | |
| Day Percent Change: 1.57% Day Change: 0.62 | |
| Week Change: 2.19% Year-to-date Change: -15.2% | |
| YELP Links: Profile News Message Board | |
| Charts:- Daily , Weekly | |
| Add YELP to Watchlist: View: Get Complete YELP Trend Analysis ➞ | |
 | BHE Benchmark Electronics, Inc. |
| Sector: Technology | |
| SubSector: Printed Circuit Boards | |
| MarketCap: 766.835 Millions | |
| Recent Price: 30.55 Smart Investing & Trading Score: 100 | |
| Day Percent Change: 1.56% Day Change: 0.47 | |
| Week Change: 3.1% Year-to-date Change: 10.5% | |
| BHE Links: Profile News Message Board | |
| Charts:- Daily , Weekly | |
| Add BHE to Watchlist: View: Get Complete BHE Trend Analysis ➞ | |
 | MRVL Marvell Technology Group Ltd. |
| Sector: Technology | |
| SubSector: Semiconductor - Integrated Circuits | |
| MarketCap: 14090.4 Millions | |
| Recent Price: 63.86 Smart Investing & Trading Score: 17 | |
| Day Percent Change: 1.56% Day Change: 0.98 | |
| Week Change: 2.78% Year-to-date Change: 5.9% | |
| MRVL Links: Profile News Message Board | |
| Charts:- Daily , Weekly | |
| Add MRVL to Watchlist: View: Get Complete MRVL Trend Analysis ➞ | |
 | DT Dynatrace, Inc. |
| Sector: Technology | |
| SubSector: Application Software | |
| MarketCap: 7007.12 Millions | |
| Recent Price: 46.25 Smart Investing & Trading Score: 42 | |
| Day Percent Change: 1.56% Day Change: 0.71 | |
| Week Change: 1.87% Year-to-date Change: -15.4% | |
| DT Links: Profile News Message Board | |
| Charts:- Daily , Weekly | |
| Add DT to Watchlist: View: Get Complete DT Trend Analysis ➞ | |
 | DOCU DocuSign, Inc. |
| Sector: Technology | |
| SubSector: Business Software & Services | |
| MarketCap: 15618.8 Millions | |
| Recent Price: 56.71 Smart Investing & Trading Score: 30 | |
| Day Percent Change: 1.56% Day Change: 0.87 | |
| Week Change: 1.89% Year-to-date Change: -4.6% | |
| DOCU Links: Profile News Message Board | |
| Charts:- Daily , Weekly | |
| Add DOCU to Watchlist: View: Get Complete DOCU Trend Analysis ➞ | |
 | NTAP NetApp, Inc. |
| Sector: Technology | |
| SubSector: Data Storage Devices | |
| MarketCap: 9028.89 Millions | |
| Recent Price: 99.42 Smart Investing & Trading Score: 56 | |
| Day Percent Change: 1.54% Day Change: 1.51 | |
| Week Change: 1.5% Year-to-date Change: 12.8% | |
| NTAP Links: Profile News Message Board | |
| Charts:- Daily , Weekly | |
| Add NTAP to Watchlist: View: Get Complete NTAP Trend Analysis ➞ | |
 | LBTYA Liberty Global plc |
| Sector: Technology | |
| SubSector: CATV Systems | |
| MarketCap: 11723.7 Millions | |
| Recent Price: 16.70 Smart Investing & Trading Score: 42 | |
| Day Percent Change: 1.52% Day Change: 0.25 | |
| Week Change: -0.36% Year-to-date Change: -6.0% | |
| LBTYA Links: Profile News Message Board | |
| Charts:- Daily , Weekly | |
| Add LBTYA to Watchlist: View: Get Complete LBTYA Trend Analysis ➞ | |
| For tabular summary view of above stock list: Summary View ➞ 0 - 25 , 25 - 50 , 50 - 75 , 75 - 100 , 100 - 125 , 125 - 150 , 150 - 175 , 175 - 200 , 200 - 225 , 225 - 250 , 250 - 275 , 275 - 300 , 300 - 325 , 325 - 350 , 350 - 375 , 375 - 400 , 400 - 425 , 425 - 450 , 450 - 475 , 475 - 500 , 500 - 525 , 525 - 550 , 550 - 575 , 575 - 600 , 600 - 625 , 625 - 650 | ||
| Click To Change The Sort Order: By Market Cap or Company Size Performance: Year-to-date, Week and Day | |
| Select Chart Type: | ||
|
Best Stocks Today 12Stocks.com |
© 2024 12Stocks.com Terms & Conditions Privacy Contact Us
All Information Provided Only For Education And Not To Be Used For Investing or Trading. See Terms & Conditions


One More Thing ... Get Best Stocks Delivered Daily!
Never Ever Miss A Move With Our Top Ten Stocks Lists
Find Best Stocks In Any Market - Bull or Bear Market
Take A Peek At Our Top Ten Stocks Lists: Daily, Weekly, Year-to-Date & Top Trends
Find Best Stocks In Any Market - Bull or Bear Market
Take A Peek At Our Top Ten Stocks Lists: Daily, Weekly, Year-to-Date & Top Trends
Technology Stocks With Best Up Trends [0-bearish to 100-bullish]: HashiCorp [100], Akoustis [100], ScanSource [100], iQIYI [100], Tencent Music[100], Payoneer Global[100], Grab [100], Sea [100], Sanmina [100], Transcat [100], ACI Worldwide[100]
Best Technology Stocks Year-to-Date:
Pagaya [574.82%], MediaCo Holding[367.14%], CXApp [172.59%], Super Micro[168.02%], Smith Micro[156.66%], Uxin [136.8%], MicroStrategy [111.94%], GigaCloud [102.02%], CuriosityStream [99.96%], SoundHound AI[95.09%], NextNav [94.49%] Best Technology Stocks This Week:
Matterport [164.37%], HashiCorp [22.53%], Akoustis [21.29%], BigBear.ai [17.93%], SoundHound AI[17.61%], Cheetah Mobile[14.69%], MicroStrategy [14.01%], Sea [12.62%], Aerohive Networks[12.55%], IonQ [12.41%], iQIYI [12.12%] Best Technology Stocks Daily:
HashiCorp [19.54%], Akoustis [10.48%], SoundHound AI[10.45%], on [10.02%], BigBear.ai [9.62%], HealthStream [9.54%], MediaCo Holding[9.34%], Uxin [9.21%], Vacasa [9.18%], Ebang [9.17%], Cheetah Mobile[8.85%]