
 Login Sign Up


| |||||
 |  | ||||

| 12Stocks.com Market Intelligence |
Best SmallCap Stocks
|
| In a hurry? Small Cap Stock Lists: Performance Trends Table, Stock Charts
Sort Small Cap stocks: Daily, Weekly, Year-to-Date, Market Cap & Trends. Filter Small Cap stocks list by sector: Show all, Tech, Finance, Energy, Staples, Retail, Industrial, Materials, Utilities and HealthCare Filter Small Cap stocks list by size: All Large Medium Small and MicroCap |
| 12Stocks.com Small Cap Stocks Performances & Trends Daily | |||||||||
|
|  The overall Smart Investing & Trading Score is 44 (0-bearish to 100-bullish) which puts Small Cap index in short term neutral trend. The Smart Investing & Trading Score from previous trading session is 58 and hence a deterioration of trend.
| ||||||||
Here are the Smart Investing & Trading Scores of the most requested small cap stocks at 12Stocks.com (click stock name for detailed review):
|


| 12Stocks.com: Investing in Smallcap Index with Stocks | |
|
The following table helps investors and traders sort through current performance and trends (as measured by Smart Investing & Trading Score) of various
stocks in the Smallcap Index. Quick View: Move mouse or cursor over stock symbol (ticker) to view short-term technical chart and over stock name to view long term chart. Click on  to add stock symbol to your watchlist and to add stock symbol to your watchlist and  to view watchlist. Click on any ticker or stock name for detailed market intelligence report for that stock. to view watchlist. Click on any ticker or stock name for detailed market intelligence report for that stock. |
12Stocks.com Performance of Stocks in Smallcap Index
| Ticker | Stock Name | Watchlist | Category | Recent Price | Smart Investing & Trading Score | Change % | YTD Change% |
| TENB | Tenable |   | Technology | 45.41 | 10 | -2.19% | -1.42% |
| HLIO | Helios | | Industrials | 44.70 | 66 | -2.32% | -1.43% |
| QCRH | QCR | | Financials | 57.54 | 12 | -1.76% | -1.46% |
| LGND | Ligand | | Health Care | 70.37 | 20 | -0.89% | -1.47% |
| BTU | Peabody Energy | | Materials | 23.94 | 25 | 2.05% | -1.56% |
| AGYS | Agilysys | | Technology | 83.45 | 80 | -0.49% | -1.62% |
| ANDE | Andersons | | Consumer Staples | 56.60 | 69 | -1.36% | -1.63% |
| BPMC | Blueprint Medicines | | Health Care | 90.73 | 81 | -1.66% | -1.64% |
| NHC | National HealthCare | | Health Care | 90.77 | 19 | -0.40% | -1.79% |
| CADE | Cadence Ban | | Financials | 29.06 | 75 | -1.06% | -1.79% |
| LAW | CS Disco | | Technology | 7.50 | 18 | 0.81% | -1.83% |
| DFH | Dream Finders | | Services & Goods | 35.34 | 51 | -2.38% | -1.83% |
| TRC | Tejon Ranch | | Financials | 16.87 | 93 | -0.18% | -1.92% |
| NWE | NorthWestern | | Utilities | 49.91 | 93 | -1.38% | -1.93% |
| FDP | Fresh Del | | Consumer Staples | 25.74 | 81 | -1.11% | -1.94% |
| CXM | Sprinklr | | Technology | 11.84 | 42 | 0.00% | -2.03% |
| AMSF | Amerisafe | | Financials | 45.82 | 74 | -10.02% | -2.05% |
| VPG | Vishay Precision | | Technology | 33.36 | 61 | 0.42% | -2.08% |
| SGH | SMART Global | | Technology | 18.51 | 17 | 4.22% | -2.22% |
| WEST | Westrock Coffee | | Consumer Staples | 9.93 | 24 | 0.20% | -2.26% |
| PFSI | PennyMac Financial | | Financials | 86.20 | 81 | -6.38% | -2.46% |
| AMRX | Amneal | | Health Care | 5.92 | 37 | -2.15% | -2.47% |
| OVID | Ovid | | Health Care | 3.14 | 17 | -0.32% | -2.48% |
| CTBI | Community Trust | | Financials | 42.77 | 100 | -1.32% | -2.49% |
| AFCG | AFC Gamma | | Financials | 11.75 | 68 | -0.47% | -2.49% |


| Too many stocks? View smallcap stocks filtered by marketcap & sector |
| Marketcap: All SmallCap Stocks (default-no microcap), Large, Mid-Range, Small |
| Smallcap Sector: Tech, Finance, Energy, Staples, Retail, Industrial, Materials, & Medical |
|
Get the most comprehensive stock market coverage daily at 12Stocks.com ➞ Best Stocks Today ➞ Best Stocks Weekly ➞ Best Stocks Year-to-Date ➞ Best Stocks Trends ➞  Best Stocks Today 12Stocks.com Best Nasdaq Stocks ➞ Best S&P 500 Stocks ➞ Best Tech Stocks ➞ Best Biotech Stocks ➞ |
| Detailed Overview of SmallCap Stocks |
| SmallCap Technical Overview, Leaders & Laggards, Top SmallCap ETF Funds & Detailed SmallCap Stocks List, Charts, Trends & More |
| Smallcap: Technical Analysis, Trends & YTD Performance | |
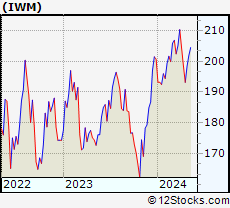
| SmallCap segment as represented by
IWM, an exchange-traded fund [ETF], holds basket of thousands of smallcap stocks from across all major sectors of the US stock market. The smallcap index (contains stocks like Riverbed & Sotheby's) is down by -2.11% and is currently underperforming the overall market by -7.27% year-to-date. Below is a quick view of technical charts and trends: | |
 IWM Weekly Chart |
|
| Long Term Trend: Good | |
| Medium Term Trend: Not Good | |
 IWM Daily Chart |
|
| Short Term Trend: Very Good | |
| Overall Trend Score: 44 | |
| YTD Performance: -2.11% | |
| **Trend Scores & Views Are Only For Educational Purposes And Not For Investing | |
| 12Stocks.com: Top Performing Small Cap Index Stocks | ||||||||||||||||||||||||||||||||||||||||||||||||
 The top performing Small Cap Index stocks year to date are
Now, more recently, over last week, the top performing Small Cap Index stocks on the move are


|
||||||||||||||||||||||||||||||||||||||||||||||||
| 12Stocks.com: Investing in Smallcap Index using Exchange Traded Funds | |
|
The following table shows list of key exchange traded funds (ETF) that
help investors track Smallcap index. The following list also includes leveraged ETF funds that track twice or thrice the daily returns of Smallcap indices. Short or inverse ETF funds move in the opposite direction to the index they track and are useful during market pullbacks or during bear markets. Quick View: Move mouse or cursor over ETF symbol (ticker) to view short-term technical chart and over ETF name to view long term chart. Click on ticker or stock name for detailed view. Click on to add stock symbol to your watchlist and to view watchlist. |
12Stocks.com List of ETFs that track Smallcap Index
| Ticker | ETF Name | Watchlist | Recent Price | Smart Investing & Trading Score | Change % | Week % | Year-to-date % |
| IWM | iShares Russell 2000 | | 196.48 | 44 | -0.61 | 1.73 | -2.11% |
| IJR | iShares Core S&P Small-Cap | | 104.86 | 78 | -0.80 | 1.59 | -3.13% |
| VTWO | Vanguard Russell 2000 ETF | | 79.45 | 63 | -0.60 | 1.75 | -2.03% |
| IWN | iShares Russell 2000 Value | | 150.18 | 68 | -0.73 | 1.62 | -3.32% |
| IWO | iShares Russell 2000 Growth | | 249.86 | 51 | -0.56 | 1.86 | -0.94% |
| IJS | iShares S&P Small-Cap 600 Value | | 96.69 | 60 | -1.04 | 1.13 | -6.19% |
| IJT | iShares S&P Small-Cap 600 Growth | | 125.06 | 63 | -0.25 | 2.33 | -0.06% |
| XSLV | PowerShares S&P SmallCap Low Volatil ETF | | 42.54 | 73 | -0.93 | 0.85 | -3.65% |
| SDD | ProShares UltraShort SmallCap600 | | 19.58 | 42 | 0.46 | -3.74 | 6.26% |
| SBB | ProShares Short SmallCap600 | | 16.50 | 40 | 0.79 | -2.02 | 3.58% |
| SMLV | SPDR SSGA US Small Cap Low Volatil ETF | | 107.33 | 73 | -1.01 | 1.17 | -4.61% |
| SAA | ProShares Ultra SmallCap600 | | 22.66 | 58 | -1.52 | 3.94 | -9.18% |
| 12Stocks.com: Charts, Trends, Fundamental Data and Performances of SmallCap Stocks | |
|
We now take in-depth look at all SmallCap stocks including charts, multi-period performances and overall trends (as measured by Smart Investing & Trading Score). One can sort SmallCap stocks (click link to choose) by Daily, Weekly and by Year-to-Date performances. Also, one can sort by size of the company or by market capitalization. |
| Select Your Default Chart Type: | |||||
| |||||
| Click on stock symbol or name for detailed view. Click on to add stock symbol to your watchlist and to view watchlist. Quick View: Move mouse or cursor over "Daily" to quickly view daily technical stock chart and over "Weekly" to view weekly technical stock chart. | |||||

 | TENB Tenable Holdings, Inc. |
| Sector: Technology | |
| SubSector: Business Software & Services | |
| MarketCap: 1986.68 Millions | |
| Recent Price: 45.41 Smart Investing & Trading Score: 10 | |
| Day Percent Change: -2.19% Day Change: -1.02 | |
| Week Change: 1.28% Year-to-date Change: -1.4% | |
| TENB Links: Profile News Message Board | |
| Charts:- Daily , Weekly | |
| Add TENB to Watchlist: View: Get Complete TENB Trend Analysis ➞ | |
 | HLIO Helios Technologies, Inc. |
| Sector: Industrials | |
| SubSector: Diversified Machinery | |
| MarketCap: 1455.66 Millions | |
| Recent Price: 44.70 Smart Investing & Trading Score: 66 | |
| Day Percent Change: -2.32% Day Change: -1.06 | |
| Week Change: -2.7% Year-to-date Change: -1.4% | |
| HLIO Links: Profile News Message Board | |
| Charts:- Daily , Weekly | |
| Add HLIO to Watchlist: View: Get Complete HLIO Trend Analysis ➞ | |
 | QCRH QCR Holdings, Inc. |
| Sector: Financials | |
| SubSector: Regional - Southwest Banks | |
| MarketCap: 465.765 Millions | |
| Recent Price: 57.54 Smart Investing & Trading Score: 12 | |
| Day Percent Change: -1.76% Day Change: -1.03 | |
| Week Change: 0.31% Year-to-date Change: -1.5% | |
| QCRH Links: Profile News Message Board | |
| Charts:- Daily , Weekly | |
| Add QCRH to Watchlist: View: Get Complete QCRH Trend Analysis ➞ | |
 | LGND Ligand Pharmaceuticals Incorporated |
| Sector: Health Care | |
| SubSector: Biotechnology | |
| MarketCap: 1344.45 Millions | |
| Recent Price: 70.37 Smart Investing & Trading Score: 20 | |
| Day Percent Change: -0.89% Day Change: -0.63 | |
| Week Change: -2.9% Year-to-date Change: -1.5% | |
| LGND Links: Profile News Message Board | |
| Charts:- Daily , Weekly | |
| Add LGND to Watchlist: View: Get Complete LGND Trend Analysis ➞ | |
 | BTU Peabody Energy Corporation |
| Sector: Materials | |
| SubSector: Industrial Metals & Minerals | |
| MarketCap: 355.11 Millions | |
| Recent Price: 23.94 Smart Investing & Trading Score: 25 | |
| Day Percent Change: 2.05% Day Change: 0.48 | |
| Week Change: -0.58% Year-to-date Change: -1.6% | |
| BTU Links: Profile News Message Board | |
| Charts:- Daily , Weekly | |
| Add BTU to Watchlist: View: Get Complete BTU Trend Analysis ➞ | |
 | AGYS Agilysys, Inc. |
| Sector: Technology | |
| SubSector: Application Software | |
| MarketCap: 391.862 Millions | |
| Recent Price: 83.45 Smart Investing & Trading Score: 80 | |
| Day Percent Change: -0.49% Day Change: -0.41 | |
| Week Change: 2.04% Year-to-date Change: -1.6% | |
| AGYS Links: Profile News Message Board | |
| Charts:- Daily , Weekly | |
| Add AGYS to Watchlist: View: Get Complete AGYS Trend Analysis ➞ | |
 | ANDE The Andersons, Inc. |
| Sector: Consumer Staples | |
| SubSector: Farm Products | |
| MarketCap: 630.887 Millions | |
| Recent Price: 56.60 Smart Investing & Trading Score: 69 | |
| Day Percent Change: -1.36% Day Change: -0.78 | |
| Week Change: -2.8% Year-to-date Change: -1.6% | |
| ANDE Links: Profile News Message Board | |
| Charts:- Daily , Weekly | |
| Add ANDE to Watchlist: View: Get Complete ANDE Trend Analysis ➞ | |
 | BPMC Blueprint Medicines Corporation |
| Sector: Health Care | |
| SubSector: Biotechnology | |
| MarketCap: 3113.55 Millions | |
| Recent Price: 90.73 Smart Investing & Trading Score: 81 | |
| Day Percent Change: -1.66% Day Change: -1.53 | |
| Week Change: 4.47% Year-to-date Change: -1.6% | |
| BPMC Links: Profile News Message Board | |
| Charts:- Daily , Weekly | |
| Add BPMC to Watchlist: View: Get Complete BPMC Trend Analysis ➞ | |
 | NHC National HealthCare Corporation |
| Sector: Health Care | |
| SubSector: Long-Term Care Facilities | |
| MarketCap: 1164.86 Millions | |
| Recent Price: 90.77 Smart Investing & Trading Score: 19 | |
| Day Percent Change: -0.40% Day Change: -0.36 | |
| Week Change: 0.17% Year-to-date Change: -1.8% | |
| NHC Links: Profile News Message Board | |
| Charts:- Daily , Weekly | |
| Add NHC to Watchlist: View: Get Complete NHC Trend Analysis ➞ | |
 | CADE Cadence Bancorporation |
| Sector: Financials | |
| SubSector: Regional - Southeast Banks | |
| MarketCap: 756.335 Millions | |
| Recent Price: 29.06 Smart Investing & Trading Score: 75 | |
| Day Percent Change: -1.06% Day Change: -0.31 | |
| Week Change: 6.96% Year-to-date Change: -1.8% | |
| CADE Links: Profile News Message Board | |
| Charts:- Daily , Weekly | |
| Add CADE to Watchlist: View: Get Complete CADE Trend Analysis ➞ | |
 | LAW CS Disco, Inc. |
| Sector: Technology | |
| SubSector: Software - Application | |
| MarketCap: 505 Millions | |
| Recent Price: 7.50 Smart Investing & Trading Score: 18 | |
| Day Percent Change: 0.81% Day Change: 0.06 | |
| Week Change: 0.4% Year-to-date Change: -1.8% | |
| LAW Links: Profile News Message Board | |
| Charts:- Daily , Weekly | |
| Add LAW to Watchlist: View: Get Complete LAW Trend Analysis ➞ | |
 | DFH Dream Finders Homes, Inc. |
| Sector: Services & Goods | |
| SubSector: Residential Construction | |
| MarketCap: 2270 Millions | |
| Recent Price: 35.34 Smart Investing & Trading Score: 51 | |
| Day Percent Change: -2.38% Day Change: -0.86 | |
| Week Change: 4.59% Year-to-date Change: -1.8% | |
| DFH Links: Profile News Message Board | |
| Charts:- Daily , Weekly | |
| Add DFH to Watchlist: View: Get Complete DFH Trend Analysis ➞ | |
 | TRC Tejon Ranch Co. |
| Sector: Financials | |
| SubSector: Property Management | |
| MarketCap: 346.442 Millions | |
| Recent Price: 16.87 Smart Investing & Trading Score: 93 | |
| Day Percent Change: -0.18% Day Change: -0.03 | |
| Week Change: 3.62% Year-to-date Change: -1.9% | |
| TRC Links: Profile News Message Board | |
| Charts:- Daily , Weekly | |
| Add TRC to Watchlist: View: Get Complete TRC Trend Analysis ➞ | |
 | NWE NorthWestern Corporation |
| Sector: Utilities | |
| SubSector: Diversified Utilities | |
| MarketCap: 2801.8 Millions | |
| Recent Price: 49.91 Smart Investing & Trading Score: 93 | |
| Day Percent Change: -1.38% Day Change: -0.70 | |
| Week Change: -0.44% Year-to-date Change: -1.9% | |
| NWE Links: Profile News Message Board | |
| Charts:- Daily , Weekly | |
| Add NWE to Watchlist: View: Get Complete NWE Trend Analysis ➞ | |
 | FDP Fresh Del Monte Produce Inc. |
| Sector: Consumer Staples | |
| SubSector: Farm Products | |
| MarketCap: 1862.37 Millions | |
| Recent Price: 25.74 Smart Investing & Trading Score: 81 | |
| Day Percent Change: -1.11% Day Change: -0.29 | |
| Week Change: -0.16% Year-to-date Change: -1.9% | |
| FDP Links: Profile News Message Board | |
| Charts:- Daily , Weekly | |
| Add FDP to Watchlist: View: Get Complete FDP Trend Analysis ➞ | |
 | CXM Sprinklr, Inc. |
| Sector: Technology | |
| SubSector: Software - Application | |
| MarketCap: 3700 Millions | |
| Recent Price: 11.84 Smart Investing & Trading Score: 42 | |
| Day Percent Change: 0.00% Day Change: 0.00 | |
| Week Change: 4.41% Year-to-date Change: -2.0% | |
| CXM Links: Profile News Message Board | |
| Charts:- Daily , Weekly | |
| Add CXM to Watchlist: View: Get Complete CXM Trend Analysis ➞ | |
 | AMSF Amerisafe, Inc. |
| Sector: Financials | |
| SubSector: Property & Casualty Insurance | |
| MarketCap: 1159.32 Millions | |
| Recent Price: 45.82 Smart Investing & Trading Score: 74 | |
| Day Percent Change: -10.02% Day Change: -5.10 | |
| Week Change: -9.94% Year-to-date Change: -2.1% | |
| AMSF Links: Profile News Message Board | |
| Charts:- Daily , Weekly | |
| Add AMSF to Watchlist: View: Get Complete AMSF Trend Analysis ➞ | |
 | VPG Vishay Precision Group, Inc. |
| Sector: Technology | |
| SubSector: Scientific & Technical Instruments | |
| MarketCap: 261.553 Millions | |
| Recent Price: 33.36 Smart Investing & Trading Score: 61 | |
| Day Percent Change: 0.42% Day Change: 0.14 | |
| Week Change: 0.27% Year-to-date Change: -2.1% | |
| VPG Links: Profile News Message Board | |
| Charts:- Daily , Weekly | |
| Add VPG to Watchlist: View: Get Complete VPG Trend Analysis ➞ | |
 | SGH SMART Global Holdings, Inc. |
| Sector: Technology | |
| SubSector: Semiconductor- Memory Chips | |
| MarketCap: 657.8 Millions | |
| Recent Price: 18.51 Smart Investing & Trading Score: 17 | |
| Day Percent Change: 4.22% Day Change: 0.75 | |
| Week Change: 9.4% Year-to-date Change: -2.2% | |
| SGH Links: Profile News Message Board | |
| Charts:- Daily , Weekly | |
| Add SGH to Watchlist: View: Get Complete SGH Trend Analysis ➞ | |
 | WEST Westrock Coffee Company, LLC |
| Sector: Consumer Staples | |
| SubSector: Packaged Foods | |
| MarketCap: 799 Millions | |
| Recent Price: 9.93 Smart Investing & Trading Score: 24 | |
| Day Percent Change: 0.20% Day Change: 0.02 | |
| Week Change: -2.93% Year-to-date Change: -2.3% | |
| WEST Links: Profile News Message Board | |
| Charts:- Daily , Weekly | |
| Add WEST to Watchlist: View: Get Complete WEST Trend Analysis ➞ | |
 | PFSI PennyMac Financial Services, Inc. |
| Sector: Financials | |
| SubSector: Mortgage Investment | |
| MarketCap: 1588.09 Millions | |
| Recent Price: 86.20 Smart Investing & Trading Score: 81 | |
| Day Percent Change: -6.38% Day Change: -5.87 | |
| Week Change: -2% Year-to-date Change: -2.5% | |
| PFSI Links: Profile News Message Board | |
| Charts:- Daily , Weekly | |
| Add PFSI to Watchlist: View: Get Complete PFSI Trend Analysis ➞ | |
 | AMRX Amneal Pharmaceuticals, Inc. |
| Sector: Health Care | |
| SubSector: Drug Related Products | |
| MarketCap: 1218.13 Millions | |
| Recent Price: 5.92 Smart Investing & Trading Score: 37 | |
| Day Percent Change: -2.15% Day Change: -0.13 | |
| Week Change: 9.23% Year-to-date Change: -2.5% | |
| AMRX Links: Profile News Message Board | |
| Charts:- Daily , Weekly | |
| Add AMRX to Watchlist: View: Get Complete AMRX Trend Analysis ➞ | |
 | OVID Ovid Therapeutics Inc. |
| Sector: Health Care | |
| SubSector: Biotechnology | |
| MarketCap: 130.385 Millions | |
| Recent Price: 3.14 Smart Investing & Trading Score: 17 | |
| Day Percent Change: -0.32% Day Change: -0.01 | |
| Week Change: -3.24% Year-to-date Change: -2.5% | |
| OVID Links: Profile News Message Board | |
| Charts:- Daily , Weekly | |
| Add OVID to Watchlist: View: Get Complete OVID Trend Analysis ➞ | |
 | CTBI Community Trust Bancorp, Inc. |
| Sector: Financials | |
| SubSector: Regional - Southeast Banks | |
| MarketCap: 608.435 Millions | |
| Recent Price: 42.77 Smart Investing & Trading Score: 100 | |
| Day Percent Change: -1.32% Day Change: -0.57 | |
| Week Change: 2.27% Year-to-date Change: -2.5% | |
| CTBI Links: Profile News Message Board | |
| Charts:- Daily , Weekly | |
| Add CTBI to Watchlist: View: Get Complete CTBI Trend Analysis ➞ | |
 | AFCG AFC Gamma, Inc. |
| Sector: Financials | |
| SubSector: REIT - Specialty | |
| MarketCap: 269 Millions | |
| Recent Price: 11.75 Smart Investing & Trading Score: 68 | |
| Day Percent Change: -0.47% Day Change: -0.05 | |
| Week Change: 0.86% Year-to-date Change: -2.5% | |
| AFCG Links: Profile News Message Board | |
| Charts:- Daily , Weekly | |
| Add AFCG to Watchlist: View: Get Complete AFCG Trend Analysis ➞ | |
| Too many stocks? View smallcap stocks filtered by marketcap & sector |
| Marketcap: All SmallCap Stocks (default-no microcap), Large, Mid-Range, Small & MicroCap |
| Sector: Tech, Finance, Energy, Staples, Retail, Industrial, Materials, Utilities & Medical |
|
Best Stocks Today 12Stocks.com |
© 2024 12Stocks.com Terms & Conditions Privacy Contact Us
All Information Provided Only For Education And Not To Be Used For Investing or Trading. See Terms & Conditions


One More Thing ... Get Best Stocks Delivered Daily!
Never Ever Miss A Move With Our Top Ten Stocks Lists
Find Best Stocks In Any Market - Bull or Bear Market
Take A Peek At Our Top Ten Stocks Lists: Daily, Weekly, Year-to-Date & Top Trends
Find Best Stocks In Any Market - Bull or Bear Market
Take A Peek At Our Top Ten Stocks Lists: Daily, Weekly, Year-to-Date & Top Trends
Smallcap Stocks With Best Up Trends [0-bearish to 100-bullish]: B. Riley[100], Central Pacific[100], California Water[100], Cricut [100], Carpenter [100], Haemonetics [100], Sanmina [100], Trustmark [100], Comstock Resources[100], EchoStar [100], Mueller Industries[100]
Best Smallcap Stocks Year-to-Date:
CareMax [490.72%], Janux [338.34%], Viking [270.02%], Alpine Immune[239.52%], Longboard [218%], Super Micro[177%], Arcutis Bio[166.56%], Avidity Biosciences[159.79%], Vera [149.94%], Hippo [128.87%], Stoke [122.15%] Best Smallcap Stocks This Week:
Matterport [168.97%], B. Riley[73.54%], Impinj [33.73%], ProKidney [32.84%], Seres [32.65%], Riot Blockchain[32.64%], Ribbon [25.58%], Cullinan Oncology[22.92%], P.A.M. Transportation[22.85%], NuScale Power[21.44%], Hibbett Sports[21.03%] Best Smallcap Stocks Daily:
Impinj [28.65%], P.A.M. Transportation[17.95%], B. Riley[16.61%], Strategic Education[16.28%], OptiNose [14.56%], JELD-WEN Holding[11.54%], Sonic Automotive[10.86%], Intevac [10.54%], SiTime [8.84%], Noodles & [8.08%], ProKidney [7.75%]