
 Login Sign Up


| |||||
 |  | ||||

| 12Stocks.com Market Intelligence |
Best SmallCap Stocks
|
| In a hurry? Small Cap Stock Lists: Performance Trends Table, Stock Charts
Sort Small Cap stocks: Daily, Weekly, Year-to-Date, Market Cap & Trends. Filter Small Cap stocks list by sector: Show all, Tech, Finance, Energy, Staples, Retail, Industrial, Materials, Utilities and HealthCare Filter Small Cap stocks list by size: All Large Medium Small and MicroCap |
| 12Stocks.com Small Cap Stocks Performances & Trends Daily | |||||||||
|
|  The overall Smart Investing & Trading Score is 23 (0-bearish to 100-bullish) which puts Small Cap index in short term bearish to neutral trend. The Smart Investing & Trading Score from previous trading session is 13 and hence an improvement of trend.
| ||||||||
Here are the Smart Investing & Trading Scores of the most requested small cap stocks at 12Stocks.com (click stock name for detailed review):
|


| 12Stocks.com: Investing in Smallcap Index with Stocks | |
|
The following table helps investors and traders sort through current performance and trends (as measured by Smart Investing & Trading Score) of various
stocks in the Smallcap Index. Quick View: Move mouse or cursor over stock symbol (ticker) to view short-term technical chart and over stock name to view long term chart. Click on  to add stock symbol to your watchlist and to add stock symbol to your watchlist and  to view watchlist. Click on any ticker or stock name for detailed market intelligence report for that stock. to view watchlist. Click on any ticker or stock name for detailed market intelligence report for that stock. |
12Stocks.com Performance of Stocks in Smallcap Index
| Ticker | Stock Name | Watchlist | Category | Recent Price | Smart Investing & Trading Score | Change % | YTD Change% |
| SQSP | Squarespace |   | Technology | 34.92 | 31 | 0.30% | 5.23% |
| RYAM | Rayonier Advanced | | Materials | 4.26 | 33 | 0.71% | 5.19% |
| ZYXI | Zynex | | Health Care | 11.45 | 41 | -5.14% | 5.14% |
| CIVI | Civitas Solutions | | Health Care | 71.89 | 15 | -1.40% | 5.13% |
| PIPR | Piper Sandler | | Financials | 183.84 | 41 | -0.65% | 5.13% |
| LXFR | Luxfer | | Industrials | 9.39 | 36 | -6.10% | 5.03% |
| MGEE | MGE Energy | | Utilities | 75.92 | 68 | 0.97% | 4.99% |
| PTEN | Patterson-UTI Energy | | Energy | 11.34 | 53 | 1.02% | 4.95% |
| EAT | Brinker | | Services & Goods | 45.30 | 63 | 2.79% | 4.91% |
| IRTC | iRhythm | | Health Care | 112.18 | 42 | 0.62% | 4.80% |
| ADUS | Addus HomeCare | | Health Care | 97.24 | 54 | 0.64% | 4.73% |
| OII | Oceaneering | | Energy | 22.28 | 26 | -1.11% | 4.70% |
| CRK | Comstock Resources | | Energy | 9.27 | 78 | 1.09% | 4.69% |
| USPH | U.S. Physical | | Health Care | 97.49 | 36 | -0.64% | 4.67% |
| BBSI | Barrett Business | | Services & Goods | 121.21 | 58 | 0.52% | 4.67% |
| SOI | Solaris Oilfield | | Energy | 8.31 | 53 | 1.84% | 4.40% |
| CMCO | Columbus McKinnon | | Industrials | 40.70 | 49 | 1.08% | 4.29% |
| SPNS | Sapiens | | Technology | 30.17 | 31 | -0.26% | 4.25% |
| THRD | Third Harmonic | | Health Care | 11.47 | 68 | 1.87% | 4.13% |
| FELE | Franklin Electric | | Industrials | 100.60 | 68 | 0.41% | 4.09% |
| BCC | Boise Cascade | | Industrials | 134.65 | 26 | -2.29% | 4.09% |
| SAFT | Safety Insurance | | Financials | 79.06 | 45 | 1.08% | 4.05% |
| PHAT | Phathom | | Health Care | 9.50 | 41 | -3.06% | 4.05% |
| TEX | Terex | | Industrials | 59.77 | 0 | -1.55% | 4.02% |
| GENC | Gencor Industries | | Industrials | 16.78 | 51 | -0.12% | 3.97% |


| Too many stocks? View smallcap stocks filtered by marketcap & sector |
| Marketcap: All SmallCap Stocks (default-no microcap), Large, Mid-Range, Small |
| Smallcap Sector: Tech, Finance, Energy, Staples, Retail, Industrial, Materials, & Medical |
|
Get the most comprehensive stock market coverage daily at 12Stocks.com ➞ Best Stocks Today ➞ Best Stocks Weekly ➞ Best Stocks Year-to-Date ➞ Best Stocks Trends ➞  Best Stocks Today 12Stocks.com Best Nasdaq Stocks ➞ Best S&P 500 Stocks ➞ Best Tech Stocks ➞ Best Biotech Stocks ➞ |
| Detailed Overview of SmallCap Stocks |
| SmallCap Technical Overview, Leaders & Laggards, Top SmallCap ETF Funds & Detailed SmallCap Stocks List, Charts, Trends & More |
| Smallcap: Technical Analysis, Trends & YTD Performance | |
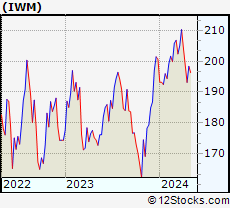
| SmallCap segment as represented by
IWM, an exchange-traded fund [ETF], holds basket of thousands of smallcap stocks from across all major sectors of the US stock market. The smallcap index (contains stocks like Riverbed & Sotheby's) is down by -3.92% and is currently underperforming the overall market by -8.11% year-to-date. Below is a quick view of technical charts and trends: | |
 IWM Weekly Chart |
|
| Long Term Trend: Not Good | |
| Medium Term Trend: Not Good | |
 IWM Daily Chart |
|
| Short Term Trend: Not Good | |
| Overall Trend Score: 23 | |
| YTD Performance: -3.92% | |
| **Trend Scores & Views Are Only For Educational Purposes And Not For Investing | |
| 12Stocks.com: Top Performing Small Cap Index Stocks | ||||||||||||||||||||||||||||||||||||||||||||||||
 The top performing Small Cap Index stocks year to date are
Now, more recently, over last week, the top performing Small Cap Index stocks on the move are


|
||||||||||||||||||||||||||||||||||||||||||||||||
| 12Stocks.com: Investing in Smallcap Index using Exchange Traded Funds | |
|
The following table shows list of key exchange traded funds (ETF) that
help investors track Smallcap index. The following list also includes leveraged ETF funds that track twice or thrice the daily returns of Smallcap indices. Short or inverse ETF funds move in the opposite direction to the index they track and are useful during market pullbacks or during bear markets. Quick View: Move mouse or cursor over ETF symbol (ticker) to view short-term technical chart and over ETF name to view long term chart. Click on ticker or stock name for detailed view. Click on to add stock symbol to your watchlist and to view watchlist. |
12Stocks.com List of ETFs that track Smallcap Index
| Ticker | ETF Name | Watchlist | Recent Price | Smart Investing & Trading Score | Change % | Week % | Year-to-date % |
| IWM | iShares Russell 2000 | | 192.84 | 23 | -0.08 | -2.94 | -3.92% |
| IJR | iShares Core S&P Small-Cap | | 102.34 | 31 | 0.21 | -2.08 | -5.46% |
| VTWO | Vanguard Russell 2000 ETF | | 77.94 | 23 | -0.14 | -2.96 | -3.9% |
| IWN | iShares Russell 2000 Value | | 146.33 | 10 | 0.21 | -2.69 | -5.79% |
| IJS | iShares S&P Small-Cap 600 Value | | 94.51 | 10 | 0.41 | -1.73 | -8.31% |
| IWO | iShares Russell 2000 Growth | | 246.94 | 36 | -0.44 | -3.3 | -2.09% |
| IJT | iShares S&P Small-Cap 600 Growth | | 121.59 | 23 | -0.21 | -2.56 | -2.84% |
| XSLV | PowerShares S&P SmallCap Low Volatil ETF | | 41.65 | 25 | 0.56 | -1.05 | -5.66% |
| SAA | ProShares Ultra SmallCap600 | | 21.62 | 10 | -0.18 | -4.17 | -13.35% |
| SMLV | SPDR SSGA US Small Cap Low Volatil ETF | | 103.83 | 18 | 0.16 | -1.13 | -7.72% |
| SBB | ProShares Short SmallCap600 | | 16.77 | 80 | -0.50 | 1.32 | 5.24% |
| SDD | ProShares UltraShort SmallCap600 | | 20.16 | 73 | -2.14 | 1.66 | 9.41% |
| 12Stocks.com: Charts, Trends, Fundamental Data and Performances of SmallCap Stocks | |
|
We now take in-depth look at all SmallCap stocks including charts, multi-period performances and overall trends (as measured by Smart Investing & Trading Score). One can sort SmallCap stocks (click link to choose) by Daily, Weekly and by Year-to-Date performances. Also, one can sort by size of the company or by market capitalization. |
| Select Your Default Chart Type: | |||||
| |||||
| Click on stock symbol or name for detailed view. Click on to add stock symbol to your watchlist and to view watchlist. Quick View: Move mouse or cursor over "Daily" to quickly view daily technical stock chart and over "Weekly" to view weekly technical stock chart. | |||||

 | SQSP Squarespace, Inc. |
| Sector: Technology | |
| SubSector: Software - Infrastructure | |
| MarketCap: 4150 Millions | |
| Recent Price: 34.92 Smart Investing & Trading Score: 31 | |
| Day Percent Change: 0.30% Day Change: 0.10 | |
| Week Change: -4.55% Year-to-date Change: 5.2% | |
| SQSP Links: Profile News Message Board | |
| Charts:- Daily , Weekly | |
| Add SQSP to Watchlist: View: Get Complete SQSP Trend Analysis ➞ | |
 | RYAM Rayonier Advanced Materials Inc. |
| Sector: Materials | |
| SubSector: Chemicals - Major Diversified | |
| MarketCap: 116.736 Millions | |
| Recent Price: 4.26 Smart Investing & Trading Score: 33 | |
| Day Percent Change: 0.71% Day Change: 0.03 | |
| Week Change: -5.96% Year-to-date Change: 5.2% | |
| RYAM Links: Profile News Message Board | |
| Charts:- Daily , Weekly | |
| Add RYAM to Watchlist: View: Get Complete RYAM Trend Analysis ➞ | |
 | ZYXI Zynex, Inc. |
| Sector: Health Care | |
| SubSector: Medical Appliances & Equipment | |
| MarketCap: 388.58 Millions | |
| Recent Price: 11.45 Smart Investing & Trading Score: 41 | |
| Day Percent Change: -5.14% Day Change: -0.62 | |
| Week Change: -3.86% Year-to-date Change: 5.1% | |
| ZYXI Links: Profile News Message Board | |
| Charts:- Daily , Weekly | |
| Add ZYXI to Watchlist: View: Get Complete ZYXI Trend Analysis ➞ | |
 | CIVI Civitas Solutions, Inc. |
| Sector: Health Care | |
| SubSector: Long-Term Care Facilities | |
| MarketCap: 625.74 Millions | |
| Recent Price: 71.89 Smart Investing & Trading Score: 15 | |
| Day Percent Change: -1.40% Day Change: -1.02 | |
| Week Change: -3.19% Year-to-date Change: 5.1% | |
| CIVI Links: Profile News Message Board | |
| Charts:- Daily , Weekly | |
| Add CIVI to Watchlist: View: Get Complete CIVI Trend Analysis ➞ | |
 | PIPR Piper Sandler Companies |
| Sector: Financials | |
| SubSector: Asset Management | |
| MarketCap: 759.603 Millions | |
| Recent Price: 183.84 Smart Investing & Trading Score: 41 | |
| Day Percent Change: -0.65% Day Change: -1.20 | |
| Week Change: -3.55% Year-to-date Change: 5.1% | |
| PIPR Links: Profile News Message Board | |
| Charts:- Daily , Weekly | |
| Add PIPR to Watchlist: View: Get Complete PIPR Trend Analysis ➞ | |
 | LXFR Luxfer Holdings PLC |
| Sector: Industrials | |
| SubSector: Diversified Machinery | |
| MarketCap: 406.716 Millions | |
| Recent Price: 9.39 Smart Investing & Trading Score: 36 | |
| Day Percent Change: -6.10% Day Change: -0.61 | |
| Week Change: -7.49% Year-to-date Change: 5.0% | |
| LXFR Links: Profile News Message Board | |
| Charts:- Daily , Weekly | |
| Add LXFR to Watchlist: View: Get Complete LXFR Trend Analysis ➞ | |
 | MGEE MGE Energy, Inc. |
| Sector: Utilities | |
| SubSector: Diversified Utilities | |
| MarketCap: 2608.3 Millions | |
| Recent Price: 75.92 Smart Investing & Trading Score: 68 | |
| Day Percent Change: 0.97% Day Change: 0.73 | |
| Week Change: 1.21% Year-to-date Change: 5.0% | |
| MGEE Links: Profile News Message Board | |
| Charts:- Daily , Weekly | |
| Add MGEE to Watchlist: View: Get Complete MGEE Trend Analysis ➞ | |
 | PTEN Patterson-UTI Energy, Inc. |
| Sector: Energy | |
| SubSector: Oil & Gas Drilling & Exploration | |
| MarketCap: 422.639 Millions | |
| Recent Price: 11.34 Smart Investing & Trading Score: 53 | |
| Day Percent Change: 1.02% Day Change: 0.12 | |
| Week Change: -2.95% Year-to-date Change: 5.0% | |
| PTEN Links: Profile News Message Board | |
| Charts:- Daily , Weekly | |
| Add PTEN to Watchlist: View: Get Complete PTEN Trend Analysis ➞ | |
 | EAT Brinker International, Inc. |
| Sector: Services & Goods | |
| SubSector: Restaurants | |
| MarketCap: 435.97 Millions | |
| Recent Price: 45.30 Smart Investing & Trading Score: 63 | |
| Day Percent Change: 2.79% Day Change: 1.23 | |
| Week Change: 0.13% Year-to-date Change: 4.9% | |
| EAT Links: Profile News Message Board | |
| Charts:- Daily , Weekly | |
| Add EAT to Watchlist: View: Get Complete EAT Trend Analysis ➞ | |
 | IRTC iRhythm Technologies, Inc. |
| Sector: Health Care | |
| SubSector: Medical Instruments & Supplies | |
| MarketCap: 2167.9 Millions | |
| Recent Price: 112.18 Smart Investing & Trading Score: 42 | |
| Day Percent Change: 0.62% Day Change: 0.69 | |
| Week Change: -0.83% Year-to-date Change: 4.8% | |
| IRTC Links: Profile News Message Board | |
| Charts:- Daily , Weekly | |
| Add IRTC to Watchlist: View: Get Complete IRTC Trend Analysis ➞ | |
 | ADUS Addus HomeCare Corporation |
| Sector: Health Care | |
| SubSector: Home Health Care | |
| MarketCap: 994.795 Millions | |
| Recent Price: 97.24 Smart Investing & Trading Score: 54 | |
| Day Percent Change: 0.64% Day Change: 0.62 | |
| Week Change: -0.62% Year-to-date Change: 4.7% | |
| ADUS Links: Profile News Message Board | |
| Charts:- Daily , Weekly | |
| Add ADUS to Watchlist: View: Get Complete ADUS Trend Analysis ➞ | |
 | OII Oceaneering International, Inc. |
| Sector: Energy | |
| SubSector: Oil & Gas Equipment & Services | |
| MarketCap: 324.061 Millions | |
| Recent Price: 22.28 Smart Investing & Trading Score: 26 | |
| Day Percent Change: -1.11% Day Change: -0.25 | |
| Week Change: -7.05% Year-to-date Change: 4.7% | |
| OII Links: Profile News Message Board | |
| Charts:- Daily , Weekly | |
| Add OII to Watchlist: View: Get Complete OII Trend Analysis ➞ | |
 | CRK Comstock Resources, Inc. |
| Sector: Energy | |
| SubSector: Independent Oil & Gas | |
| MarketCap: 959.793 Millions | |
| Recent Price: 9.27 Smart Investing & Trading Score: 78 | |
| Day Percent Change: 1.09% Day Change: 0.10 | |
| Week Change: -3.09% Year-to-date Change: 4.7% | |
| CRK Links: Profile News Message Board | |
| Charts:- Daily , Weekly | |
| Add CRK to Watchlist: View: Get Complete CRK Trend Analysis ➞ | |
 | USPH U.S. Physical Therapy, Inc. |
| Sector: Health Care | |
| SubSector: Specialized Health Services | |
| MarketCap: 793.556 Millions | |
| Recent Price: 97.49 Smart Investing & Trading Score: 36 | |
| Day Percent Change: -0.64% Day Change: -0.63 | |
| Week Change: -5.07% Year-to-date Change: 4.7% | |
| USPH Links: Profile News Message Board | |
| Charts:- Daily , Weekly | |
| Add USPH to Watchlist: View: Get Complete USPH Trend Analysis ➞ | |
 | BBSI Barrett Business Services, Inc. |
| Sector: Services & Goods | |
| SubSector: Staffing & Outsourcing Services | |
| MarketCap: 262.028 Millions | |
| Recent Price: 121.21 Smart Investing & Trading Score: 58 | |
| Day Percent Change: 0.52% Day Change: 0.63 | |
| Week Change: 0.83% Year-to-date Change: 4.7% | |
| BBSI Links: Profile News Message Board | |
| Charts:- Daily , Weekly | |
| Add BBSI to Watchlist: View: Get Complete BBSI Trend Analysis ➞ | |
 | SOI Solaris Oilfield Infrastructure, Inc. |
| Sector: Energy | |
| SubSector: Oil & Gas Equipment & Services | |
| MarketCap: 267.361 Millions | |
| Recent Price: 8.31 Smart Investing & Trading Score: 53 | |
| Day Percent Change: 1.84% Day Change: 0.15 | |
| Week Change: -2.58% Year-to-date Change: 4.4% | |
| SOI Links: Profile News Message Board | |
| Charts:- Daily , Weekly | |
| Add SOI to Watchlist: View: Get Complete SOI Trend Analysis ➞ | |
 | CMCO Columbus McKinnon Corporation |
| Sector: Industrials | |
| SubSector: Farm & Construction Machinery | |
| MarketCap: 598.807 Millions | |
| Recent Price: 40.70 Smart Investing & Trading Score: 49 | |
| Day Percent Change: 1.08% Day Change: 0.44 | |
| Week Change: -2.5% Year-to-date Change: 4.3% | |
| CMCO Links: Profile News Message Board | |
| Charts:- Daily , Weekly | |
| Add CMCO to Watchlist: View: Get Complete CMCO Trend Analysis ➞ | |
 | SPNS Sapiens International Corporation N.V. |
| Sector: Technology | |
| SubSector: Business Software & Services | |
| MarketCap: 841.858 Millions | |
| Recent Price: 30.17 Smart Investing & Trading Score: 31 | |
| Day Percent Change: -0.26% Day Change: -0.08 | |
| Week Change: -1.76% Year-to-date Change: 4.3% | |
| SPNS Links: Profile News Message Board | |
| Charts:- Daily , Weekly | |
| Add SPNS to Watchlist: View: Get Complete SPNS Trend Analysis ➞ | |
 | THRD Third Harmonic Bio, Inc. |
| Sector: Health Care | |
| SubSector: Biotechnology | |
| MarketCap: 190 Millions | |
| Recent Price: 11.47 Smart Investing & Trading Score: 68 | |
| Day Percent Change: 1.87% Day Change: 0.21 | |
| Week Change: -0.43% Year-to-date Change: 4.1% | |
| THRD Links: Profile News Message Board | |
| Charts:- Daily , Weekly | |
| Add THRD to Watchlist: View: Get Complete THRD Trend Analysis ➞ | |
 | FELE Franklin Electric Co., Inc. |
| Sector: Industrials | |
| SubSector: Industrial Electrical Equipment | |
| MarketCap: 2397.89 Millions | |
| Recent Price: 100.60 Smart Investing & Trading Score: 68 | |
| Day Percent Change: 0.41% Day Change: 0.41 | |
| Week Change: -0.81% Year-to-date Change: 4.1% | |
| FELE Links: Profile News Message Board | |
| Charts:- Daily , Weekly | |
| Add FELE to Watchlist: View: Get Complete FELE Trend Analysis ➞ | |
 | BCC Boise Cascade Company |
| Sector: Industrials | |
| SubSector: Lumber, Wood Production | |
| MarketCap: 963.938 Millions | |
| Recent Price: 134.65 Smart Investing & Trading Score: 26 | |
| Day Percent Change: -2.29% Day Change: -3.15 | |
| Week Change: -10.23% Year-to-date Change: 4.1% | |
| BCC Links: Profile News Message Board | |
| Charts:- Daily , Weekly | |
| Add BCC to Watchlist: View: Get Complete BCC Trend Analysis ➞ | |
 | SAFT Safety Insurance Group, Inc. |
| Sector: Financials | |
| SubSector: Property & Casualty Insurance | |
| MarketCap: 1145.12 Millions | |
| Recent Price: 79.06 Smart Investing & Trading Score: 45 | |
| Day Percent Change: 1.08% Day Change: 0.84 | |
| Week Change: 1.24% Year-to-date Change: 4.1% | |
| SAFT Links: Profile News Message Board | |
| Charts:- Daily , Weekly | |
| Add SAFT to Watchlist: View: Get Complete SAFT Trend Analysis ➞ | |
 | PHAT Phathom Pharmaceuticals, Inc. |
| Sector: Health Care | |
| SubSector: Biotechnology | |
| MarketCap: 728.785 Millions | |
| Recent Price: 9.50 Smart Investing & Trading Score: 41 | |
| Day Percent Change: -3.06% Day Change: -0.30 | |
| Week Change: -6.31% Year-to-date Change: 4.1% | |
| PHAT Links: Profile News Message Board | |
| Charts:- Daily , Weekly | |
| Add PHAT to Watchlist: View: Get Complete PHAT Trend Analysis ➞ | |
 | TEX Terex Corporation |
| Sector: Industrials | |
| SubSector: Farm & Construction Machinery | |
| MarketCap: 1083.07 Millions | |
| Recent Price: 59.77 Smart Investing & Trading Score: 0 | |
| Day Percent Change: -1.55% Day Change: -0.94 | |
| Week Change: -5.68% Year-to-date Change: 4.0% | |
| TEX Links: Profile News Message Board | |
| Charts:- Daily , Weekly | |
| Add TEX to Watchlist: View: Get Complete TEX Trend Analysis ➞ | |
 | GENC Gencor Industries, Inc. |
| Sector: Industrials | |
| SubSector: Farm & Construction Machinery | |
| MarketCap: 147.607 Millions | |
| Recent Price: 16.78 Smart Investing & Trading Score: 51 | |
| Day Percent Change: -0.12% Day Change: -0.02 | |
| Week Change: -1.53% Year-to-date Change: 4.0% | |
| GENC Links: Profile News Message Board | |
| Charts:- Daily , Weekly | |
| Add GENC to Watchlist: View: Get Complete GENC Trend Analysis ➞ | |
| Too many stocks? View smallcap stocks filtered by marketcap & sector |
| Marketcap: All SmallCap Stocks (default-no microcap), Large, Mid-Range, Small & MicroCap |
| Sector: Tech, Finance, Energy, Staples, Retail, Industrial, Materials, Utilities & Medical |
|
Best Stocks Today 12Stocks.com |
© 2024 12Stocks.com Terms & Conditions Privacy Contact Us
All Information Provided Only For Education And Not To Be Used For Investing or Trading. See Terms & Conditions


One More Thing ... Get Best Stocks Delivered Daily!
Never Ever Miss A Move With Our Top Ten Stocks Lists
Find Best Stocks In Any Market - Bull or Bear Market
Take A Peek At Our Top Ten Stocks Lists: Daily, Weekly, Year-to-Date & Top Trends
Find Best Stocks In Any Market - Bull or Bear Market
Take A Peek At Our Top Ten Stocks Lists: Daily, Weekly, Year-to-Date & Top Trends
Smallcap Stocks With Best Up Trends [0-bearish to 100-bullish]: Badger Meter[100], Cullinan Oncology[100], Oscar Health[100], NextNav [100], Richardson Electronics[100], Seneca Foods[100], Lantheus [100], Macatawa Bank[100], Geron [100], IMAX [100], Regional Management[100]
Best Smallcap Stocks Year-to-Date:
Agenus [500.31%], CareMax [417.53%], Janux [348.12%], Viking [248.9%], Alpine Immune[238.5%], Super Micro[226.74%], Longboard [194.76%], Arcutis Bio[192.57%], Vera [161.3%], Avidity Biosciences[154.87%], Hippo [128.32%] Best Smallcap Stocks This Week:
Macatawa Bank[44.53%], 23andMe Holding[33.3%], ProKidney [32%], Snap One[29.73%], Vertex Energy[23.08%], ALX Oncology[20.64%], Vanda [20.63%], Expensify [18.37%], Badger Meter[16.72%], ContextLogic [15%], Cullinan Oncology[13.89%] Best Smallcap Stocks Daily:
23andMe Holding[65.91%], Vertex Energy[30.72%], Zura Bio[17.20%], Badger Meter[16.65%], ContextLogic [15.81%], Expensify [15.23%], Montrose Environmental[12.84%], Vaxxinity [10.05%], Vuzix [9.87%], Cipher Mining[8.65%], FiscalNote [8.61%]