
 Login Sign Up


| |||||
 |  | ||||

| 12Stocks.com Market Intelligence |
Best SmallCap Stocks
|
| In a hurry? Small Cap Stock Lists: Performance Trends Table, Stock Charts
Sort Small Cap stocks: Daily, Weekly, Year-to-Date, Market Cap & Trends. Filter Small Cap stocks list by sector: Show all, Tech, Finance, Energy, Staples, Retail, Industrial, Materials, Utilities and HealthCare Filter Small Cap stocks list by size: All Large Medium Small and MicroCap |
| 12Stocks.com Small Cap Stocks Performances & Trends Daily | |||||||||
|
|  The overall Smart Investing & Trading Score is 44 (0-bearish to 100-bullish) which puts Small Cap index in short term neutral trend. The Smart Investing & Trading Score from previous trading session is 58 and hence a deterioration of trend.
| ||||||||
Here are the Smart Investing & Trading Scores of the most requested small cap stocks at 12Stocks.com (click stock name for detailed review):
|


| 12Stocks.com: Investing in Smallcap Index with Stocks | |
|
The following table helps investors and traders sort through current performance and trends (as measured by Smart Investing & Trading Score) of various
stocks in the Smallcap Index. Quick View: Move mouse or cursor over stock symbol (ticker) to view short-term technical chart and over stock name to view long term chart. Click on  to add stock symbol to your watchlist and to add stock symbol to your watchlist and  to view watchlist. Click on any ticker or stock name for detailed market intelligence report for that stock. to view watchlist. Click on any ticker or stock name for detailed market intelligence report for that stock. |
12Stocks.com Performance of Stocks in Smallcap Index
| Ticker | Stock Name | Watchlist | Category | Recent Price | Smart Investing & Trading Score | Change % | YTD Change% |
| DCGO | DocGo |   | Health Care | 3.49 | 32 | 0.00% | -37.57% |
| BFLY | Butterfly | | Health Care | 0.70 | 10 | -0.28% | -37.63% |
| ADTN | ADTRAN | | Technology | 4.57 | 45 | -3.79% | -37.74% |
| EB | Eventbrite | | Technology | 5.20 | 20 | -1.14% | -37.80% |
| MBUU | Malibu Boats | | Consumer Staples | 33.82 | 18 | -2.65% | -38.31% |
| CMTG | Claros Mortgage | | Financials | 8.55 | 17 | -1.72% | -38.38% |
| OPRX | OptimizeRx | | Technology | 8.79 | 10 | -3.98% | -38.54% |
| EGHT | 8x8 | | Technology | 2.32 | 47 | -2.11% | -38.62% |
| GWH | ESS Tech | | Industrials | 0.70 | 49 | -1.21% | -38.74% |
| CTKB | Cytek Biosciences | | Health Care | 5.63 | 0 | -1.31% | -38.77% |
| KLTR | Kaltura | | Technology | 1.20 | 35 | -4.00% | -38.78% |
| HPP | Hudson Pacific | | Financials | 5.68 | 20 | -4.54% | -38.99% |
| RCEL | Avita Medical | | Health Care | 8.35 | 25 | -2.57% | -39.14% |
| LVWR | LiveWire Group | | Services & Goods | 7.08 | 25 | 4.12% | -39.18% |
| CHGG | Chegg | | Services & Goods | 6.88 | 10 | 1.03% | -39.44% |
| HCAT | Health Catalyst | | Technology | 5.60 | 27 | -7.13% | -39.52% |
| ALEC | Alector | | Health Care | 4.82 | 10 | -8.29% | -39.66% |
| PSTX | Poseida | | Health Care | 2.03 | 25 | -1.69% | -39.67% |
| BBIO | BridgeBio Pharma | | Health Care | 24.35 | 20 | -2.72% | -39.68% |
| AMCX | AMC s | | Services & Goods | 11.33 | 42 | -1.48% | -39.70% |
| SFIX | Stitch Fix | | Services & Goods | 2.15 | 22 | -4.44% | -39.78% |
| COUR | Coursera | | Consumer Staples | 11.75 | 28 | -2.33% | -40.25% |
| MKTW | MarketWise | | Technology | 1.61 | 52 | -3.59% | -40.37% |
| DMRC | Digimarc | | Technology | 21.52 | 28 | -3.19% | -40.42% |
| NEOG | Neogen | | Health Care | 11.96 | 35 | -3.31% | -40.53% |


| Too many stocks? View smallcap stocks filtered by marketcap & sector |
| Marketcap: All SmallCap Stocks (default-no microcap), Large, Mid-Range, Small |
| Smallcap Sector: Tech, Finance, Energy, Staples, Retail, Industrial, Materials, & Medical |
|
Get the most comprehensive stock market coverage daily at 12Stocks.com ➞ Best Stocks Today ➞ Best Stocks Weekly ➞ Best Stocks Year-to-Date ➞ Best Stocks Trends ➞  Best Stocks Today 12Stocks.com Best Nasdaq Stocks ➞ Best S&P 500 Stocks ➞ Best Tech Stocks ➞ Best Biotech Stocks ➞ |
| Detailed Overview of SmallCap Stocks |
| SmallCap Technical Overview, Leaders & Laggards, Top SmallCap ETF Funds & Detailed SmallCap Stocks List, Charts, Trends & More |
| Smallcap: Technical Analysis, Trends & YTD Performance | |
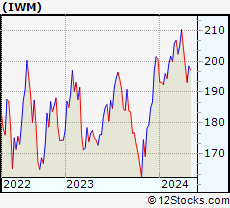
| SmallCap segment as represented by
IWM, an exchange-traded fund [ETF], holds basket of thousands of smallcap stocks from across all major sectors of the US stock market. The smallcap index (contains stocks like Riverbed & Sotheby's) is down by -2.11% and is currently underperforming the overall market by -7.27% year-to-date. Below is a quick view of technical charts and trends: | |
 IWM Weekly Chart |
|
| Long Term Trend: Good | |
| Medium Term Trend: Not Good | |
 IWM Daily Chart |
|
| Short Term Trend: Very Good | |
| Overall Trend Score: 44 | |
| YTD Performance: -2.11% | |
| **Trend Scores & Views Are Only For Educational Purposes And Not For Investing | |
| 12Stocks.com: Top Performing Small Cap Index Stocks | ||||||||||||||||||||||||||||||||||||||||||||||||
 The top performing Small Cap Index stocks year to date are
Now, more recently, over last week, the top performing Small Cap Index stocks on the move are


|
||||||||||||||||||||||||||||||||||||||||||||||||
| 12Stocks.com: Investing in Smallcap Index using Exchange Traded Funds | |
|
The following table shows list of key exchange traded funds (ETF) that
help investors track Smallcap index. The following list also includes leveraged ETF funds that track twice or thrice the daily returns of Smallcap indices. Short or inverse ETF funds move in the opposite direction to the index they track and are useful during market pullbacks or during bear markets. Quick View: Move mouse or cursor over ETF symbol (ticker) to view short-term technical chart and over ETF name to view long term chart. Click on ticker or stock name for detailed view. Click on to add stock symbol to your watchlist and to view watchlist. |
12Stocks.com List of ETFs that track Smallcap Index
| Ticker | ETF Name | Watchlist | Recent Price | Smart Investing & Trading Score | Change % | Week % | Year-to-date % |
| IWM | iShares Russell 2000 | | 196.48 | 44 | -0.61 | 1.73 | -2.11% |
| IJR | iShares Core S&P Small-Cap | | 104.86 | 78 | -0.80 | 1.59 | -3.13% |
| VTWO | Vanguard Russell 2000 ETF | | 79.45 | 63 | -0.60 | 1.75 | -2.03% |
| IWN | iShares Russell 2000 Value | | 150.18 | 68 | -0.73 | 1.62 | -3.32% |
| IWO | iShares Russell 2000 Growth | | 249.86 | 51 | -0.56 | 1.86 | -0.94% |
| IJS | iShares S&P Small-Cap 600 Value | | 96.69 | 60 | -1.04 | 1.13 | -6.19% |
| IJT | iShares S&P Small-Cap 600 Growth | | 125.06 | 63 | -0.25 | 2.33 | -0.06% |
| XSLV | PowerShares S&P SmallCap Low Volatil ETF | | 42.54 | 73 | -0.93 | 0.85 | -3.65% |
| SDD | ProShares UltraShort SmallCap600 | | 19.58 | 42 | 0.46 | -3.74 | 6.26% |
| SBB | ProShares Short SmallCap600 | | 16.50 | 40 | 0.79 | -2.02 | 3.58% |
| SMLV | SPDR SSGA US Small Cap Low Volatil ETF | | 107.33 | 73 | -1.01 | 1.17 | -4.61% |
| SAA | ProShares Ultra SmallCap600 | | 22.66 | 58 | -1.52 | 3.94 | -9.18% |
| 12Stocks.com: Charts, Trends, Fundamental Data and Performances of SmallCap Stocks | |
|
We now take in-depth look at all SmallCap stocks including charts, multi-period performances and overall trends (as measured by Smart Investing & Trading Score). One can sort SmallCap stocks (click link to choose) by Daily, Weekly and by Year-to-Date performances. Also, one can sort by size of the company or by market capitalization. |
| Select Your Default Chart Type: | |||||
| |||||
| Click on stock symbol or name for detailed view. Click on to add stock symbol to your watchlist and to view watchlist. Quick View: Move mouse or cursor over "Daily" to quickly view daily technical stock chart and over "Weekly" to view weekly technical stock chart. | |||||

 | DCGO DocGo Inc. |
| Sector: Health Care | |
| SubSector: Medical Care Facilities | |
| MarketCap: 972 Millions | |
| Recent Price: 3.49 Smart Investing & Trading Score: 32 | |
| Day Percent Change: 0.00% Day Change: 0.00 | |
| Week Change: -2.24% Year-to-date Change: -37.6% | |
| DCGO Links: Profile News Message Board | |
| Charts:- Daily , Weekly | |
| Add DCGO to Watchlist: View: Get Complete DCGO Trend Analysis ➞ | |
 | BFLY Butterfly Network, Inc. |
| Sector: Health Care | |
| SubSector: Medical Devices | |
| MarketCap: 461 Millions | |
| Recent Price: 0.70 Smart Investing & Trading Score: 10 | |
| Day Percent Change: -0.28% Day Change: 0.00 | |
| Week Change: -7.82% Year-to-date Change: -37.6% | |
| BFLY Links: Profile News Message Board | |
| Charts:- Daily , Weekly | |
| Add BFLY to Watchlist: View: Get Complete BFLY Trend Analysis ➞ | |
 | ADTN ADTRAN, Inc. |
| Sector: Technology | |
| SubSector: Communication Equipment | |
| MarketCap: 303.539 Millions | |
| Recent Price: 4.57 Smart Investing & Trading Score: 45 | |
| Day Percent Change: -3.79% Day Change: -0.18 | |
| Week Change: -2.56% Year-to-date Change: -37.7% | |
| ADTN Links: Profile News Message Board | |
| Charts:- Daily , Weekly | |
| Add ADTN to Watchlist: View: Get Complete ADTN Trend Analysis ➞ | |
 | EB Eventbrite, Inc. |
| Sector: Technology | |
| SubSector: Application Software | |
| MarketCap: 805.262 Millions | |
| Recent Price: 5.20 Smart Investing & Trading Score: 20 | |
| Day Percent Change: -1.14% Day Change: -0.06 | |
| Week Change: 0.58% Year-to-date Change: -37.8% | |
| EB Links: Profile News Message Board | |
| Charts:- Daily , Weekly | |
| Add EB to Watchlist: View: Get Complete EB Trend Analysis ➞ | |
 | MBUU Malibu Boats, Inc. |
| Sector: Consumer Staples | |
| SubSector: Recreational Goods, Other | |
| MarketCap: 561.059 Millions | |
| Recent Price: 33.82 Smart Investing & Trading Score: 18 | |
| Day Percent Change: -2.65% Day Change: -0.92 | |
| Week Change: -1.91% Year-to-date Change: -38.3% | |
| MBUU Links: Profile News Message Board | |
| Charts:- Daily , Weekly | |
| Add MBUU to Watchlist: View: Get Complete MBUU Trend Analysis ➞ | |
 | CMTG Claros Mortgage Trust, Inc. |
| Sector: Financials | |
| SubSector: REIT - Mortgage | |
| MarketCap: 1610 Millions | |
| Recent Price: 8.55 Smart Investing & Trading Score: 17 | |
| Day Percent Change: -1.72% Day Change: -0.15 | |
| Week Change: -4.47% Year-to-date Change: -38.4% | |
| CMTG Links: Profile News Message Board | |
| Charts:- Daily , Weekly | |
| Add CMTG to Watchlist: View: Get Complete CMTG Trend Analysis ➞ | |
 | OPRX OptimizeRx Corporation |
| Sector: Technology | |
| SubSector: Healthcare Information Services | |
| MarketCap: 107.155 Millions | |
| Recent Price: 8.79 Smart Investing & Trading Score: 10 | |
| Day Percent Change: -3.98% Day Change: -0.37 | |
| Week Change: -5.43% Year-to-date Change: -38.5% | |
| OPRX Links: Profile News Message Board | |
| Charts:- Daily , Weekly | |
| Add OPRX to Watchlist: View: Get Complete OPRX Trend Analysis ➞ | |
 | EGHT 8x8, Inc. |
| Sector: Technology | |
| SubSector: Diversified Communication Services | |
| MarketCap: 1861.64 Millions | |
| Recent Price: 2.32 Smart Investing & Trading Score: 47 | |
| Day Percent Change: -2.11% Day Change: -0.05 | |
| Week Change: 6.42% Year-to-date Change: -38.6% | |
| EGHT Links: Profile News Message Board | |
| Charts:- Daily , Weekly | |
| Add EGHT to Watchlist: View: Get Complete EGHT Trend Analysis ➞ | |
 | GWH ESS Tech, Inc. |
| Sector: Industrials | |
| SubSector: Electrical Equipment & Parts | |
| MarketCap: 239 Millions | |
| Recent Price: 0.70 Smart Investing & Trading Score: 49 | |
| Day Percent Change: -1.21% Day Change: -0.01 | |
| Week Change: 1.49% Year-to-date Change: -38.7% | |
| GWH Links: Profile News Message Board | |
| Charts:- Daily , Weekly | |
| Add GWH to Watchlist: View: Get Complete GWH Trend Analysis ➞ | |
 | CTKB Cytek Biosciences, Inc. |
| Sector: Health Care | |
| SubSector: Medical Devices | |
| MarketCap: 1140 Millions | |
| Recent Price: 5.63 Smart Investing & Trading Score: 0 | |
| Day Percent Change: -1.31% Day Change: -0.08 | |
| Week Change: -4.9% Year-to-date Change: -38.8% | |
| CTKB Links: Profile News Message Board | |
| Charts:- Daily , Weekly | |
| Add CTKB to Watchlist: View: Get Complete CTKB Trend Analysis ➞ | |
 | KLTR Kaltura, Inc. |
| Sector: Technology | |
| SubSector: Software - Application | |
| MarketCap: 293 Millions | |
| Recent Price: 1.20 Smart Investing & Trading Score: 35 | |
| Day Percent Change: -4.00% Day Change: -0.05 | |
| Week Change: 0% Year-to-date Change: -38.8% | |
| KLTR Links: Profile News Message Board | |
| Charts:- Daily , Weekly | |
| Add KLTR to Watchlist: View: Get Complete KLTR Trend Analysis ➞ | |
 | HPP Hudson Pacific Properties, Inc. |
| Sector: Financials | |
| SubSector: REIT - Office | |
| MarketCap: 3267.16 Millions | |
| Recent Price: 5.68 Smart Investing & Trading Score: 20 | |
| Day Percent Change: -4.54% Day Change: -0.27 | |
| Week Change: -4.22% Year-to-date Change: -39.0% | |
| HPP Links: Profile News Message Board | |
| Charts:- Daily , Weekly | |
| Add HPP to Watchlist: View: Get Complete HPP Trend Analysis ➞ | |
 | RCEL Avita Medical Limited |
| Sector: Health Care | |
| SubSector: Medical Appliances & Equipment | |
| MarketCap: 481.18 Millions | |
| Recent Price: 8.35 Smart Investing & Trading Score: 25 | |
| Day Percent Change: -2.57% Day Change: -0.22 | |
| Week Change: -3.36% Year-to-date Change: -39.1% | |
| RCEL Links: Profile News Message Board | |
| Charts:- Daily , Weekly | |
| Add RCEL to Watchlist: View: Get Complete RCEL Trend Analysis ➞ | |
 | LVWR LiveWire Group, Inc. |
| Sector: Services & Goods | |
| SubSector: Auto Manufacturers | |
| MarketCap: 2400 Millions | |
| Recent Price: 7.08 Smart Investing & Trading Score: 25 | |
| Day Percent Change: 4.12% Day Change: 0.28 | |
| Week Change: -6.35% Year-to-date Change: -39.2% | |
| LVWR Links: Profile News Message Board | |
| Charts:- Daily , Weekly | |
| Add LVWR to Watchlist: View: Get Complete LVWR Trend Analysis ➞ | |
 | CHGG Chegg, Inc. |
| Sector: Services & Goods | |
| SubSector: Education & Training Services | |
| MarketCap: 3606.86 Millions | |
| Recent Price: 6.88 Smart Investing & Trading Score: 10 | |
| Day Percent Change: 1.03% Day Change: 0.07 | |
| Week Change: -2.96% Year-to-date Change: -39.4% | |
| CHGG Links: Profile News Message Board | |
| Charts:- Daily , Weekly | |
| Add CHGG to Watchlist: View: Get Complete CHGG Trend Analysis ➞ | |
 | HCAT Health Catalyst, Inc. |
| Sector: Technology | |
| SubSector: Healthcare Information Services | |
| MarketCap: 983.955 Millions | |
| Recent Price: 5.60 Smart Investing & Trading Score: 27 | |
| Day Percent Change: -7.13% Day Change: -0.43 | |
| Week Change: 0.36% Year-to-date Change: -39.5% | |
| HCAT Links: Profile News Message Board | |
| Charts:- Daily , Weekly | |
| Add HCAT to Watchlist: View: Get Complete HCAT Trend Analysis ➞ | |
 | ALEC Alector, Inc. |
| Sector: Health Care | |
| SubSector: Biotechnology | |
| MarketCap: 2719.35 Millions | |
| Recent Price: 4.82 Smart Investing & Trading Score: 10 | |
| Day Percent Change: -8.29% Day Change: -0.43 | |
| Week Change: -5.59% Year-to-date Change: -39.7% | |
| ALEC Links: Profile News Message Board | |
| Charts:- Daily , Weekly | |
| Add ALEC to Watchlist: View: Get Complete ALEC Trend Analysis ➞ | |
 | PSTX Poseida Therapeutics, Inc. |
| Sector: Health Care | |
| SubSector: Biotechnology | |
| MarketCap: 64487 Millions | |
| Recent Price: 2.03 Smart Investing & Trading Score: 25 | |
| Day Percent Change: -1.69% Day Change: -0.04 | |
| Week Change: -0.98% Year-to-date Change: -39.7% | |
| PSTX Links: Profile News Message Board | |
| Charts:- Daily , Weekly | |
| Add PSTX to Watchlist: View: Get Complete PSTX Trend Analysis ➞ | |
 | BBIO BridgeBio Pharma, Inc. |
| Sector: Health Care | |
| SubSector: Biotechnology | |
| MarketCap: 3879.35 Millions | |
| Recent Price: 24.35 Smart Investing & Trading Score: 20 | |
| Day Percent Change: -2.72% Day Change: -0.68 | |
| Week Change: -1.58% Year-to-date Change: -39.7% | |
| BBIO Links: Profile News Message Board | |
| Charts:- Daily , Weekly | |
| Add BBIO to Watchlist: View: Get Complete BBIO Trend Analysis ➞ | |
 | AMCX AMC Networks Inc. |
| Sector: Services & Goods | |
| SubSector: Entertainment - Diversified | |
| MarketCap: 1477.37 Millions | |
| Recent Price: 11.33 Smart Investing & Trading Score: 42 | |
| Day Percent Change: -1.48% Day Change: -0.17 | |
| Week Change: 3.75% Year-to-date Change: -39.7% | |
| AMCX Links: Profile News Message Board | |
| Charts:- Daily , Weekly | |
| Add AMCX to Watchlist: View: Get Complete AMCX Trend Analysis ➞ | |
 | SFIX Stitch Fix, Inc. |
| Sector: Services & Goods | |
| SubSector: Specialty Retail, Other | |
| MarketCap: 1693.64 Millions | |
| Recent Price: 2.15 Smart Investing & Trading Score: 22 | |
| Day Percent Change: -4.44% Day Change: -0.10 | |
| Week Change: 0.7% Year-to-date Change: -39.8% | |
| SFIX Links: Profile News Message Board | |
| Charts:- Daily , Weekly | |
| Add SFIX to Watchlist: View: Get Complete SFIX Trend Analysis ➞ | |
 | COUR Coursera, Inc. |
| Sector: Consumer Staples | |
| SubSector: Education & Training Services | |
| MarketCap: 1990 Millions | |
| Recent Price: 11.75 Smart Investing & Trading Score: 28 | |
| Day Percent Change: -2.33% Day Change: -0.28 | |
| Week Change: -1.67% Year-to-date Change: -40.3% | |
| COUR Links: Profile News Message Board | |
| Charts:- Daily , Weekly | |
| Add COUR to Watchlist: View: Get Complete COUR Trend Analysis ➞ | |
 | MKTW MarketWise, Inc. |
| Sector: Technology | |
| SubSector: Software - Application | |
| MarketCap: 646 Millions | |
| Recent Price: 1.61 Smart Investing & Trading Score: 52 | |
| Day Percent Change: -3.59% Day Change: -0.06 | |
| Week Change: -1.83% Year-to-date Change: -40.4% | |
| MKTW Links: Profile News Message Board | |
| Charts:- Daily , Weekly | |
| Add MKTW to Watchlist: View: Get Complete MKTW Trend Analysis ➞ | |
 | DMRC Digimarc Corporation |
| Sector: Technology | |
| SubSector: Information Technology Services | |
| MarketCap: 222.268 Millions | |
| Recent Price: 21.52 Smart Investing & Trading Score: 28 | |
| Day Percent Change: -3.19% Day Change: -0.71 | |
| Week Change: -4.74% Year-to-date Change: -40.4% | |
| DMRC Links: Profile News Message Board | |
| Charts:- Daily , Weekly | |
| Add DMRC to Watchlist: View: Get Complete DMRC Trend Analysis ➞ | |
 | NEOG Neogen Corporation |
| Sector: Health Care | |
| SubSector: Diagnostic Substances | |
| MarketCap: 3234.71 Millions | |
| Recent Price: 11.96 Smart Investing & Trading Score: 35 | |
| Day Percent Change: -3.31% Day Change: -0.41 | |
| Week Change: 3.01% Year-to-date Change: -40.5% | |
| NEOG Links: Profile News Message Board | |
| Charts:- Daily , Weekly | |
| Add NEOG to Watchlist: View: Get Complete NEOG Trend Analysis ➞ | |
| Too many stocks? View smallcap stocks filtered by marketcap & sector |
| Marketcap: All SmallCap Stocks (default-no microcap), Large, Mid-Range, Small & MicroCap |
| Sector: Tech, Finance, Energy, Staples, Retail, Industrial, Materials, Utilities & Medical |
|
Best Stocks Today 12Stocks.com |
© 2024 12Stocks.com Terms & Conditions Privacy Contact Us
All Information Provided Only For Education And Not To Be Used For Investing or Trading. See Terms & Conditions


One More Thing ... Get Best Stocks Delivered Daily!
Never Ever Miss A Move With Our Top Ten Stocks Lists
Find Best Stocks In Any Market - Bull or Bear Market
Take A Peek At Our Top Ten Stocks Lists: Daily, Weekly, Year-to-Date & Top Trends
Find Best Stocks In Any Market - Bull or Bear Market
Take A Peek At Our Top Ten Stocks Lists: Daily, Weekly, Year-to-Date & Top Trends
Smallcap Stocks With Best Up Trends [0-bearish to 100-bullish]: B. Riley[100], Central Pacific[100], California Water[100], Cricut [100], Carpenter [100], Haemonetics [100], Sanmina [100], Trustmark [100], Comstock Resources[100], EchoStar [100], Mueller Industries[100]
Best Smallcap Stocks Year-to-Date:
CareMax [490.72%], Janux [338.34%], Viking [270.02%], Alpine Immune[239.52%], Longboard [218%], Super Micro[177%], Arcutis Bio[166.56%], Avidity Biosciences[159.79%], Vera [149.94%], Hippo [128.87%], Stoke [122.15%] Best Smallcap Stocks This Week:
Matterport [168.97%], B. Riley[73.54%], Impinj [33.73%], ProKidney [32.84%], Seres [32.65%], Riot Blockchain[32.64%], Ribbon [25.58%], Cullinan Oncology[22.92%], P.A.M. Transportation[22.85%], NuScale Power[21.44%], Hibbett Sports[21.03%] Best Smallcap Stocks Daily:
Impinj [28.65%], P.A.M. Transportation[17.95%], B. Riley[16.61%], Strategic Education[16.28%], OptiNose [14.56%], JELD-WEN Holding[11.54%], Sonic Automotive[10.86%], Intevac [10.54%], SiTime [8.84%], Noodles & [8.08%], ProKidney [7.75%]