
 Login Sign Up


| |||||
 |  | ||||

| 12Stocks.com Market Intelligence |
Best SmallCap Stocks
|
| In a hurry? Small Cap Stock Lists: Performance Trends Table, Stock Charts
Sort Small Cap stocks: Daily, Weekly, Year-to-Date, Market Cap & Trends. Filter Small Cap stocks list by sector: Show all, Tech, Finance, Energy, Staples, Retail, Industrial, Materials, Utilities and HealthCare Filter Small Cap stocks list by size: All Large Medium Small and MicroCap |
| 12Stocks.com Small Cap Stocks Performances & Trends Daily | |||||||||
|
|  The overall Smart Investing & Trading Score is 63 (0-bearish to 100-bullish) which puts Small Cap index in short term neutral to bullish trend. The Smart Investing & Trading Score from previous trading session is 58 and hence an improvement of trend.
| ||||||||
Here are the Smart Investing & Trading Scores of the most requested small cap stocks at 12Stocks.com (click stock name for detailed review):
|


| 12Stocks.com: Investing in Smallcap Index with Stocks | |
|
The following table helps investors and traders sort through current performance and trends (as measured by Smart Investing & Trading Score) of various
stocks in the Smallcap Index. Quick View: Move mouse or cursor over stock symbol (ticker) to view short-term technical chart and over stock name to view long term chart. Click on  to add stock symbol to your watchlist and to add stock symbol to your watchlist and  to view watchlist. Click on any ticker or stock name for detailed market intelligence report for that stock. to view watchlist. Click on any ticker or stock name for detailed market intelligence report for that stock. |
12Stocks.com Performance of Stocks in Smallcap Index
| Ticker | Stock Name | Watchlist | Category | Recent Price | Smart Investing & Trading Score | Change % | YTD Change% |
| HOMB | Home Bancshares |   | Financials | 24.69 | 100 | 1.60% | -2.53% |
| ONB | Old National | | Financials | 16.46 | 93 | 0.00% | -2.55% |
| CHCT | Community Healthcare | | Financials | 25.96 | 75 | 1.01% | -2.55% |
| NJR | New Jersey | | Utilities | 43.44 | 100 | -0.21% | -2.56% |
| DRH | DiamondRock Hospitality | | Financials | 9.15 | 50 | 2.23% | -2.56% |
| CNSL | Consolidated | | Technology | 4.24 | 13 | 0.12% | -2.64% |
| MC | Moelis & | | Financials | 54.60 | 62 | 2.59% | -2.73% |
| RLJ | RLJ Lodging | | Financials | 11.40 | 47 | 1.06% | -2.73% |
| IIPR | Innovative Industrial | | Financials | 98.06 | 68 | 1.62% | -2.74% |
| JBSS | John B. | | Consumer Staples | 100.16 | 39 | 1.86% | -2.80% |
| CARG | CarGurus | | Services & Goods | 23.48 | 34 | 3.76% | -2.81% |
| MYGN | Myriad Genetics | | Services & Goods | 18.59 | 32 | 0.57% | -2.85% |
| APPN | Appian | | Technology | 36.58 | 53 | 4.16% | -2.87% |
| ACDC | ProFrac Holding | | Energy | 8.26 | 68 | 2.74% | -2.94% |
| PCVX | Vaxcyte | | Health Care | 60.89 | 17 | -1.15% | -3.00% |
| BLMN | Bloomin | | Services & Goods | 27.30 | 65 | 1.83% | -3.02% |
| NTST | NetSTREIT | | Financials | 17.32 | 44 | -0.06% | -3.02% |
| IBCP | Independent Bank | | Financials | 25.23 | 87 | 3.02% | -3.04% |
| CRVL | CorVel | | Financials | 239.69 | 65 | 1.97% | -3.04% |
| LCNB | LCNB | | Financials | 15.29 | 93 | 1.19% | -3.04% |
| SCHL | Scholastic | | Services & Goods | 36.55 | 57 | 2.64% | -3.05% |
| SNDX | Syndax | | Health Care | 20.95 | 68 | -0.05% | -3.05% |
| NBN | Northeast Bank | | Financials | 53.46 | 49 | 1.23% | -3.13% |
| EQC | Equity Commonwealth | | Financials | 18.60 | 47 | -0.05% | -3.13% |
| IVR | Invesco Mortgage | | Financials | 8.58 | 49 | 2.51% | -3.16% |


| Too many stocks? View smallcap stocks filtered by marketcap & sector |
| Marketcap: All SmallCap Stocks (default-no microcap), Large, Mid-Range, Small |
| Smallcap Sector: Tech, Finance, Energy, Staples, Retail, Industrial, Materials, & Medical |
|
Get the most comprehensive stock market coverage daily at 12Stocks.com ➞ Best Stocks Today ➞ Best Stocks Weekly ➞ Best Stocks Year-to-Date ➞ Best Stocks Trends ➞  Best Stocks Today 12Stocks.com Best Nasdaq Stocks ➞ Best S&P 500 Stocks ➞ Best Tech Stocks ➞ Best Biotech Stocks ➞ |
| Detailed Overview of SmallCap Stocks |
| SmallCap Technical Overview, Leaders & Laggards, Top SmallCap ETF Funds & Detailed SmallCap Stocks List, Charts, Trends & More |
| Smallcap: Technical Analysis, Trends & YTD Performance | |
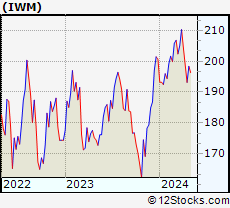
| SmallCap segment as represented by
IWM, an exchange-traded fund [ETF], holds basket of thousands of smallcap stocks from across all major sectors of the US stock market. The smallcap index (contains stocks like Riverbed & Sotheby's) is down by -1.07% and is currently underperforming the overall market by -6.71% year-to-date. Below is a quick view of technical charts and trends: | |
 IWM Weekly Chart |
|
| Long Term Trend: Good | |
| Medium Term Trend: Not Good | |
 IWM Daily Chart |
|
| Short Term Trend: Very Good | |
| Overall Trend Score: 63 | |
| YTD Performance: -1.07% | |
| **Trend Scores & Views Are Only For Educational Purposes And Not For Investing | |
| 12Stocks.com: Top Performing Small Cap Index Stocks | ||||||||||||||||||||||||||||||||||||||||||||||||
 The top performing Small Cap Index stocks year to date are
Now, more recently, over last week, the top performing Small Cap Index stocks on the move are


|
||||||||||||||||||||||||||||||||||||||||||||||||
| 12Stocks.com: Investing in Smallcap Index using Exchange Traded Funds | |
|
The following table shows list of key exchange traded funds (ETF) that
help investors track Smallcap index. The following list also includes leveraged ETF funds that track twice or thrice the daily returns of Smallcap indices. Short or inverse ETF funds move in the opposite direction to the index they track and are useful during market pullbacks or during bear markets. Quick View: Move mouse or cursor over ETF symbol (ticker) to view short-term technical chart and over ETF name to view long term chart. Click on ticker or stock name for detailed view. Click on to add stock symbol to your watchlist and to view watchlist. |
12Stocks.com List of ETFs that track Smallcap Index
| Ticker | ETF Name | Watchlist | Recent Price | Smart Investing & Trading Score | Change % | Week % | Year-to-date % |
| IWM | iShares Russell 2000 | | 198.57 | 63 | 1.67 | 2.81 | -1.07% |
| VTWO | Vanguard Russell 2000 ETF | | 80.53 | 70 | 2.04 | 3.14 | -0.7% |
| IJR | iShares Core S&P Small-Cap | | 105.44 | 75 | 1.91 | 2.16 | -2.59% |
| IJS | iShares S&P Small-Cap 600 Value | | 98.50 | 67 | 2.15 | 3.02 | -4.43% |
| IWN | iShares Russell 2000 Value | | 151.50 | 68 | 1.33 | 2.52 | -2.47% |
| IJT | iShares S&P Small-Cap 600 Growth | | 125.91 | 70 | 2.07 | 3.03 | 0.62% |
| IWO | iShares Russell 2000 Growth | | 252.16 | 58 | 1.71 | 2.8 | -0.02% |
| XSLV | PowerShares S&P SmallCap Low Volatil ETF | | 43.09 | 80 | 1.53 | 2.16 | -2.4% |
| SMLV | SPDR SSGA US Small Cap Low Volatil ETF | | 108.46 | 72 | 0.91 | 2.23 | -3.61% |
| SAA | ProShares Ultra SmallCap600 | | 23.15 | 24 | 3.49 | 6.19 | -7.21% |
| SBB | ProShares Short SmallCap600 | | 16.28 | 40 | -2.05 | -3.33 | 2.2% |
| SDD | ProShares UltraShort SmallCap600 | | 19.31 | 40 | -2.23 | -5.06 | 4.79% |
| 12Stocks.com: Charts, Trends, Fundamental Data and Performances of SmallCap Stocks | |
|
We now take in-depth look at all SmallCap stocks including charts, multi-period performances and overall trends (as measured by Smart Investing & Trading Score). One can sort SmallCap stocks (click link to choose) by Daily, Weekly and by Year-to-Date performances. Also, one can sort by size of the company or by market capitalization. |
| Select Your Default Chart Type: | |||||
| |||||
| Click on stock symbol or name for detailed view. Click on to add stock symbol to your watchlist and to view watchlist. Quick View: Move mouse or cursor over "Daily" to quickly view daily technical stock chart and over "Weekly" to view weekly technical stock chart. | |||||

 | HOMB Home Bancshares, Inc. (Conway, AR) |
| Sector: Financials | |
| SubSector: Money Center Banks | |
| MarketCap: 2090.49 Millions | |
| Recent Price: 24.69 Smart Investing & Trading Score: 100 | |
| Day Percent Change: 1.60% Day Change: 0.39 | |
| Week Change: 2.83% Year-to-date Change: -2.5% | |
| HOMB Links: Profile News Message Board | |
| Charts:- Daily , Weekly | |
| Add HOMB to Watchlist: View: Get Complete HOMB Trend Analysis ➞ | |
 | ONB Old National Bancorp |
| Sector: Financials | |
| SubSector: Regional - Midwest Banks | |
| MarketCap: 2340.8 Millions | |
| Recent Price: 16.46 Smart Investing & Trading Score: 93 | |
| Day Percent Change: 0.00% Day Change: 0.00 | |
| Week Change: 1.67% Year-to-date Change: -2.6% | |
| ONB Links: Profile News Message Board | |
| Charts:- Daily , Weekly | |
| Add ONB to Watchlist: View: Get Complete ONB Trend Analysis ➞ | |
 | CHCT Community Healthcare Trust Incorporated |
| Sector: Financials | |
| SubSector: REIT - Healthcare Facilities | |
| MarketCap: 698.614 Millions | |
| Recent Price: 25.96 Smart Investing & Trading Score: 75 | |
| Day Percent Change: 1.01% Day Change: 0.26 | |
| Week Change: 1.76% Year-to-date Change: -2.6% | |
| CHCT Links: Profile News Message Board | |
| Charts:- Daily , Weekly | |
| Add CHCT to Watchlist: View: Get Complete CHCT Trend Analysis ➞ | |
 | NJR New Jersey Resources Corporation |
| Sector: Utilities | |
| SubSector: Gas Utilities | |
| MarketCap: 3320.27 Millions | |
| Recent Price: 43.44 Smart Investing & Trading Score: 100 | |
| Day Percent Change: -0.21% Day Change: -0.09 | |
| Week Change: 0.18% Year-to-date Change: -2.6% | |
| NJR Links: Profile News Message Board | |
| Charts:- Daily , Weekly | |
| Add NJR to Watchlist: View: Get Complete NJR Trend Analysis ➞ | |
 | DRH DiamondRock Hospitality Company |
| Sector: Financials | |
| SubSector: REIT - Hotel/Motel | |
| MarketCap: 964 Millions | |
| Recent Price: 9.15 Smart Investing & Trading Score: 50 | |
| Day Percent Change: 2.23% Day Change: 0.20 | |
| Week Change: 3.62% Year-to-date Change: -2.6% | |
| DRH Links: Profile News Message Board | |
| Charts:- Daily , Weekly | |
| Add DRH to Watchlist: View: Get Complete DRH Trend Analysis ➞ | |
 | CNSL Consolidated Communications Holdings, Inc. |
| Sector: Technology | |
| SubSector: Telecom Services - Domestic | |
| MarketCap: 319.677 Millions | |
| Recent Price: 4.24 Smart Investing & Trading Score: 13 | |
| Day Percent Change: 0.12% Day Change: 0.00 | |
| Week Change: -0.82% Year-to-date Change: -2.6% | |
| CNSL Links: Profile News Message Board | |
| Charts:- Daily , Weekly | |
| Add CNSL to Watchlist: View: Get Complete CNSL Trend Analysis ➞ | |
 | MC Moelis & Company |
| Sector: Financials | |
| SubSector: Asset Management | |
| MarketCap: 1675.93 Millions | |
| Recent Price: 54.60 Smart Investing & Trading Score: 62 | |
| Day Percent Change: 2.59% Day Change: 1.38 | |
| Week Change: 5.71% Year-to-date Change: -2.7% | |
| MC Links: Profile News Message Board | |
| Charts:- Daily , Weekly | |
| Add MC to Watchlist: View: Get Complete MC Trend Analysis ➞ | |
 | RLJ RLJ Lodging Trust |
| Sector: Financials | |
| SubSector: REIT - Hotel/Motel | |
| MarketCap: 1019.34 Millions | |
| Recent Price: 11.40 Smart Investing & Trading Score: 47 | |
| Day Percent Change: 1.06% Day Change: 0.12 | |
| Week Change: 3.26% Year-to-date Change: -2.7% | |
| RLJ Links: Profile News Message Board | |
| Charts:- Daily , Weekly | |
| Add RLJ to Watchlist: View: Get Complete RLJ Trend Analysis ➞ | |
 | IIPR Innovative Industrial Properties, Inc. |
| Sector: Financials | |
| SubSector: REIT - Industrial | |
| MarketCap: 1193.29 Millions | |
| Recent Price: 98.06 Smart Investing & Trading Score: 68 | |
| Day Percent Change: 1.62% Day Change: 1.56 | |
| Week Change: 4.06% Year-to-date Change: -2.7% | |
| IIPR Links: Profile News Message Board | |
| Charts:- Daily , Weekly | |
| Add IIPR to Watchlist: View: Get Complete IIPR Trend Analysis ➞ | |
 | JBSS John B. Sanfilippo & Son, Inc. |
| Sector: Consumer Staples | |
| SubSector: Processed & Packaged Goods | |
| MarketCap: 899.748 Millions | |
| Recent Price: 100.16 Smart Investing & Trading Score: 39 | |
| Day Percent Change: 1.86% Day Change: 1.83 | |
| Week Change: 2.03% Year-to-date Change: -2.8% | |
| JBSS Links: Profile News Message Board | |
| Charts:- Daily , Weekly | |
| Add JBSS to Watchlist: View: Get Complete JBSS Trend Analysis ➞ | |
 | CARG CarGurus, Inc. |
| Sector: Services & Goods | |
| SubSector: Auto Dealerships | |
| MarketCap: 2099.31 Millions | |
| Recent Price: 23.48 Smart Investing & Trading Score: 34 | |
| Day Percent Change: 3.76% Day Change: 0.85 | |
| Week Change: 5.74% Year-to-date Change: -2.8% | |
| CARG Links: Profile News Message Board | |
| Charts:- Daily , Weekly | |
| Add CARG to Watchlist: View: Get Complete CARG Trend Analysis ➞ | |
 | MYGN Myriad Genetics, Inc. |
| Sector: Services & Goods | |
| SubSector: Research Services | |
| MarketCap: 1051.94 Millions | |
| Recent Price: 18.59 Smart Investing & Trading Score: 32 | |
| Day Percent Change: 0.57% Day Change: 0.11 | |
| Week Change: 0.51% Year-to-date Change: -2.9% | |
| MYGN Links: Profile News Message Board | |
| Charts:- Daily , Weekly | |
| Add MYGN to Watchlist: View: Get Complete MYGN Trend Analysis ➞ | |
 | APPN Appian Corporation |
| Sector: Technology | |
| SubSector: Application Software | |
| MarketCap: 2737.92 Millions | |
| Recent Price: 36.58 Smart Investing & Trading Score: 53 | |
| Day Percent Change: 4.16% Day Change: 1.46 | |
| Week Change: 5.75% Year-to-date Change: -2.9% | |
| APPN Links: Profile News Message Board | |
| Charts:- Daily , Weekly | |
| Add APPN to Watchlist: View: Get Complete APPN Trend Analysis ➞ | |
 | ACDC ProFrac Holding Corp. |
| Sector: Energy | |
| SubSector: Oil & Gas Equipment & Services | |
| MarketCap: 1830 Millions | |
| Recent Price: 8.26 Smart Investing & Trading Score: 68 | |
| Day Percent Change: 2.74% Day Change: 0.22 | |
| Week Change: 1.85% Year-to-date Change: -2.9% | |
| ACDC Links: Profile News Message Board | |
| Charts:- Daily , Weekly | |
| Add ACDC to Watchlist: View: Get Complete ACDC Trend Analysis ➞ | |
 | PCVX Vaxcyte, Inc. |
| Sector: Health Care | |
| SubSector: Biotechnology | |
| MarketCap: 13887 Millions | |
| Recent Price: 60.89 Smart Investing & Trading Score: 17 | |
| Day Percent Change: -1.15% Day Change: -0.71 | |
| Week Change: 0.3% Year-to-date Change: -3.0% | |
| PCVX Links: Profile News Message Board | |
| Charts:- Daily , Weekly | |
| Add PCVX to Watchlist: View: Get Complete PCVX Trend Analysis ➞ | |
 | BLMN Bloomin Brands, Inc. |
| Sector: Services & Goods | |
| SubSector: Restaurants | |
| MarketCap: 503.47 Millions | |
| Recent Price: 27.30 Smart Investing & Trading Score: 65 | |
| Day Percent Change: 1.83% Day Change: 0.49 | |
| Week Change: 0.96% Year-to-date Change: -3.0% | |
| BLMN Links: Profile News Message Board | |
| Charts:- Daily , Weekly | |
| Add BLMN to Watchlist: View: Get Complete BLMN Trend Analysis ➞ | |
 | NTST NetSTREIT Corp. |
| Sector: Financials | |
| SubSector: REIT Retail | |
| MarketCap: 51267 Millions | |
| Recent Price: 17.32 Smart Investing & Trading Score: 44 | |
| Day Percent Change: -0.06% Day Change: -0.01 | |
| Week Change: 3.68% Year-to-date Change: -3.0% | |
| NTST Links: Profile News Message Board | |
| Charts:- Daily , Weekly | |
| Add NTST to Watchlist: View: Get Complete NTST Trend Analysis ➞ | |
 | IBCP Independent Bank Corporation |
| Sector: Financials | |
| SubSector: Regional - Midwest Banks | |
| MarketCap: 273.67 Millions | |
| Recent Price: 25.23 Smart Investing & Trading Score: 87 | |
| Day Percent Change: 3.02% Day Change: 0.74 | |
| Week Change: 3.57% Year-to-date Change: -3.0% | |
| IBCP Links: Profile News Message Board | |
| Charts:- Daily , Weekly | |
| Add IBCP to Watchlist: View: Get Complete IBCP Trend Analysis ➞ | |
 | CRVL CorVel Corporation |
| Sector: Financials | |
| SubSector: Insurance Brokers | |
| MarketCap: 1090.67 Millions | |
| Recent Price: 239.69 Smart Investing & Trading Score: 65 | |
| Day Percent Change: 1.97% Day Change: 4.63 | |
| Week Change: 2.27% Year-to-date Change: -3.0% | |
| CRVL Links: Profile News Message Board | |
| Charts:- Daily , Weekly | |
| Add CRVL to Watchlist: View: Get Complete CRVL Trend Analysis ➞ | |
 | LCNB LCNB Corp. |
| Sector: Financials | |
| SubSector: Regional - Mid-Atlantic Banks | |
| MarketCap: 176.759 Millions | |
| Recent Price: 15.29 Smart Investing & Trading Score: 93 | |
| Day Percent Change: 1.19% Day Change: 0.18 | |
| Week Change: 2.14% Year-to-date Change: -3.0% | |
| LCNB Links: Profile News Message Board | |
| Charts:- Daily , Weekly | |
| Add LCNB to Watchlist: View: Get Complete LCNB Trend Analysis ➞ | |
 | SCHL Scholastic Corporation |
| Sector: Services & Goods | |
| SubSector: Publishing - Books | |
| MarketCap: 791 Millions | |
| Recent Price: 36.55 Smart Investing & Trading Score: 57 | |
| Day Percent Change: 2.64% Day Change: 0.94 | |
| Week Change: 2.44% Year-to-date Change: -3.1% | |
| SCHL Links: Profile News Message Board | |
| Charts:- Daily , Weekly | |
| Add SCHL to Watchlist: View: Get Complete SCHL Trend Analysis ➞ | |
 | SNDX Syndax Pharmaceuticals, Inc. |
| Sector: Health Care | |
| SubSector: Biotechnology | |
| MarketCap: 365.985 Millions | |
| Recent Price: 20.95 Smart Investing & Trading Score: 68 | |
| Day Percent Change: -0.05% Day Change: -0.01 | |
| Week Change: 0.72% Year-to-date Change: -3.1% | |
| SNDX Links: Profile News Message Board | |
| Charts:- Daily , Weekly | |
| Add SNDX to Watchlist: View: Get Complete SNDX Trend Analysis ➞ | |
 | NBN Northeast Bank |
| Sector: Financials | |
| SubSector: Regional - Northeast Banks | |
| MarketCap: 114.199 Millions | |
| Recent Price: 53.46 Smart Investing & Trading Score: 49 | |
| Day Percent Change: 1.23% Day Change: 0.65 | |
| Week Change: 1.19% Year-to-date Change: -3.1% | |
| NBN Links: Profile News Message Board | |
| Charts:- Daily , Weekly | |
| Add NBN to Watchlist: View: Get Complete NBN Trend Analysis ➞ | |
 | EQC Equity Commonwealth |
| Sector: Financials | |
| SubSector: REIT - Office | |
| MarketCap: 3659.36 Millions | |
| Recent Price: 18.60 Smart Investing & Trading Score: 47 | |
| Day Percent Change: -0.05% Day Change: -0.01 | |
| Week Change: -0.43% Year-to-date Change: -3.1% | |
| EQC Links: Profile News Message Board | |
| Charts:- Daily , Weekly | |
| Add EQC to Watchlist: View: Get Complete EQC Trend Analysis ➞ | |
 | IVR Invesco Mortgage Capital Inc. |
| Sector: Financials | |
| SubSector: Mortgage Investment | |
| MarketCap: 1182.19 Millions | |
| Recent Price: 8.58 Smart Investing & Trading Score: 49 | |
| Day Percent Change: 2.51% Day Change: 0.21 | |
| Week Change: 4% Year-to-date Change: -3.2% | |
| IVR Links: Profile News Message Board | |
| Charts:- Daily , Weekly | |
| Add IVR to Watchlist: View: Get Complete IVR Trend Analysis ➞ | |
| Too many stocks? View smallcap stocks filtered by marketcap & sector |
| Marketcap: All SmallCap Stocks (default-no microcap), Large, Mid-Range, Small & MicroCap |
| Sector: Tech, Finance, Energy, Staples, Retail, Industrial, Materials, Utilities & Medical |
|
Best Stocks Today 12Stocks.com |
© 2024 12Stocks.com Terms & Conditions Privacy Contact Us
All Information Provided Only For Education And Not To Be Used For Investing or Trading. See Terms & Conditions


One More Thing ... Get Best Stocks Delivered Daily!
Never Ever Miss A Move With Our Top Ten Stocks Lists
Find Best Stocks In Any Market - Bull or Bear Market
Take A Peek At Our Top Ten Stocks Lists: Daily, Weekly, Year-to-Date & Top Trends
Find Best Stocks In Any Market - Bull or Bear Market
Take A Peek At Our Top Ten Stocks Lists: Daily, Weekly, Year-to-Date & Top Trends
Smallcap Stocks With Best Up Trends [0-bearish to 100-bullish]: Hibbett Sports[100], AZZ [100], Day One[100], BioLife Solutions[100], Oscar Health[100], Mueller Industries[100], Gannett Co[100], Dillard s[100], Riot Blockchain[100], Agios [100], Brookdale Senior[100]
Best Smallcap Stocks Year-to-Date:
Janux [364.03%], Viking [258.89%], Alpine Immune[238.94%], Longboard [231.75%], Avidity Biosciences[177.88%], Arcutis Bio[170.43%], Super Micro[168.16%], Vera [154.91%], Hippo [134.14%], Y-mAbs [125.37%], Stoke [113.69%] Best Smallcap Stocks This Week:
Matterport [164.37%], Seres [36.26%], Riot Blockchain[29.74%], Cipher Mining[25%], ProKidney [24.75%], Braemar Hotels[21.3%], Akoustis [21.27%], Hibbett Sports[21.1%], Assertio [19.02%], Generation Bio[18.05%], BigBear.ai [17.93%] Best Smallcap Stocks Daily:
Virgin Galactic[22.38%], Seres [22.14%], Hibbett Sports[18.84%], Marathon Patent[18.12%], Generation Bio[16.37%], IGM Biosciences[14.52%], Braemar Hotels[12.96%], SES AI[12.17%], NuScale Power[11.16%], FuelCell Energy[10.86%], Cutera [10.82%]