
 Login Sign Up


| |||||
 |  | ||||

| 12Stocks.com Market Intelligence |
Best SmallCap Stocks
|
| In a hurry? Small Cap Stock Lists: Performance Trends Table, Stock Charts
Sort Small Cap stocks: Daily, Weekly, Year-to-Date, Market Cap & Trends. Filter Small Cap stocks list by sector: Show all, Tech, Finance, Energy, Staples, Retail, Industrial, Materials, Utilities and HealthCare Filter Small Cap stocks list by size: All Large Medium Small and MicroCap |
| 12Stocks.com Small Cap Stocks Performances & Trends Daily | |||||||||
|
|  The overall Smart Investing & Trading Score is 58 (0-bearish to 100-bullish) which puts Small Cap index in short term neutral trend. The Smart Investing & Trading Score from previous trading session is 63 and hence a deterioration of trend.
| ||||||||
Here are the Smart Investing & Trading Scores of the most requested small cap stocks at 12Stocks.com (click stock name for detailed review):
|


| 12Stocks.com: Investing in Smallcap Index with Stocks | |
|
The following table helps investors and traders sort through current performance and trends (as measured by Smart Investing & Trading Score) of various
stocks in the Smallcap Index. Quick View: Move mouse or cursor over stock symbol (ticker) to view short-term technical chart and over stock name to view long term chart. Click on  to add stock symbol to your watchlist and to add stock symbol to your watchlist and  to view watchlist. Click on any ticker or stock name for detailed market intelligence report for that stock. to view watchlist. Click on any ticker or stock name for detailed market intelligence report for that stock. |
12Stocks.com Performance of Stocks in Smallcap Index
| Ticker | Stock Name | Watchlist | Category | Recent Price | Smart Investing & Trading Score | Change % | YTD Change% |
| CLNE | Clean Energy |   | Utilities | 2.25 | 52 | -2.60% | -41.25% |
| LVWR | LiveWire Group | | Services & Goods | 6.80 | 25 | -2.86% | -41.58% |
| DZSI | DASAN Zhone | | Technology | 1.15 | 42 | -4.17% | -41.62% |
| CUTR | Cutera | | Health Care | 2.06 | 52 | -4.42% | -41.70% |
| OPFI | OppFi | | Financials | 2.96 | 45 | -2.80% | -42.17% |
| GNE | Genie Energy | | Energy | 16.13 | 57 | -1.38% | -42.68% |
| CMBM | Cambium s | | Technology | 3.42 | 35 | -1.59% | -43.08% |
| QTRX | Quanterix | | Health Care | 15.55 | 10 | -3.45% | -43.14% |
| upst | Upstart | | Financials | 22.98 | 42 | 0.09% | -43.27% |
| ONL | Orion Office | | Financials | 3.24 | 67 | -0.92% | -43.36% |
| FOSL | Fossil Group | | Consumer Staples | 0.82 | 27 | -1.61% | -43.63% |
| EMBC | Embecta | | Health Care | 10.77 | 52 | -1.10% | -43.63% |
| PRTA | Prothena | | Health Care | 20.43 | 20 | -0.63% | -43.78% |
| HAIN | Hain Celestial | | Consumer Staples | 6.13 | 42 | -0.73% | -43.97% |
| AUPH | Aurinia | | Health Care | 5.02 | 32 | -1.38% | -44.16% |
| PMVP | PMV | | Health Care | 1.73 | 59 | -4.43% | -44.35% |
| CUE | Cue Biopharma | | Health Care | 1.46 | 0 | -2.67% | -44.70% |
| PLSE | Pulse Biosciences | | Health Care | 6.71 | 0 | -2.11% | -45.14% |
| PETS | PetMed Express | | Health Care | 4.14 | 45 | -0.24% | -45.24% |
| ALTI | AlTi Global | | Financials | 4.96 | 57 | 0.10% | -45.26% |
| FRGE | Forge Global | | Technology | 1.94 | 80 | -1.52% | -45.66% |
| FCEL | FuelCell Energy | | Industrials | 0.87 | 27 | -5.39% | -45.67% |
| DDD | 3D Systems | | Technology | 3.45 | 20 | -1.43% | -45.67% |
| SHLS | Shoals | | Technology | 8.41 | 25 | -0.41% | -45.71% |
| ME | 23andMe Holding | | Health Care | 0.48 | 40 | -2.69% | -45.96% |
| For chart view version of above stock list: Chart View ➞ 0 - 25 , 25 - 50 , 50 - 75 , 75 - 100 , 100 - 125 , 125 - 150 , 150 - 175 , 175 - 200 , 200 - 225 , 225 - 250 , 250 - 275 , 275 - 300 , 300 - 325 , 325 - 350 , 350 - 375 , 375 - 400 , 400 - 425 , 425 - 450 , 450 - 475 , 475 - 500 , 500 - 525 , 525 - 550 , 550 - 575 , 575 - 600 , 600 - 625 , 625 - 650 , 650 - 675 , 675 - 700 , 700 - 725 , 725 - 750 , 750 - 775 , 775 - 800 , 800 - 825 , 825 - 850 , 850 - 875 , 875 - 900 , 900 - 925 , 925 - 950 , 950 - 975 , 975 - 1000 , 1000 - 1025 , 1025 - 1050 , 1050 - 1075 , 1075 - 1100 , 1100 - 1125 , 1125 - 1150 , 1150 - 1175 , 1175 - 1200 , 1200 - 1225 , 1225 - 1250 , 1250 - 1275 , 1275 - 1300 , 1300 - 1325 , 1325 - 1350 , 1350 - 1375 , 1375 - 1400 , 1400 - 1425 , 1425 - 1450 , 1450 - 1475 , 1475 - 1500 , 1500 - 1525 , 1525 - 1550 , 1550 - 1575 | ||
 | Click To Change The Sort Order: By Market Cap or Company Size Performance: Year-to-date, Week and Day |  |
| Too many stocks? View smallcap stocks filtered by marketcap & sector |
| Marketcap: All SmallCap Stocks (default-no microcap), Large, Mid-Range, Small |
| Smallcap Sector: Tech, Finance, Energy, Staples, Retail, Industrial, Materials, & Medical |
|
Get the most comprehensive stock market coverage daily at 12Stocks.com ➞ Best Stocks Today ➞ Best Stocks Weekly ➞ Best Stocks Year-to-Date ➞ Best Stocks Trends ➞  Best Stocks Today 12Stocks.com Best Nasdaq Stocks ➞ Best S&P 500 Stocks ➞ Best Tech Stocks ➞ Best Biotech Stocks ➞ |
| Detailed Overview of SmallCap Stocks |
| SmallCap Technical Overview, Leaders & Laggards, Top SmallCap ETF Funds & Detailed SmallCap Stocks List, Charts, Trends & More |
| Smallcap: Technical Analysis, Trends & YTD Performance | |
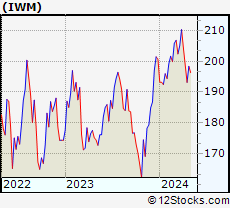
| SmallCap segment as represented by
IWM, an exchange-traded fund [ETF], holds basket of thousands of smallcap stocks from across all major sectors of the US stock market. The smallcap index (contains stocks like Riverbed & Sotheby's) is down by -1.75% and is currently underperforming the overall market by -7.09% year-to-date. Below is a quick view of technical charts and trends: | |
 IWM Weekly Chart |
|
| Long Term Trend: Good | |
| Medium Term Trend: Not Good | |
 IWM Daily Chart |
|
| Short Term Trend: Very Good | |
| Overall Trend Score: 58 | |
| YTD Performance: -1.75% | |
| **Trend Scores & Views Are Only For Educational Purposes And Not For Investing | |
| 12Stocks.com: Top Performing Small Cap Index Stocks | ||||||||||||||||||||||||||||||||||||||||||||||||
 The top performing Small Cap Index stocks year to date are
Now, more recently, over last week, the top performing Small Cap Index stocks on the move are


|
||||||||||||||||||||||||||||||||||||||||||||||||
| 12Stocks.com: Investing in Smallcap Index using Exchange Traded Funds | |
|
The following table shows list of key exchange traded funds (ETF) that
help investors track Smallcap index. The following list also includes leveraged ETF funds that track twice or thrice the daily returns of Smallcap indices. Short or inverse ETF funds move in the opposite direction to the index they track and are useful during market pullbacks or during bear markets. Quick View: Move mouse or cursor over ETF symbol (ticker) to view short-term technical chart and over ETF name to view long term chart. Click on ticker or stock name for detailed view. Click on to add stock symbol to your watchlist and to view watchlist. |
12Stocks.com List of ETFs that track Smallcap Index
| Ticker | ETF Name | Watchlist | Recent Price | Smart Investing & Trading Score | Change % | Week % | Year-to-date % |
| IWM | iShares Russell 2000 | | 197.19 | 58 | -0.69 | 2.1 | -1.75% |
| IJR | iShares Core S&P Small-Cap | | 105.72 | 85 | -0.23 | 2.42 | -2.34% |
| IWN | iShares Russell 2000 Value | | 151.29 | 75 | -0.30 | 2.38 | -2.6% |
| IWO | iShares Russell 2000 Growth | | 252.75 | 58 | 0.15 | 3.04 | 0.21% |
| 12Stocks.com: Charts, Trends, Fundamental Data and Performances of SmallCap Stocks | |
|
We now take in-depth look at all SmallCap stocks including charts, multi-period performances and overall trends (as measured by Smart Investing & Trading Score). One can sort SmallCap stocks (click link to choose) by Daily, Weekly and by Year-to-Date performances. Also, one can sort by size of the company or by market capitalization. |
| Select Your Default Chart Type: | |||||
| |||||
| Click on stock symbol or name for detailed view. Click on to add stock symbol to your watchlist and to view watchlist. Quick View: Move mouse or cursor over "Daily" to quickly view daily technical stock chart and over "Weekly" to view weekly technical stock chart. | |||||

 | CLNE Clean Energy Fuels Corp. |
| Sector: Utilities | |
| SubSector: Gas Utilities | |
| MarketCap: 371.977 Millions | |
| Recent Price: 2.25 Smart Investing & Trading Score: 52 | |
| Day Percent Change: -2.60% Day Change: -0.06 | |
| Week Change: 1.35% Year-to-date Change: -41.3% | |
| CLNE Links: Profile News Message Board | |
| Charts:- Daily , Weekly | |
| Add CLNE to Watchlist: View: Get Complete CLNE Trend Analysis ➞ | |
 | LVWR LiveWire Group, Inc. |
| Sector: Services & Goods | |
| SubSector: Auto Manufacturers | |
| MarketCap: 2400 Millions | |
| Recent Price: 6.80 Smart Investing & Trading Score: 25 | |
| Day Percent Change: -2.86% Day Change: -0.20 | |
| Week Change: -10.05% Year-to-date Change: -41.6% | |
| LVWR Links: Profile News Message Board | |
| Charts:- Daily , Weekly | |
| Add LVWR to Watchlist: View: Get Complete LVWR Trend Analysis ➞ | |
 | DZSI DASAN Zhone Solutions, Inc. |
| Sector: Technology | |
| SubSector: Communication Equipment | |
| MarketCap: 90.0539 Millions | |
| Recent Price: 1.15 Smart Investing & Trading Score: 42 | |
| Day Percent Change: -4.17% Day Change: -0.05 | |
| Week Change: -1.71% Year-to-date Change: -41.6% | |
| DZSI Links: Profile News Message Board | |
| Charts:- Daily , Weekly | |
| Add DZSI to Watchlist: View: Get Complete DZSI Trend Analysis ➞ | |
 | CUTR Cutera, Inc. |
| Sector: Health Care | |
| SubSector: Medical Appliances & Equipment | |
| MarketCap: 143.68 Millions | |
| Recent Price: 2.06 Smart Investing & Trading Score: 52 | |
| Day Percent Change: -4.42% Day Change: -0.09 | |
| Week Change: 5.38% Year-to-date Change: -41.7% | |
| CUTR Links: Profile News Message Board | |
| Charts:- Daily , Weekly | |
| Add CUTR to Watchlist: View: Get Complete CUTR Trend Analysis ➞ | |
 | OPFI OppFi Inc. |
| Sector: Financials | |
| SubSector: Credit Services | |
| MarketCap: 226 Millions | |
| Recent Price: 2.96 Smart Investing & Trading Score: 45 | |
| Day Percent Change: -2.80% Day Change: -0.08 | |
| Week Change: -1.17% Year-to-date Change: -42.2% | |
| OPFI Links: Profile News Message Board | |
| Charts:- Daily , Weekly | |
| Add OPFI to Watchlist: View: Get Complete OPFI Trend Analysis ➞ | |
 | GNE Genie Energy Ltd. |
| Sector: Energy | |
| SubSector: Independent Oil & Gas | |
| MarketCap: 177.293 Millions | |
| Recent Price: 16.13 Smart Investing & Trading Score: 57 | |
| Day Percent Change: -1.38% Day Change: -0.23 | |
| Week Change: 1.42% Year-to-date Change: -42.7% | |
| GNE Links: Profile News Message Board | |
| Charts:- Daily , Weekly | |
| Add GNE to Watchlist: View: Get Complete GNE Trend Analysis ➞ | |
 | CMBM Cambium Networks Corporation |
| Sector: Technology | |
| SubSector: Communication Equipment | |
| MarketCap: 143.739 Millions | |
| Recent Price: 3.42 Smart Investing & Trading Score: 35 | |
| Day Percent Change: -1.59% Day Change: -0.06 | |
| Week Change: 3.8% Year-to-date Change: -43.1% | |
| CMBM Links: Profile News Message Board | |
| Charts:- Daily , Weekly | |
| Add CMBM to Watchlist: View: Get Complete CMBM Trend Analysis ➞ | |
 | QTRX Quanterix Corporation |
| Sector: Health Care | |
| SubSector: Biotechnology | |
| MarketCap: 448.685 Millions | |
| Recent Price: 15.55 Smart Investing & Trading Score: 10 | |
| Day Percent Change: -3.45% Day Change: -0.56 | |
| Week Change: -1.86% Year-to-date Change: -43.1% | |
| QTRX Links: Profile News Message Board | |
| Charts:- Daily , Weekly | |
| Add QTRX to Watchlist: View: Get Complete QTRX Trend Analysis ➞ | |
 | upst Upstart Holdings, Inc. |
| Sector: Financials | |
| SubSector: Credit Services | |
| MarketCap: 2900 Millions | |
| Recent Price: 22.98 Smart Investing & Trading Score: 42 | |
| Day Percent Change: 0.09% Day Change: 0.02 | |
| Week Change: 5.08% Year-to-date Change: -43.3% | |
| upst Links: Profile News Message Board | |
| Charts:- Daily , Weekly | |
| Add upst to Watchlist: View: Get Complete upst Trend Analysis ➞ | |
 | ONL Orion Office REIT Inc. |
| Sector: Financials | |
| SubSector: REIT - Office | |
| MarketCap: 375 Millions | |
| Recent Price: 3.24 Smart Investing & Trading Score: 67 | |
| Day Percent Change: -0.92% Day Change: -0.03 | |
| Week Change: 2.53% Year-to-date Change: -43.4% | |
| ONL Links: Profile News Message Board | |
| Charts:- Daily , Weekly | |
| Add ONL to Watchlist: View: Get Complete ONL Trend Analysis ➞ | |
 | FOSL Fossil Group, Inc. |
| Sector: Consumer Staples | |
| SubSector: Textile - Apparel Footwear & Accessories | |
| MarketCap: 215.87 Millions | |
| Recent Price: 0.82 Smart Investing & Trading Score: 27 | |
| Day Percent Change: -1.61% Day Change: -0.01 | |
| Week Change: -3.2% Year-to-date Change: -43.6% | |
| FOSL Links: Profile News Message Board | |
| Charts:- Daily , Weekly | |
| Add FOSL to Watchlist: View: Get Complete FOSL Trend Analysis ➞ | |
 | EMBC Embecta Corp. |
| Sector: Health Care | |
| SubSector: Medical Instruments & Supplies | |
| MarketCap: 1260 Millions | |
| Recent Price: 10.77 Smart Investing & Trading Score: 52 | |
| Day Percent Change: -1.10% Day Change: -0.12 | |
| Week Change: 1.41% Year-to-date Change: -43.6% | |
| EMBC Links: Profile News Message Board | |
| Charts:- Daily , Weekly | |
| Add EMBC to Watchlist: View: Get Complete EMBC Trend Analysis ➞ | |
 | PRTA Prothena Corporation plc |
| Sector: Health Care | |
| SubSector: Biotechnology | |
| MarketCap: 357.985 Millions | |
| Recent Price: 20.43 Smart Investing & Trading Score: 20 | |
| Day Percent Change: -0.63% Day Change: -0.13 | |
| Week Change: -3.45% Year-to-date Change: -43.8% | |
| PRTA Links: Profile News Message Board | |
| Charts:- Daily , Weekly | |
| Add PRTA to Watchlist: View: Get Complete PRTA Trend Analysis ➞ | |
 | HAIN The Hain Celestial Group, Inc. |
| Sector: Consumer Staples | |
| SubSector: Food Wholesale | |
| MarketCap: 2684.69 Millions | |
| Recent Price: 6.13 Smart Investing & Trading Score: 42 | |
| Day Percent Change: -0.73% Day Change: -0.04 | |
| Week Change: 2.25% Year-to-date Change: -44.0% | |
| HAIN Links: Profile News Message Board | |
| Charts:- Daily , Weekly | |
| Add HAIN to Watchlist: View: Get Complete HAIN Trend Analysis ➞ | |
 | AUPH Aurinia Pharmaceuticals Inc. |
| Sector: Health Care | |
| SubSector: Biotechnology | |
| MarketCap: 1319.75 Millions | |
| Recent Price: 5.02 Smart Investing & Trading Score: 32 | |
| Day Percent Change: -1.38% Day Change: -0.07 | |
| Week Change: 0.6% Year-to-date Change: -44.2% | |
| AUPH Links: Profile News Message Board | |
| Charts:- Daily , Weekly | |
| Add AUPH to Watchlist: View: Get Complete AUPH Trend Analysis ➞ | |
 | PMVP PMV Pharmaceuticals, Inc. |
| Sector: Health Care | |
| SubSector: Biotechnology | |
| MarketCap: 20187 Millions | |
| Recent Price: 1.73 Smart Investing & Trading Score: 59 | |
| Day Percent Change: -4.43% Day Change: -0.08 | |
| Week Change: 6.48% Year-to-date Change: -44.4% | |
| PMVP Links: Profile News Message Board | |
| Charts:- Daily , Weekly | |
| Add PMVP to Watchlist: View: Get Complete PMVP Trend Analysis ➞ | |
 | CUE Cue Biopharma, Inc. |
| Sector: Health Care | |
| SubSector: Biotechnology | |
| MarketCap: 352.785 Millions | |
| Recent Price: 1.46 Smart Investing & Trading Score: 0 | |
| Day Percent Change: -2.67% Day Change: -0.04 | |
| Week Change: -7.01% Year-to-date Change: -44.7% | |
| CUE Links: Profile News Message Board | |
| Charts:- Daily , Weekly | |
| Add CUE to Watchlist: View: Get Complete CUE Trend Analysis ➞ | |
 | PLSE Pulse Biosciences, Inc. |
| Sector: Health Care | |
| SubSector: Medical Instruments & Supplies | |
| MarketCap: 131.96 Millions | |
| Recent Price: 6.71 Smart Investing & Trading Score: 0 | |
| Day Percent Change: -2.11% Day Change: -0.15 | |
| Week Change: -6.61% Year-to-date Change: -45.1% | |
| PLSE Links: Profile News Message Board | |
| Charts:- Daily , Weekly | |
| Add PLSE to Watchlist: View: Get Complete PLSE Trend Analysis ➞ | |
 | PETS PetMed Express, Inc. |
| Sector: Health Care | |
| SubSector: Drug Delivery | |
| MarketCap: 528.23 Millions | |
| Recent Price: 4.14 Smart Investing & Trading Score: 45 | |
| Day Percent Change: -0.24% Day Change: -0.01 | |
| Week Change: 0.73% Year-to-date Change: -45.2% | |
| PETS Links: Profile News Message Board | |
| Charts:- Daily , Weekly | |
| Add PETS to Watchlist: View: Get Complete PETS Trend Analysis ➞ | |
 | ALTI AlTi Global, Inc. |
| Sector: Financials | |
| SubSector: Asset Management | |
| MarketCap: 917 Millions | |
| Recent Price: 4.96 Smart Investing & Trading Score: 57 | |
| Day Percent Change: 0.10% Day Change: 0.00 | |
| Week Change: 7% Year-to-date Change: -45.3% | |
| ALTI Links: Profile News Message Board | |
| Charts:- Daily , Weekly | |
| Add ALTI to Watchlist: View: Get Complete ALTI Trend Analysis ➞ | |
 | FRGE Forge Global Holdings, Inc. |
| Sector: Technology | |
| SubSector: Software - Application | |
| MarketCap: 426 Millions | |
| Recent Price: 1.94 Smart Investing & Trading Score: 80 | |
| Day Percent Change: -1.52% Day Change: -0.03 | |
| Week Change: 4.3% Year-to-date Change: -45.7% | |
| FRGE Links: Profile News Message Board | |
| Charts:- Daily , Weekly | |
| Add FRGE to Watchlist: View: Get Complete FRGE Trend Analysis ➞ | |
 | FCEL FuelCell Energy, Inc. |
| Sector: Industrials | |
| SubSector: Industrial Electrical Equipment | |
| MarketCap: 347.079 Millions | |
| Recent Price: 0.87 Smart Investing & Trading Score: 27 | |
| Day Percent Change: -5.39% Day Change: -0.05 | |
| Week Change: -1.69% Year-to-date Change: -45.7% | |
| FCEL Links: Profile News Message Board | |
| Charts:- Daily , Weekly | |
| Add FCEL to Watchlist: View: Get Complete FCEL Trend Analysis ➞ | |
 | DDD 3D Systems Corporation |
| Sector: Technology | |
| SubSector: Computer Peripherals | |
| MarketCap: 842.989 Millions | |
| Recent Price: 3.45 Smart Investing & Trading Score: 20 | |
| Day Percent Change: -1.43% Day Change: -0.05 | |
| Week Change: -2.82% Year-to-date Change: -45.7% | |
| DDD Links: Profile News Message Board | |
| Charts:- Daily , Weekly | |
| Add DDD to Watchlist: View: Get Complete DDD Trend Analysis ➞ | |
 | SHLS Shoals Technologies Group, Inc. |
| Sector: Technology | |
| SubSector: Solar | |
| MarketCap: 4360 Millions | |
| Recent Price: 8.41 Smart Investing & Trading Score: 25 | |
| Day Percent Change: -0.41% Day Change: -0.04 | |
| Week Change: 1.51% Year-to-date Change: -45.7% | |
| SHLS Links: Profile News Message Board | |
| Charts:- Daily , Weekly | |
| Add SHLS to Watchlist: View: Get Complete SHLS Trend Analysis ➞ | |
 | ME 23andMe Holding Co. |
| Sector: Health Care | |
| SubSector: Diagnostics & Research | |
| MarketCap: 802 Millions | |
| Recent Price: 0.48 Smart Investing & Trading Score: 40 | |
| Day Percent Change: -2.69% Day Change: -0.01 | |
| Week Change: -0.25% Year-to-date Change: -46.0% | |
| ME Links: Profile News Message Board | |
| Charts:- Daily , Weekly | |
| Add ME to Watchlist: View: Get Complete ME Trend Analysis ➞ | |
| For tabular summary view of above stock list: Summary View ➞ 0 - 25 , 25 - 50 , 50 - 75 , 75 - 100 , 100 - 125 , 125 - 150 , 150 - 175 , 175 - 200 , 200 - 225 , 225 - 250 , 250 - 275 , 275 - 300 , 300 - 325 , 325 - 350 , 350 - 375 , 375 - 400 , 400 - 425 , 425 - 450 , 450 - 475 , 475 - 500 , 500 - 525 , 525 - 550 , 550 - 575 , 575 - 600 , 600 - 625 , 625 - 650 , 650 - 675 , 675 - 700 , 700 - 725 , 725 - 750 , 750 - 775 , 775 - 800 , 800 - 825 , 825 - 850 , 850 - 875 , 875 - 900 , 900 - 925 , 925 - 950 , 950 - 975 , 975 - 1000 , 1000 - 1025 , 1025 - 1050 , 1050 - 1075 , 1075 - 1100 , 1100 - 1125 , 1125 - 1150 , 1150 - 1175 , 1175 - 1200 , 1200 - 1225 , 1225 - 1250 , 1250 - 1275 , 1275 - 1300 , 1300 - 1325 , 1325 - 1350 , 1350 - 1375 , 1375 - 1400 , 1400 - 1425 , 1425 - 1450 , 1450 - 1475 , 1475 - 1500 , 1500 - 1525 , 1525 - 1550 , 1550 - 1575 | ||
| Click To Change The Sort Order: By Market Cap or Company Size Performance: Year-to-date, Week and Day | |
| Select Chart Type: | ||
| Too many stocks? View smallcap stocks filtered by marketcap & sector |
| Marketcap: All SmallCap Stocks (default-no microcap), Large, Mid-Range, Small & MicroCap |
| Sector: Tech, Finance, Energy, Staples, Retail, Industrial, Materials, Utilities & Medical |
|
Best Stocks Today 12Stocks.com |
© 2024 12Stocks.com Terms & Conditions Privacy Contact Us
All Information Provided Only For Education And Not To Be Used For Investing or Trading. See Terms & Conditions


One More Thing ... Get Best Stocks Delivered Daily!
Never Ever Miss A Move With Our Top Ten Stocks Lists
Find Best Stocks In Any Market - Bull or Bear Market
Take A Peek At Our Top Ten Stocks Lists: Daily, Weekly, Year-to-Date & Top Trends
Find Best Stocks In Any Market - Bull or Bear Market
Take A Peek At Our Top Ten Stocks Lists: Daily, Weekly, Year-to-Date & Top Trends
Smallcap Stocks With Best Up Trends [0-bearish to 100-bullish]: Ribbon [100], B. Riley[100], Group 1[100], Trustmark [100], Integer [100], Mueller Industries[100], Glaukos [100], A10 s[100], Uniti Group[100], Wolverine World[100], Jamf Holding[100]
Best Smallcap Stocks Year-to-Date:
Janux [352.07%], Viking [259.7%], Alpine Immune[239.18%], Longboard [230.61%], Avidity Biosciences[176.77%], Super Micro[166.58%], Vera [149.61%], Hippo [131.72%], MicroStrategy [104.08%], SoundHound AI[103.27%], Trevi [101.87%] Best Smallcap Stocks This Week:
Matterport [166.09%], B. Riley[39.52%], Riot Blockchain[30.12%], Seres [30.01%], Ribbon [29.84%], ProKidney [23.28%], SoundHound AI[22.54%], Cipher Mining[22.14%], Babcock & Wilcox Enterprises[21.24%], Hibbett Sports[21.01%], Marathon Patent[20.06%] Best Smallcap Stocks Daily:
Ribbon [30.35%], B. Riley[28.41%], Babcock & Wilcox Enterprises[22.66%], Innodata [12.20%], Navitas Semiconductor[8.83%], K12 [8.21%], Cullinan Oncology[8.11%], Sage [8.03%], Vigil Neuroscience[7.92%], Annexon [7.66%], Group 1[5.92%]