
 Login Sign Up


| |||||
 |  | ||||

| 12Stocks.com Market Intelligence |
Best SmallCap Stocks
|
| In a hurry? Small Cap Stock Lists: Performance Trends Table, Stock Charts
Sort Small Cap stocks: Daily, Weekly, Year-to-Date, Market Cap & Trends. Filter Small Cap stocks list by sector: Show all, Tech, Finance, Energy, Staples, Retail, Industrial, Materials, Utilities and HealthCare Filter Small Cap stocks list by size: All Large Medium Small and MicroCap |
| 12Stocks.com Small Cap Stocks Performances & Trends Daily | |||||||||
|
|  The overall Smart Investing & Trading Score is 13 (0-bearish to 100-bullish) which puts Small Cap index in short term bearish trend. The Smart Investing & Trading Score from previous trading session is 26 and hence a deterioration of trend.
| ||||||||
Here are the Smart Investing & Trading Scores of the most requested small cap stocks at 12Stocks.com (click stock name for detailed review):
|


| 12Stocks.com: Investing in Smallcap Index with Stocks | |
|
The following table helps investors and traders sort through current performance and trends (as measured by Smart Investing & Trading Score) of various
stocks in the Smallcap Index. Quick View: Move mouse or cursor over stock symbol (ticker) to view short-term technical chart and over stock name to view long term chart. Click on  to add stock symbol to your watchlist and to add stock symbol to your watchlist and  to view watchlist. Click on any ticker or stock name for detailed market intelligence report for that stock. to view watchlist. Click on any ticker or stock name for detailed market intelligence report for that stock. |
12Stocks.com Performance of Stocks in Smallcap Index
| Ticker | Stock Name | Watchlist | Category | Recent Price | Smart Investing & Trading Score | Change % | YTD Change% |
| YELP | Yelp |   | Technology | 39.56 | 25 | 0.00% | -16.43% |
| WERN | Werner Enterprises | | Transports | 35.39 | 0 | -2.08% | -16.47% |
| WISH | ContextLogic | | Services & Goods | 4.96 | 56 | -1.88% | -16.48% |
| AWR | American States | | Utilities | 67.15 | 27 | 0.87% | -16.50% |
| BANF | BancFirst | | Financials | 81.27 | 0 | -0.68% | -16.50% |
| TRST | TrustCo Bank | | Financials | 25.91 | 20 | -0.35% | -16.55% |
| SPSC | SPS Commerce | | Technology | 161.70 | 0 | -1.01% | -16.58% |
| AVNS | Avanos Medical | | Health Care | 18.71 | 42 | 0.32% | -16.58% |
| DIOD | Diodes | | Technology | 67.16 | 30 | -1.78% | -16.59% |
| DEA | Easterly Government | | Financials | 11.21 | 27 | 0.54% | -16.59% |
| FPI | Farmland Partners | | Financials | 10.41 | 10 | 0.00% | -16.59% |
| OCFC | OceanFirst Financial | | Financials | 14.47 | 27 | -0.28% | -16.65% |
| LASR | nLIGHT | | Technology | 11.25 | 10 | -0.62% | -16.67% |
| MBWM | Mercantile Bank | | Financials | 33.62 | 0 | -1.52% | -16.74% |
| CVLY | Codorus Valley | | Financials | 21.37 | 17 | -0.19% | -16.85% |
| ESE | ESCO | | Technology | 97.26 | 0 | -1.64% | -16.89% |
| SPTN | SpartanNash | | Consumer Staples | 19.05 | 59 | 0.90% | -16.99% |
| NATH | Nathan s | | Services & Goods | 64.75 | 0 | -0.61% | -17.00% |
| GPRE | Green Plains | | Materials | 20.93 | 43 | -0.85% | -17.01% |
| VRA | Vera Bradley | | Consumer Staples | 6.39 | 25 | 0.16% | -17.01% |
| BNL | Broadstone Net | | Financials | 14.29 | 10 | -0.49% | -17.02% |
| FEAM | 5E Advanced | | Materials | 1.17 | 20 | 1.74% | -17.02% |
| CIFR | Cipher Mining | | Financials | 3.41 | 36 | 1.49% | -17.03% |
| TRUE | TrueCar | | Technology | 2.87 | 17 | 2.14% | -17.05% |
| GDOT | Green Dot | | Financials | 8.21 | 42 | 0.49% | -17.07% |


| Too many stocks? View smallcap stocks filtered by marketcap & sector |
| Marketcap: All SmallCap Stocks (default-no microcap), Large, Mid-Range, Small |
| Smallcap Sector: Tech, Finance, Energy, Staples, Retail, Industrial, Materials, & Medical |
|
Get the most comprehensive stock market coverage daily at 12Stocks.com ➞ Best Stocks Today ➞ Best Stocks Weekly ➞ Best Stocks Year-to-Date ➞ Best Stocks Trends ➞  Best Stocks Today 12Stocks.com Best Nasdaq Stocks ➞ Best S&P 500 Stocks ➞ Best Tech Stocks ➞ Best Biotech Stocks ➞ |
| Detailed Overview of SmallCap Stocks |
| SmallCap Technical Overview, Leaders & Laggards, Top SmallCap ETF Funds & Detailed SmallCap Stocks List, Charts, Trends & More |
| Smallcap: Technical Analysis, Trends & YTD Performance | |
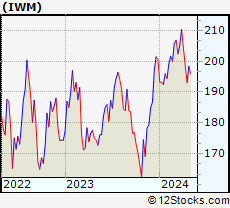
| SmallCap segment as represented by
IWM, an exchange-traded fund [ETF], holds basket of thousands of smallcap stocks from across all major sectors of the US stock market. The smallcap index (contains stocks like Riverbed & Sotheby's) is down by -3.84% and is currently underperforming the overall market by -8.25% year-to-date. Below is a quick view of technical charts and trends: | |
 IWM Weekly Chart |
|
| Long Term Trend: Good | |
| Medium Term Trend: Not Good | |
 IWM Daily Chart |
|
| Short Term Trend: Not Good | |
| Overall Trend Score: 13 | |
| YTD Performance: -3.84% | |
| **Trend Scores & Views Are Only For Educational Purposes And Not For Investing | |
| 12Stocks.com: Top Performing Small Cap Index Stocks | ||||||||||||||||||||||||||||||||||||||||||||||||
 The top performing Small Cap Index stocks year to date are
Now, more recently, over last week, the top performing Small Cap Index stocks on the move are


|
||||||||||||||||||||||||||||||||||||||||||||||||
| 12Stocks.com: Investing in Smallcap Index using Exchange Traded Funds | |
|
The following table shows list of key exchange traded funds (ETF) that
help investors track Smallcap index. The following list also includes leveraged ETF funds that track twice or thrice the daily returns of Smallcap indices. Short or inverse ETF funds move in the opposite direction to the index they track and are useful during market pullbacks or during bear markets. Quick View: Move mouse or cursor over ETF symbol (ticker) to view short-term technical chart and over ETF name to view long term chart. Click on ticker or stock name for detailed view. Click on to add stock symbol to your watchlist and to view watchlist. |
12Stocks.com List of ETFs that track Smallcap Index
| Ticker | ETF Name | Watchlist | Recent Price | Smart Investing & Trading Score | Change % | Week % | Year-to-date % |
| IWM | iShares Russell 2000 | | 193.00 | 13 | -1.06 | -2.86 | -3.84% |
| IJR | iShares Core S&P Small-Cap | | 102.13 | 7 | -0.58 | -2.28 | -5.65% |
| VTWO | Vanguard Russell 2000 ETF | | 78.05 | 13 | -1.04 | -2.83 | -3.76% |
| IWN | iShares Russell 2000 Value | | 146.03 | 0 | -0.77 | -2.89 | -5.99% |
| IWO | iShares Russell 2000 Growth | | 248.02 | 26 | -0.90 | -2.87 | -1.67% |
| IJS | iShares S&P Small-Cap 600 Value | | 94.12 | 7 | -0.57 | -2.13 | -8.68% |
| IJT | iShares S&P Small-Cap 600 Growth | | 121.84 | 13 | -1.02 | -2.36 | -2.64% |
| XSLV | PowerShares S&P SmallCap Low Volatil ETF | | 41.42 | 0 | -0.38 | -1.59 | -6.18% |
| SAA | ProShares Ultra SmallCap600 | | 21.66 | 0 | -1.19 | -3.99 | -13.19% |
| SMLV | SPDR SSGA US Small Cap Low Volatil ETF | | 103.66 | 10 | -0.17 | -1.29 | -7.87% |
| SBB | ProShares Short SmallCap600 | | 16.85 | 93 | 0.42 | 1.83 | 5.78% |
| SDD | ProShares UltraShort SmallCap600 | | 20.60 | 93 | 1.23 | 3.88 | 11.8% |
| 12Stocks.com: Charts, Trends, Fundamental Data and Performances of SmallCap Stocks | |
|
We now take in-depth look at all SmallCap stocks including charts, multi-period performances and overall trends (as measured by Smart Investing & Trading Score). One can sort SmallCap stocks (click link to choose) by Daily, Weekly and by Year-to-Date performances. Also, one can sort by size of the company or by market capitalization. |
| Select Your Default Chart Type: | |||||
| |||||
| Click on stock symbol or name for detailed view. Click on to add stock symbol to your watchlist and to view watchlist. Quick View: Move mouse or cursor over "Daily" to quickly view daily technical stock chart and over "Weekly" to view weekly technical stock chart. | |||||

 | YELP Yelp Inc. |
| Sector: Technology | |
| SubSector: Internet Information Providers | |
| MarketCap: 1430.1 Millions | |
| Recent Price: 39.56 Smart Investing & Trading Score: 25 | |
| Day Percent Change: 0.00% Day Change: 0.00 | |
| Week Change: -2.59% Year-to-date Change: -16.4% | |
| YELP Links: Profile News Message Board | |
| Charts:- Daily , Weekly | |
| Add YELP to Watchlist: View: Get Complete YELP Trend Analysis ➞ | |
 | WERN Werner Enterprises, Inc. |
| Sector: Transports | |
| SubSector: Trucking | |
| MarketCap: 2409.65 Millions | |
| Recent Price: 35.39 Smart Investing & Trading Score: 0 | |
| Day Percent Change: -2.08% Day Change: -0.75 | |
| Week Change: -3.09% Year-to-date Change: -16.5% | |
| WERN Links: Profile News Message Board | |
| Charts:- Daily , Weekly | |
| Add WERN to Watchlist: View: Get Complete WERN Trend Analysis ➞ | |
 | WISH ContextLogic Inc. |
| Sector: Services & Goods | |
| SubSector: Internet Retail | |
| MarketCap: 165 Millions | |
| Recent Price: 4.96 Smart Investing & Trading Score: 56 | |
| Day Percent Change: -1.88% Day Change: -0.09 | |
| Week Change: -0.7% Year-to-date Change: -16.5% | |
| WISH Links: Profile News Message Board | |
| Charts:- Daily , Weekly | |
| Add WISH to Watchlist: View: Get Complete WISH Trend Analysis ➞ | |
 | AWR American States Water Company |
| Sector: Utilities | |
| SubSector: Water Utilities | |
| MarketCap: 3519.12 Millions | |
| Recent Price: 67.15 Smart Investing & Trading Score: 27 | |
| Day Percent Change: 0.87% Day Change: 0.58 | |
| Week Change: -0.93% Year-to-date Change: -16.5% | |
| AWR Links: Profile News Message Board | |
| Charts:- Daily , Weekly | |
| Add AWR to Watchlist: View: Get Complete AWR Trend Analysis ➞ | |
 | BANF BancFirst Corporation |
| Sector: Financials | |
| SubSector: Regional - Southwest Banks | |
| MarketCap: 1068.65 Millions | |
| Recent Price: 81.27 Smart Investing & Trading Score: 0 | |
| Day Percent Change: -0.68% Day Change: -0.56 | |
| Week Change: -1.82% Year-to-date Change: -16.5% | |
| BANF Links: Profile News Message Board | |
| Charts:- Daily , Weekly | |
| Add BANF to Watchlist: View: Get Complete BANF Trend Analysis ➞ | |
 | TRST TrustCo Bank Corp NY |
| Sector: Financials | |
| SubSector: Regional - Northeast Banks | |
| MarketCap: 543.999 Millions | |
| Recent Price: 25.91 Smart Investing & Trading Score: 20 | |
| Day Percent Change: -0.35% Day Change: -0.09 | |
| Week Change: -1.3% Year-to-date Change: -16.6% | |
| TRST Links: Profile News Message Board | |
| Charts:- Daily , Weekly | |
| Add TRST to Watchlist: View: Get Complete TRST Trend Analysis ➞ | |
 | SPSC SPS Commerce, Inc. |
| Sector: Technology | |
| SubSector: Application Software | |
| MarketCap: 1398.02 Millions | |
| Recent Price: 161.70 Smart Investing & Trading Score: 0 | |
| Day Percent Change: -1.01% Day Change: -1.65 | |
| Week Change: -4.69% Year-to-date Change: -16.6% | |
| SPSC Links: Profile News Message Board | |
| Charts:- Daily , Weekly | |
| Add SPSC to Watchlist: View: Get Complete SPSC Trend Analysis ➞ | |
 | AVNS Avanos Medical, Inc. |
| Sector: Health Care | |
| SubSector: Medical Instruments & Supplies | |
| MarketCap: 1229.6 Millions | |
| Recent Price: 18.71 Smart Investing & Trading Score: 42 | |
| Day Percent Change: 0.32% Day Change: 0.06 | |
| Week Change: 1.08% Year-to-date Change: -16.6% | |
| AVNS Links: Profile News Message Board | |
| Charts:- Daily , Weekly | |
| Add AVNS to Watchlist: View: Get Complete AVNS Trend Analysis ➞ | |
 | DIOD Diodes Incorporated |
| Sector: Technology | |
| SubSector: Semiconductor - Integrated Circuits | |
| MarketCap: 1967.6 Millions | |
| Recent Price: 67.16 Smart Investing & Trading Score: 30 | |
| Day Percent Change: -1.78% Day Change: -1.22 | |
| Week Change: -1.74% Year-to-date Change: -16.6% | |
| DIOD Links: Profile News Message Board | |
| Charts:- Daily , Weekly | |
| Add DIOD to Watchlist: View: Get Complete DIOD Trend Analysis ➞ | |
 | DEA Easterly Government Properties, Inc. |
| Sector: Financials | |
| SubSector: REIT - Office | |
| MarketCap: 1832.56 Millions | |
| Recent Price: 11.21 Smart Investing & Trading Score: 27 | |
| Day Percent Change: 0.54% Day Change: 0.06 | |
| Week Change: -1.41% Year-to-date Change: -16.6% | |
| DEA Links: Profile News Message Board | |
| Charts:- Daily , Weekly | |
| Add DEA to Watchlist: View: Get Complete DEA Trend Analysis ➞ | |
 | FPI Farmland Partners Inc. |
| Sector: Financials | |
| SubSector: REIT - Diversified | |
| MarketCap: 182.653 Millions | |
| Recent Price: 10.41 Smart Investing & Trading Score: 10 | |
| Day Percent Change: 0.00% Day Change: 0.00 | |
| Week Change: -0.86% Year-to-date Change: -16.6% | |
| FPI Links: Profile News Message Board | |
| Charts:- Daily , Weekly | |
| Add FPI to Watchlist: View: Get Complete FPI Trend Analysis ➞ | |
 | OCFC OceanFirst Financial Corp. |
| Sector: Financials | |
| SubSector: Savings & Loans | |
| MarketCap: 867.43 Millions | |
| Recent Price: 14.47 Smart Investing & Trading Score: 27 | |
| Day Percent Change: -0.28% Day Change: -0.04 | |
| Week Change: -2.03% Year-to-date Change: -16.7% | |
| OCFC Links: Profile News Message Board | |
| Charts:- Daily , Weekly | |
| Add OCFC to Watchlist: View: Get Complete OCFC Trend Analysis ➞ | |
 | LASR nLIGHT, Inc. |
| Sector: Technology | |
| SubSector: Semiconductor - Broad Line | |
| MarketCap: 445.642 Millions | |
| Recent Price: 11.25 Smart Investing & Trading Score: 10 | |
| Day Percent Change: -0.62% Day Change: -0.07 | |
| Week Change: -3.6% Year-to-date Change: -16.7% | |
| LASR Links: Profile News Message Board | |
| Charts:- Daily , Weekly | |
| Add LASR to Watchlist: View: Get Complete LASR Trend Analysis ➞ | |
 | MBWM Mercantile Bank Corporation |
| Sector: Financials | |
| SubSector: Regional - Midwest Banks | |
| MarketCap: 372.77 Millions | |
| Recent Price: 33.62 Smart Investing & Trading Score: 0 | |
| Day Percent Change: -1.52% Day Change: -0.52 | |
| Week Change: -5.93% Year-to-date Change: -16.7% | |
| MBWM Links: Profile News Message Board | |
| Charts:- Daily , Weekly | |
| Add MBWM to Watchlist: View: Get Complete MBWM Trend Analysis ➞ | |
 | CVLY Codorus Valley Bancorp, Inc. |
| Sector: Financials | |
| SubSector: Regional - Northeast Banks | |
| MarketCap: 173.799 Millions | |
| Recent Price: 21.37 Smart Investing & Trading Score: 17 | |
| Day Percent Change: -0.19% Day Change: -0.04 | |
| Week Change: 0% Year-to-date Change: -16.9% | |
| CVLY Links: Profile News Message Board | |
| Charts:- Daily , Weekly | |
| Add CVLY to Watchlist: View: Get Complete CVLY Trend Analysis ➞ | |
 | ESE ESCO Technologies Inc. |
| Sector: Technology | |
| SubSector: Scientific & Technical Instruments | |
| MarketCap: 1968.03 Millions | |
| Recent Price: 97.26 Smart Investing & Trading Score: 0 | |
| Day Percent Change: -1.64% Day Change: -1.62 | |
| Week Change: -4.18% Year-to-date Change: -16.9% | |
| ESE Links: Profile News Message Board | |
| Charts:- Daily , Weekly | |
| Add ESE to Watchlist: View: Get Complete ESE Trend Analysis ➞ | |
 | SPTN SpartanNash Company |
| Sector: Consumer Staples | |
| SubSector: Food Wholesale | |
| MarketCap: 671.229 Millions | |
| Recent Price: 19.05 Smart Investing & Trading Score: 59 | |
| Day Percent Change: 0.90% Day Change: 0.17 | |
| Week Change: 1.71% Year-to-date Change: -17.0% | |
| SPTN Links: Profile News Message Board | |
| Charts:- Daily , Weekly | |
| Add SPTN to Watchlist: View: Get Complete SPTN Trend Analysis ➞ | |
 | NATH Nathan s Famous, Inc. |
| Sector: Services & Goods | |
| SubSector: Restaurants | |
| MarketCap: 211.77 Millions | |
| Recent Price: 64.75 Smart Investing & Trading Score: 0 | |
| Day Percent Change: -0.61% Day Change: -0.40 | |
| Week Change: -2.32% Year-to-date Change: -17.0% | |
| NATH Links: Profile News Message Board | |
| Charts:- Daily , Weekly | |
| Add NATH to Watchlist: View: Get Complete NATH Trend Analysis ➞ | |
 | GPRE Green Plains Inc. |
| Sector: Materials | |
| SubSector: Specialty Chemicals | |
| MarketCap: 196.357 Millions | |
| Recent Price: 20.93 Smart Investing & Trading Score: 43 | |
| Day Percent Change: -0.85% Day Change: -0.18 | |
| Week Change: -4.56% Year-to-date Change: -17.0% | |
| GPRE Links: Profile News Message Board | |
| Charts:- Daily , Weekly | |
| Add GPRE to Watchlist: View: Get Complete GPRE Trend Analysis ➞ | |
 | VRA Vera Bradley, Inc. |
| Sector: Consumer Staples | |
| SubSector: Textile - Apparel Footwear & Accessories | |
| MarketCap: 151.17 Millions | |
| Recent Price: 6.39 Smart Investing & Trading Score: 25 | |
| Day Percent Change: 0.16% Day Change: 0.01 | |
| Week Change: 0.63% Year-to-date Change: -17.0% | |
| VRA Links: Profile News Message Board | |
| Charts:- Daily , Weekly | |
| Add VRA to Watchlist: View: Get Complete VRA Trend Analysis ➞ | |
 | BNL Broadstone Net Lease, Inc. |
| Sector: Financials | |
| SubSector: REIT Diversified | |
| MarketCap: 27267 Millions | |
| Recent Price: 14.29 Smart Investing & Trading Score: 10 | |
| Day Percent Change: -0.49% Day Change: -0.07 | |
| Week Change: -2.59% Year-to-date Change: -17.0% | |
| BNL Links: Profile News Message Board | |
| Charts:- Daily , Weekly | |
| Add BNL to Watchlist: View: Get Complete BNL Trend Analysis ➞ | |
 | FEAM 5E Advanced Materials Inc. |
| Sector: Materials | |
| SubSector: Specialty Chemicals | |
| MarketCap: 247 Millions | |
| Recent Price: 1.17 Smart Investing & Trading Score: 20 | |
| Day Percent Change: 1.74% Day Change: 0.02 | |
| Week Change: -7.14% Year-to-date Change: -17.0% | |
| FEAM Links: Profile News Message Board | |
| Charts:- Daily , Weekly | |
| Add FEAM to Watchlist: View: Get Complete FEAM Trend Analysis ➞ | |
 | CIFR Cipher Mining Inc. |
| Sector: Financials | |
| SubSector: Capital Markets | |
| MarketCap: 712 Millions | |
| Recent Price: 3.41 Smart Investing & Trading Score: 36 | |
| Day Percent Change: 1.49% Day Change: 0.05 | |
| Week Change: -10.85% Year-to-date Change: -17.0% | |
| CIFR Links: Profile News Message Board | |
| Charts:- Daily , Weekly | |
| Add CIFR to Watchlist: View: Get Complete CIFR Trend Analysis ➞ | |
 | TRUE TrueCar, Inc. |
| Sector: Technology | |
| SubSector: Internet Service Providers | |
| MarketCap: 244.18 Millions | |
| Recent Price: 2.87 Smart Investing & Trading Score: 17 | |
| Day Percent Change: 2.14% Day Change: 0.06 | |
| Week Change: -2.05% Year-to-date Change: -17.1% | |
| TRUE Links: Profile News Message Board | |
| Charts:- Daily , Weekly | |
| Add TRUE to Watchlist: View: Get Complete TRUE Trend Analysis ➞ | |
 | GDOT Green Dot Corporation |
| Sector: Financials | |
| SubSector: Credit Services | |
| MarketCap: 1320.08 Millions | |
| Recent Price: 8.21 Smart Investing & Trading Score: 42 | |
| Day Percent Change: 0.49% Day Change: 0.04 | |
| Week Change: 2.63% Year-to-date Change: -17.1% | |
| GDOT Links: Profile News Message Board | |
| Charts:- Daily , Weekly | |
| Add GDOT to Watchlist: View: Get Complete GDOT Trend Analysis ➞ | |
| Too many stocks? View smallcap stocks filtered by marketcap & sector |
| Marketcap: All SmallCap Stocks (default-no microcap), Large, Mid-Range, Small & MicroCap |
| Sector: Tech, Finance, Energy, Staples, Retail, Industrial, Materials, Utilities & Medical |
|
Best Stocks Today 12Stocks.com |
© 2024 12Stocks.com Terms & Conditions Privacy Contact Us
All Information Provided Only For Education And Not To Be Used For Investing or Trading. See Terms & Conditions


One More Thing ... Get Best Stocks Delivered Daily!
Never Ever Miss A Move With Our Top Ten Stocks Lists
Find Best Stocks In Any Market - Bull or Bear Market
Take A Peek At Our Top Ten Stocks Lists: Daily, Weekly, Year-to-Date & Top Trends
Find Best Stocks In Any Market - Bull or Bear Market
Take A Peek At Our Top Ten Stocks Lists: Daily, Weekly, Year-to-Date & Top Trends
Smallcap Stocks With Best Up Trends [0-bearish to 100-bullish]: Vanda [100], Zuora [100], ALX Oncology[100], ProKidney [100], PrimeEnergy Resources[100], IMAX [100], Envestnet [100], Intra-Cellular Therapies[100], Dorian LPG[95], Victory Capital[95], Oscar Health[95]
Best Smallcap Stocks Year-to-Date:
Agenus [552.25%], CareMax [416.49%], Janux [346.07%], Viking [257.17%], Alpine Immune[238.55%], Super Micro[237.75%], Arcutis Bio[217.34%], Longboard [177.91%], Avidity Biosciences[160.56%], Vera [158.46%], Stoke [122.81%] Best Smallcap Stocks This Week:
ProKidney [61.71%], Macatawa Bank[42.75%], Snap One[29.85%], Vanda [27.18%], ALX Oncology[23.41%], Intra-Cellular Therapies[16.41%], Escalade [13.71%], Karyopharm [13.11%], Encore Wire[10.06%], Zuora [10%], Direxion Daily[8.81%] Best Smallcap Stocks Daily:
Vanda [29.38%], Karyopharm [25.45%], Cutera [18.41%], Children s[16.46%], WW [14.10%], Lineage Cell[12.17%], Zuora [11.69%], ALX Oncology[10.97%], Marinus [10.77%], Acrivon [9.19%], Cue Biopharma[9.03%]