
 Login Sign Up


| |||||
 |  | ||||

| 12Stocks.com Market Intelligence |
Best SmallCap Stocks
|
| In a hurry? Small Cap Stock Lists: Performance Trends Table, Stock Charts
Sort Small Cap stocks: Daily, Weekly, Year-to-Date, Market Cap & Trends. Filter Small Cap stocks list by sector: Show all, Tech, Finance, Energy, Staples, Retail, Industrial, Materials, Utilities and HealthCare Filter Small Cap stocks list by size: All Large Medium Small and MicroCap |
| 12Stocks.com Small Cap Stocks Performances & Trends Daily | |||||||||
|
|  The overall Smart Investing & Trading Score is 58 (0-bearish to 100-bullish) which puts Small Cap index in short term neutral trend. The Smart Investing & Trading Score from previous trading session is 63 and hence a deterioration of trend.
| ||||||||
Here are the Smart Investing & Trading Scores of the most requested small cap stocks at 12Stocks.com (click stock name for detailed review):
|


| 12Stocks.com: Investing in Smallcap Index with Stocks | |
|
The following table helps investors and traders sort through current performance and trends (as measured by Smart Investing & Trading Score) of various
stocks in the Smallcap Index. Quick View: Move mouse or cursor over stock symbol (ticker) to view short-term technical chart and over stock name to view long term chart. Click on  to add stock symbol to your watchlist and to add stock symbol to your watchlist and  to view watchlist. Click on any ticker or stock name for detailed market intelligence report for that stock. to view watchlist. Click on any ticker or stock name for detailed market intelligence report for that stock. |
12Stocks.com Performance of Stocks in Smallcap Index
| Ticker | Stock Name | Watchlist | Category | Recent Price | Smart Investing & Trading Score | Change % | YTD Change% |
| NVEC | NVE |   | Technology | 80.38 | 45 | 1.97% | 2.49% |
| UMH | UMH Properties | | Financials | 15.69 | 83 | 0.64% | 2.42% |
| ORC | Orchid Island | | Financials | 8.63 | 75 | 0.12% | 2.37% |
| GABC | German American | | Financials | 33.17 | 48 | -0.15% | 2.34% |
| HI | Hillenbrand | | Industrials | 48.95 | 90 | -0.47% | 2.30% |
| WOR | Worthington Industries | | Materials | 58.84 | 65 | -1.28% | 2.24% |
| TRN | Trinity Industries | | Transports | 27.18 | 68 | 1.57% | 2.22% |
| LILA | Liberty Latin | | Technology | 7.47 | 93 | 0.40% | 2.19% |
| TPH | TRI Pointe | | Industrials | 36.17 | 70 | -1.34% | 2.18% |
| HNI | HNI | | Consumer Staples | 42.73 | 58 | -1.48% | 2.15% |
| NGVT | Ingevity | | Materials | 48.23 | 100 | -1.37% | 2.14% |
| RGR | Sturm Ruger | | Industrials | 46.42 | 63 | -1.00% | 2.13% |
| IMMR | Immersion | | Technology | 7.21 | 36 | 0.56% | 2.12% |
| PBPB | Potbelly | | Services & Goods | 10.64 | 50 | -2.03% | 2.11% |
| TK | Teekay | | Transports | 7.30 | 35 | 0.27% | 2.10% |
| ITCI | Intra-Cellular Therapies | | Health Care | 73.12 | 83 | -1.20% | 2.09% |
| KAI | Kadant | | Industrials | 285.89 | 45 | -1.25% | 1.99% |
| MNRO | Monro | | Consumer Staples | 29.91 | 42 | -2.41% | 1.94% |
| LILAK | Liberty Latin | | Technology | 7.48 | 93 | 0.47% | 1.91% |
| OGS | ONE Gas | | Utilities | 64.93 | 93 | 0.65% | 1.90% |
| KNSA | Kiniksa | | Health Care | 17.86 | 47 | 1.02% | 1.82% |
| ALRM | Alarm.com | | Technology | 65.79 | 58 | -0.54% | 1.81% |
| CLFD | Clearfield | | Technology | 29.60 | 68 | 0.58% | 1.79% |
| TRNS | Transcat | | Technology | 111.27 | 100 | -3.23% | 1.77% |
| RYAM | Rayonier Advanced | | Materials | 4.12 | 10 | 1.48% | 1.73% |


| Too many stocks? View smallcap stocks filtered by marketcap & sector |
| Marketcap: All SmallCap Stocks (default-no microcap), Large, Mid-Range, Small |
| Smallcap Sector: Tech, Finance, Energy, Staples, Retail, Industrial, Materials, & Medical |
|
Get the most comprehensive stock market coverage daily at 12Stocks.com ➞ Best Stocks Today ➞ Best Stocks Weekly ➞ Best Stocks Year-to-Date ➞ Best Stocks Trends ➞  Best Stocks Today 12Stocks.com Best Nasdaq Stocks ➞ Best S&P 500 Stocks ➞ Best Tech Stocks ➞ Best Biotech Stocks ➞ |
| Detailed Overview of SmallCap Stocks |
| SmallCap Technical Overview, Leaders & Laggards, Top SmallCap ETF Funds & Detailed SmallCap Stocks List, Charts, Trends & More |
| Smallcap: Technical Analysis, Trends & YTD Performance | |
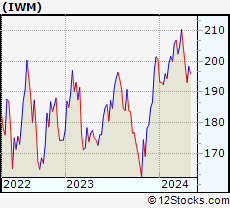
| SmallCap segment as represented by
IWM, an exchange-traded fund [ETF], holds basket of thousands of smallcap stocks from across all major sectors of the US stock market. The smallcap index (contains stocks like Riverbed & Sotheby's) is down by -1.51% and is currently underperforming the overall market by -7.17% year-to-date. Below is a quick view of technical charts and trends: | |
 IWM Weekly Chart |
|
| Long Term Trend: Good | |
| Medium Term Trend: Not Good | |
 IWM Daily Chart |
|
| Short Term Trend: Very Good | |
| Overall Trend Score: 58 | |
| YTD Performance: -1.51% | |
| **Trend Scores & Views Are Only For Educational Purposes And Not For Investing | |
| 12Stocks.com: Top Performing Small Cap Index Stocks | ||||||||||||||||||||||||||||||||||||||||||||||||
 The top performing Small Cap Index stocks year to date are
Now, more recently, over last week, the top performing Small Cap Index stocks on the move are


|
||||||||||||||||||||||||||||||||||||||||||||||||
| 12Stocks.com: Investing in Smallcap Index using Exchange Traded Funds | |
|
The following table shows list of key exchange traded funds (ETF) that
help investors track Smallcap index. The following list also includes leveraged ETF funds that track twice or thrice the daily returns of Smallcap indices. Short or inverse ETF funds move in the opposite direction to the index they track and are useful during market pullbacks or during bear markets. Quick View: Move mouse or cursor over ETF symbol (ticker) to view short-term technical chart and over ETF name to view long term chart. Click on ticker or stock name for detailed view. Click on to add stock symbol to your watchlist and to view watchlist. |
12Stocks.com List of ETFs that track Smallcap Index
| Ticker | ETF Name | Watchlist | Recent Price | Smart Investing & Trading Score | Change % | Week % | Year-to-date % |
| IWM | iShares Russell 2000 | | 197.68 | 58 | -0.45 | 2.35 | -1.51% |
| IJR | iShares Core S&P Small-Cap | | 105.71 | 85 | -0.24 | 2.41 | -2.35% |
| VTWO | Vanguard Russell 2000 ETF | | 79.93 | 63 | -0.45 | 2.37 | -1.44% |
| IWN | iShares Russell 2000 Value | | 151.28 | 75 | -0.30 | 2.37 | -2.61% |
| IWO | iShares Russell 2000 Growth | | 251.27 | 58 | -0.44 | 2.44 | -0.38% |
| IJS | iShares S&P Small-Cap 600 Value | | 97.71 | 60 | -0.43 | 2.2 | -5.2% |
| IJT | iShares S&P Small-Cap 600 Growth | | 125.37 | 70 | -0.28 | 2.59 | 0.18% |
| XSLV | PowerShares S&P SmallCap Low Volatil ETF | | 42.94 | 73 | -0.26 | 1.8 | -2.74% |
| SBB | ProShares Short SmallCap600 | | 16.37 | 33 | -0.02 | -2.79 | 2.76% |
| SMLV | SPDR SSGA US Small Cap Low Volatil ETF | | 108.43 | 73 | -0.31 | 2.21 | -3.63% |
| SAA | ProShares Ultra SmallCap600 | | 23.01 | 58 | -0.60 | 5.55 | -7.78% |
| SDD | ProShares UltraShort SmallCap600 | | 19.49 | 42 | 1.35 | -4.18 | 5.77% |
| 12Stocks.com: Charts, Trends, Fundamental Data and Performances of SmallCap Stocks | |
|
We now take in-depth look at all SmallCap stocks including charts, multi-period performances and overall trends (as measured by Smart Investing & Trading Score). One can sort SmallCap stocks (click link to choose) by Daily, Weekly and by Year-to-Date performances. Also, one can sort by size of the company or by market capitalization. |
| Select Your Default Chart Type: | |||||
| |||||
| Click on stock symbol or name for detailed view. Click on to add stock symbol to your watchlist and to view watchlist. Quick View: Move mouse or cursor over "Daily" to quickly view daily technical stock chart and over "Weekly" to view weekly technical stock chart. | |||||

 | NVEC NVE Corporation |
| Sector: Technology | |
| SubSector: Semiconductor - Specialized | |
| MarketCap: 231.26 Millions | |
| Recent Price: 80.38 Smart Investing & Trading Score: 45 | |
| Day Percent Change: 1.97% Day Change: 1.55 | |
| Week Change: 3.05% Year-to-date Change: 2.5% | |
| NVEC Links: Profile News Message Board | |
| Charts:- Daily , Weekly | |
| Add NVEC to Watchlist: View: Get Complete NVEC Trend Analysis ➞ | |
 | UMH UMH Properties, Inc. |
| Sector: Financials | |
| SubSector: REIT - Diversified | |
| MarketCap: 433.353 Millions | |
| Recent Price: 15.69 Smart Investing & Trading Score: 83 | |
| Day Percent Change: 0.64% Day Change: 0.10 | |
| Week Change: 2.08% Year-to-date Change: 2.4% | |
| UMH Links: Profile News Message Board | |
| Charts:- Daily , Weekly | |
| Add UMH to Watchlist: View: Get Complete UMH Trend Analysis ➞ | |
 | ORC Orchid Island Capital, Inc. |
| Sector: Financials | |
| SubSector: Mortgage Investment | |
| MarketCap: 212.339 Millions | |
| Recent Price: 8.63 Smart Investing & Trading Score: 75 | |
| Day Percent Change: 0.12% Day Change: 0.01 | |
| Week Change: 4.48% Year-to-date Change: 2.4% | |
| ORC Links: Profile News Message Board | |
| Charts:- Daily , Weekly | |
| Add ORC to Watchlist: View: Get Complete ORC Trend Analysis ➞ | |
 | GABC German American Bancorp, Inc. |
| Sector: Financials | |
| SubSector: Regional - Midwest Banks | |
| MarketCap: 731.47 Millions | |
| Recent Price: 33.17 Smart Investing & Trading Score: 48 | |
| Day Percent Change: -0.15% Day Change: -0.05 | |
| Week Change: 0.03% Year-to-date Change: 2.3% | |
| GABC Links: Profile News Message Board | |
| Charts:- Daily , Weekly | |
| Add GABC to Watchlist: View: Get Complete GABC Trend Analysis ➞ | |
 | HI Hillenbrand, Inc. |
| Sector: Industrials | |
| SubSector: Diversified Machinery | |
| MarketCap: 1389.86 Millions | |
| Recent Price: 48.95 Smart Investing & Trading Score: 90 | |
| Day Percent Change: -0.47% Day Change: -0.23 | |
| Week Change: 1.94% Year-to-date Change: 2.3% | |
| HI Links: Profile News Message Board | |
| Charts:- Daily , Weekly | |
| Add HI to Watchlist: View: Get Complete HI Trend Analysis ➞ | |
 | WOR Worthington Industries, Inc. |
| Sector: Materials | |
| SubSector: Steel & Iron | |
| MarketCap: 1354.48 Millions | |
| Recent Price: 58.84 Smart Investing & Trading Score: 65 | |
| Day Percent Change: -1.28% Day Change: -0.76 | |
| Week Change: 2.6% Year-to-date Change: 2.2% | |
| WOR Links: Profile News Message Board | |
| Charts:- Daily , Weekly | |
| Add WOR to Watchlist: View: Get Complete WOR Trend Analysis ➞ | |
 | TRN Trinity Industries, Inc. |
| Sector: Transports | |
| SubSector: Railroads | |
| MarketCap: 2058.22 Millions | |
| Recent Price: 27.18 Smart Investing & Trading Score: 68 | |
| Day Percent Change: 1.57% Day Change: 0.42 | |
| Week Change: 2.41% Year-to-date Change: 2.2% | |
| TRN Links: Profile News Message Board | |
| Charts:- Daily , Weekly | |
| Add TRN to Watchlist: View: Get Complete TRN Trend Analysis ➞ | |
 | LILA Liberty Latin America Ltd. |
| Sector: Technology | |
| SubSector: CATV Systems | |
| MarketCap: 2092.62 Millions | |
| Recent Price: 7.47 Smart Investing & Trading Score: 93 | |
| Day Percent Change: 0.40% Day Change: 0.03 | |
| Week Change: 2.47% Year-to-date Change: 2.2% | |
| LILA Links: Profile News Message Board | |
| Charts:- Daily , Weekly | |
| Add LILA to Watchlist: View: Get Complete LILA Trend Analysis ➞ | |
 | TPH TRI Pointe Group, Inc. |
| Sector: Industrials | |
| SubSector: Residential Construction | |
| MarketCap: 1140.06 Millions | |
| Recent Price: 36.17 Smart Investing & Trading Score: 70 | |
| Day Percent Change: -1.34% Day Change: -0.49 | |
| Week Change: 3.55% Year-to-date Change: 2.2% | |
| TPH Links: Profile News Message Board | |
| Charts:- Daily , Weekly | |
| Add TPH to Watchlist: View: Get Complete TPH Trend Analysis ➞ | |
 | HNI HNI Corporation |
| Sector: Consumer Staples | |
| SubSector: Business Equipment | |
| MarketCap: 1053.67 Millions | |
| Recent Price: 42.73 Smart Investing & Trading Score: 58 | |
| Day Percent Change: -1.48% Day Change: -0.64 | |
| Week Change: 1.4% Year-to-date Change: 2.2% | |
| HNI Links: Profile News Message Board | |
| Charts:- Daily , Weekly | |
| Add HNI to Watchlist: View: Get Complete HNI Trend Analysis ➞ | |
 | NGVT Ingevity Corporation |
| Sector: Materials | |
| SubSector: Specialty Chemicals | |
| MarketCap: 1325.47 Millions | |
| Recent Price: 48.23 Smart Investing & Trading Score: 100 | |
| Day Percent Change: -1.37% Day Change: -0.67 | |
| Week Change: 8.53% Year-to-date Change: 2.1% | |
| NGVT Links: Profile News Message Board | |
| Charts:- Daily , Weekly | |
| Add NGVT to Watchlist: View: Get Complete NGVT Trend Analysis ➞ | |
 | RGR Sturm, Ruger & Company, Inc. |
| Sector: Industrials | |
| SubSector: Aerospace/Defense Products & Services | |
| MarketCap: 752 Millions | |
| Recent Price: 46.42 Smart Investing & Trading Score: 63 | |
| Day Percent Change: -1.00% Day Change: -0.47 | |
| Week Change: -0.71% Year-to-date Change: 2.1% | |
| RGR Links: Profile News Message Board | |
| Charts:- Daily , Weekly | |
| Add RGR to Watchlist: View: Get Complete RGR Trend Analysis ➞ | |
 | IMMR Immersion Corporation |
| Sector: Technology | |
| SubSector: Application Software | |
| MarketCap: 173.462 Millions | |
| Recent Price: 7.21 Smart Investing & Trading Score: 36 | |
| Day Percent Change: 0.56% Day Change: 0.04 | |
| Week Change: 0.56% Year-to-date Change: 2.1% | |
| IMMR Links: Profile News Message Board | |
| Charts:- Daily , Weekly | |
| Add IMMR to Watchlist: View: Get Complete IMMR Trend Analysis ➞ | |
 | PBPB Potbelly Corporation |
| Sector: Services & Goods | |
| SubSector: Specialty Eateries | |
| MarketCap: 58.8 Millions | |
| Recent Price: 10.64 Smart Investing & Trading Score: 50 | |
| Day Percent Change: -2.03% Day Change: -0.22 | |
| Week Change: 1.92% Year-to-date Change: 2.1% | |
| PBPB Links: Profile News Message Board | |
| Charts:- Daily , Weekly | |
| Add PBPB to Watchlist: View: Get Complete PBPB Trend Analysis ➞ | |
 | TK Teekay Corporation |
| Sector: Transports | |
| SubSector: Shipping | |
| MarketCap: 257.914 Millions | |
| Recent Price: 7.30 Smart Investing & Trading Score: 35 | |
| Day Percent Change: 0.27% Day Change: 0.02 | |
| Week Change: 0.55% Year-to-date Change: 2.1% | |
| TK Links: Profile News Message Board | |
| Charts:- Daily , Weekly | |
| Add TK to Watchlist: View: Get Complete TK Trend Analysis ➞ | |
 | ITCI Intra-Cellular Therapies, Inc. |
| Sector: Health Care | |
| SubSector: Biotechnology | |
| MarketCap: 991.885 Millions | |
| Recent Price: 73.12 Smart Investing & Trading Score: 83 | |
| Day Percent Change: -1.20% Day Change: -0.89 | |
| Week Change: 1.04% Year-to-date Change: 2.1% | |
| ITCI Links: Profile News Message Board | |
| Charts:- Daily , Weekly | |
| Add ITCI to Watchlist: View: Get Complete ITCI Trend Analysis ➞ | |
 | KAI Kadant Inc. |
| Sector: Industrials | |
| SubSector: Diversified Machinery | |
| MarketCap: 787.116 Millions | |
| Recent Price: 285.89 Smart Investing & Trading Score: 45 | |
| Day Percent Change: -1.25% Day Change: -3.61 | |
| Week Change: 1.38% Year-to-date Change: 2.0% | |
| KAI Links: Profile News Message Board | |
| Charts:- Daily , Weekly | |
| Add KAI to Watchlist: View: Get Complete KAI Trend Analysis ➞ | |
 | MNRO Monro, Inc. |
| Sector: Consumer Staples | |
| SubSector: Auto Parts | |
| MarketCap: 1514.89 Millions | |
| Recent Price: 29.91 Smart Investing & Trading Score: 42 | |
| Day Percent Change: -2.41% Day Change: -0.74 | |
| Week Change: 1.12% Year-to-date Change: 1.9% | |
| MNRO Links: Profile News Message Board | |
| Charts:- Daily , Weekly | |
| Add MNRO to Watchlist: View: Get Complete MNRO Trend Analysis ➞ | |
 | LILAK Liberty Latin America Ltd. |
| Sector: Technology | |
| SubSector: CATV Systems | |
| MarketCap: 1210.32 Millions | |
| Recent Price: 7.48 Smart Investing & Trading Score: 93 | |
| Day Percent Change: 0.47% Day Change: 0.04 | |
| Week Change: 3.03% Year-to-date Change: 1.9% | |
| LILAK Links: Profile News Message Board | |
| Charts:- Daily , Weekly | |
| Add LILAK to Watchlist: View: Get Complete LILAK Trend Analysis ➞ | |
 | OGS ONE Gas, Inc. |
| Sector: Utilities | |
| SubSector: Gas Utilities | |
| MarketCap: 4051.17 Millions | |
| Recent Price: 64.93 Smart Investing & Trading Score: 93 | |
| Day Percent Change: 0.65% Day Change: 0.42 | |
| Week Change: 0.84% Year-to-date Change: 1.9% | |
| OGS Links: Profile News Message Board | |
| Charts:- Daily , Weekly | |
| Add OGS to Watchlist: View: Get Complete OGS Trend Analysis ➞ | |
 | KNSA Kiniksa Pharmaceuticals, Ltd. |
| Sector: Health Care | |
| SubSector: Biotechnology | |
| MarketCap: 780.285 Millions | |
| Recent Price: 17.86 Smart Investing & Trading Score: 47 | |
| Day Percent Change: 1.02% Day Change: 0.18 | |
| Week Change: 5.49% Year-to-date Change: 1.8% | |
| KNSA Links: Profile News Message Board | |
| Charts:- Daily , Weekly | |
| Add KNSA to Watchlist: View: Get Complete KNSA Trend Analysis ➞ | |
 | ALRM Alarm.com Holdings, Inc. |
| Sector: Technology | |
| SubSector: Application Software | |
| MarketCap: 2035.62 Millions | |
| Recent Price: 65.79 Smart Investing & Trading Score: 58 | |
| Day Percent Change: -0.54% Day Change: -0.36 | |
| Week Change: 2.62% Year-to-date Change: 1.8% | |
| ALRM Links: Profile News Message Board | |
| Charts:- Daily , Weekly | |
| Add ALRM to Watchlist: View: Get Complete ALRM Trend Analysis ➞ | |
 | CLFD Clearfield, Inc. |
| Sector: Technology | |
| SubSector: Communication Equipment | |
| MarketCap: 138.439 Millions | |
| Recent Price: 29.60 Smart Investing & Trading Score: 68 | |
| Day Percent Change: 0.58% Day Change: 0.17 | |
| Week Change: 4.67% Year-to-date Change: 1.8% | |
| CLFD Links: Profile News Message Board | |
| Charts:- Daily , Weekly | |
| Add CLFD to Watchlist: View: Get Complete CLFD Trend Analysis ➞ | |
 | TRNS Transcat, Inc. |
| Sector: Technology | |
| SubSector: Scientific & Technical Instruments | |
| MarketCap: 216.653 Millions | |
| Recent Price: 111.27 Smart Investing & Trading Score: 100 | |
| Day Percent Change: -3.23% Day Change: -3.71 | |
| Week Change: 2.99% Year-to-date Change: 1.8% | |
| TRNS Links: Profile News Message Board | |
| Charts:- Daily , Weekly | |
| Add TRNS to Watchlist: View: Get Complete TRNS Trend Analysis ➞ | |
 | RYAM Rayonier Advanced Materials Inc. |
| Sector: Materials | |
| SubSector: Chemicals - Major Diversified | |
| MarketCap: 116.736 Millions | |
| Recent Price: 4.12 Smart Investing & Trading Score: 10 | |
| Day Percent Change: 1.48% Day Change: 0.06 | |
| Week Change: -4.19% Year-to-date Change: 1.7% | |
| RYAM Links: Profile News Message Board | |
| Charts:- Daily , Weekly | |
| Add RYAM to Watchlist: View: Get Complete RYAM Trend Analysis ➞ | |
| Too many stocks? View smallcap stocks filtered by marketcap & sector |
| Marketcap: All SmallCap Stocks (default-no microcap), Large, Mid-Range, Small & MicroCap |
| Sector: Tech, Finance, Energy, Staples, Retail, Industrial, Materials, Utilities & Medical |
|
Best Stocks Today 12Stocks.com |
© 2024 12Stocks.com Terms & Conditions Privacy Contact Us
All Information Provided Only For Education And Not To Be Used For Investing or Trading. See Terms & Conditions


One More Thing ... Get Best Stocks Delivered Daily!
Never Ever Miss A Move With Our Top Ten Stocks Lists
Find Best Stocks In Any Market - Bull or Bear Market
Take A Peek At Our Top Ten Stocks Lists: Daily, Weekly, Year-to-Date & Top Trends
Find Best Stocks In Any Market - Bull or Bear Market
Take A Peek At Our Top Ten Stocks Lists: Daily, Weekly, Year-to-Date & Top Trends
Smallcap Stocks With Best Up Trends [0-bearish to 100-bullish]: B. Riley[100], Ribbon [100], Group 1[100], Trustmark [100], MBIA [100], Integer [100], EchoStar [100], Comstock Resources[100], Vishay Inter[100], First Ban[100], Jamf Holding[100]
Best Smallcap Stocks Year-to-Date:
CareMax [574.23%], Janux [352.07%], Viking [249.65%], Alpine Immune[239.13%], Longboard [223.4%], Avidity Biosciences[177.71%], Arcutis Bio[170.9%], Super Micro[165.5%], Vera [149.61%], Hippo [130.79%], Y-mAbs [124.19%] Best Smallcap Stocks This Week:
Matterport [166.09%], B. Riley[48.82%], Seres [30.29%], Riot Blockchain[30.12%], CareMax [27.24%], Ribbon [25.97%], ProKidney [23.28%], SoundHound AI[22.54%], Cipher Mining[22.14%], Hibbett Sports[21.61%], Cullinan Oncology[20.69%] Best Smallcap Stocks Daily:
B. Riley[36.97%], Ribbon [26.46%], Babcock & Wilcox Enterprises[15.57%], Cullinan Oncology[13.55%], Amneal [12.04%], Comtech Tele[10.76%], Innodata [10.28%], Gritstone Oncology[10.06%], Navitas Semiconductor[8.83%], Eyenovia [8.68%], K12 [8.64%]