
 Login Sign Up


| |||||
 |  | ||||

| 12Stocks.com Market Intelligence |
Best SmallCap Stocks
|
| In a hurry? Small Cap Stock Lists: Performance Trends Table, Stock Charts
Sort Small Cap stocks: Daily, Weekly, Year-to-Date, Market Cap & Trends. Filter Small Cap stocks list by sector: Show all, Tech, Finance, Energy, Staples, Retail, Industrial, Materials, Utilities and HealthCare Filter Small Cap stocks list by size: All Large Medium Small and MicroCap |
| 12Stocks.com Small Cap Stocks Performances & Trends Daily | |||||||||
|
|  The overall Smart Investing & Trading Score is 87 (0-bearish to 100-bullish) which puts Small Cap index in short term bullish trend. The Smart Investing & Trading Score from previous trading session is 82 and hence an improvement of trend.
| ||||||||
Here are the Smart Investing & Trading Scores of the most requested small cap stocks at 12Stocks.com (click stock name for detailed review):
|


| 12Stocks.com: Investing in Smallcap Index with Stocks | |
|
The following table helps investors and traders sort through current performance and trends (as measured by Smart Investing & Trading Score) of various
stocks in the Smallcap Index. Quick View: Move mouse or cursor over stock symbol (ticker) to view short-term technical chart and over stock name to view long term chart. Click on  to add stock symbol to your watchlist and to add stock symbol to your watchlist and  to view watchlist. Click on any ticker or stock name for detailed market intelligence report for that stock. to view watchlist. Click on any ticker or stock name for detailed market intelligence report for that stock. |
12Stocks.com Performance of Stocks in Smallcap Index
| Ticker | Stock Name | Watchlist | Category | Recent Price | Smart Investing & Trading Score | Change % | YTD Change% |
| NATH | Nathan s |   | Services & Goods | 66.83 | 49 | 0.32 | -14.33% |
| NOG | Northern Oil | | Energy | 40.72 | 68 | 0.32 | 9.85% |
| ESRT | Empire State | | Financials | 9.41 | 57 | 0.32 | -2.89% |
| NUVB | Nuvation Bio | | Health Care | 3.19 | 61 | 0.31 | 110.56% |
| ABR | Arbor Realty | | Financials | 13.46 | 87 | 0.30 | -11.33% |
| SYNA | Synaptics | | Technology | 91.47 | 59 | 0.30 | -19.82% |
| MBWM | Mercantile Bank | | Financials | 39.50 | 100 | 0.30 | -2.18% |
| SHOO | Steven Madden | | Consumer Staples | 40.61 | 57 | 0.30 | -3.31% |
| YORW | York Water | | Utilities | 36.87 | 88 | 0.30 | -4.53% |
| III | Information Services | | Technology | 3.37 | 42 | 0.30 | -28.45% |
| MATX | Matson | | Transports | 112.03 | 90 | 0.30 | 2.22% |
| TSVT | 2seventy bio | | Health Care | 4.96 | 69 | 0.30 | 14.68% |
| PRGS | Progress | | Technology | 51.34 | 74 | 0.29 | -5.45% |
| USNA | USANA Health | | Health Care | 44.74 | 42 | 0.29 | -16.53% |
| POR | Portland General | | Utilities | 44.43 | 95 | 0.29 | 2.51% |
| HTH | Hilltop | | Financials | 31.23 | 95 | 0.29 | -11.30% |
| PRLB | Proto Labs | | Industrials | 31.47 | 42 | 0.29 | -19.22% |
| KURA | Kura Oncology | | Health Care | 21.07 | 77 | 0.29 | 46.52% |
| RPHM | Reneo | | Health Care | 1.74 | 88 | 0.29 | 7.41% |
| PAYO | Payoneer Global | | Technology | 5.22 | 100 | 0.29 | -1.32% |
| LVWR | LiveWire Group | | Services & Goods | 6.84 | 49 | 0.29 | -41.24% |
| CALM | Cal-Maine Foods | | Consumer Staples | 57.08 | 43 | 0.28 | -0.54% |
| GEF | Greif | | Consumer Staples | 63.46 | 74 | 0.28 | -3.25% |
| CARA | Cara | | Health Care | 0.79 | 57 | 0.28 | 6.62% |
| ITCI | Intra-Cellular Therapies | | Health Care | 71.21 | 68 | 0.28 | -0.57% |


| Too many stocks? View smallcap stocks filtered by marketcap & sector |
| Marketcap: All SmallCap Stocks (default-no microcap), Large, Mid-Range, Small |
| Smallcap Sector: Tech, Finance, Energy, Staples, Retail, Industrial, Materials, & Medical |
|
Get the most comprehensive stock market coverage daily at 12Stocks.com ➞ Best Stocks Today ➞ Best Stocks Weekly ➞ Best Stocks Year-to-Date ➞ Best Stocks Trends ➞  Best Stocks Today 12Stocks.com Best Nasdaq Stocks ➞ Best S&P 500 Stocks ➞ Best Tech Stocks ➞ Best Biotech Stocks ➞ |
| Detailed Overview of SmallCap Stocks |
| SmallCap Technical Overview, Leaders & Laggards, Top SmallCap ETF Funds & Detailed SmallCap Stocks List, Charts, Trends & More |
| Smallcap: Technical Analysis, Trends & YTD Performance | |
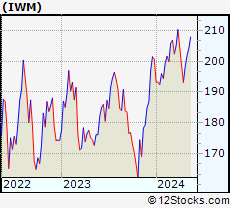
| SmallCap segment as represented by
IWM, an exchange-traded fund [ETF], holds basket of thousands of smallcap stocks from across all major sectors of the US stock market. The smallcap index (contains stocks like Riverbed & Sotheby's) is up by 2.12% and is currently underperforming the overall market by -6% year-to-date. Below is a quick view of technical charts and trends: | |
 IWM Weekly Chart |
|
| Long Term Trend: Very Good | |
| Medium Term Trend: Very Good | |
 IWM Daily Chart |
|
| Short Term Trend: Very Good | |
| Overall Trend Score: 87 | |
| YTD Performance: 2.12% | |
| **Trend Scores & Views Are Only For Educational Purposes And Not For Investing | |
| 12Stocks.com: Top Performing Small Cap Index Stocks | ||||||||||||||||||||||||||||||||||||||||||||||||
 The top performing Small Cap Index stocks year to date are
Now, more recently, over last week, the top performing Small Cap Index stocks on the move are


|
||||||||||||||||||||||||||||||||||||||||||||||||
| 12Stocks.com: Investing in Smallcap Index using Exchange Traded Funds | |
|
The following table shows list of key exchange traded funds (ETF) that
help investors track Smallcap index. The following list also includes leveraged ETF funds that track twice or thrice the daily returns of Smallcap indices. Short or inverse ETF funds move in the opposite direction to the index they track and are useful during market pullbacks or during bear markets. Quick View: Move mouse or cursor over ETF symbol (ticker) to view short-term technical chart and over ETF name to view long term chart. Click on ticker or stock name for detailed view. Click on to add stock symbol to your watchlist and to view watchlist. |
12Stocks.com List of ETFs that track Smallcap Index
| Ticker | ETF Name | Watchlist | Recent Price | Smart Investing & Trading Score | Change % | Week % | Year-to-date % |
| IWM | iShares Russell 2000 | | 204.97 | 87 | 0.22 | 1.52 | 2.12% |
| IJR | iShares Core S&P Small-Cap | | 108.62 | 100 | 0.33 | 1.39 | 0.34% |
| VTWO | Vanguard Russell 2000 ETF | | 82.84 | 82 | 0.22 | 1.51 | 2.15% |
| IWN | iShares Russell 2000 Value | | 155.63 | 100 | -0.01 | 0.92 | 0.19% |
| IWO | iShares Russell 2000 Growth | | 262.30 | 69 | 0.49 | 2.11 | 4% |
| IJS | iShares S&P Small-Cap 600 Value | | 99.68 | 82 | -0.07 | 0.97 | -3.29% |
| IJT | iShares S&P Small-Cap 600 Growth | | 129.84 | 95 | 0.56 | 1.63 | 3.76% |
| XSLV | PowerShares S&P SmallCap Low Volatil ETF | | 44.00 | 100 | 0.96 | 1.8 | -0.34% |
| SAA | ProShares Ultra SmallCap600 | | 24.39 | 95 | 1.16 | 3.39 | -2.24% |
| SMLV | SPDR SSGA US Small Cap Low Volatil ETF | | 110.48 | 100 | -0.10 | 0.72 | -1.81% |
| SBB | ProShares Short SmallCap600 | | 15.97 | 0 | -0.50 | -1.18 | 0.25% |
| SDD | ProShares UltraShort SmallCap600 | | 18.22 | 10 | -1.10 | -3.33 | -1.13% |
| 12Stocks.com: Charts, Trends, Fundamental Data and Performances of SmallCap Stocks | |
|
We now take in-depth look at all SmallCap stocks including charts, multi-period performances and overall trends (as measured by Smart Investing & Trading Score). One can sort SmallCap stocks (click link to choose) by Daily, Weekly and by Year-to-Date performances. Also, one can sort by size of the company or by market capitalization. |
| Select Your Default Chart Type: | |||||
| |||||
| Click on stock symbol or name for detailed view. Click on to add stock symbol to your watchlist and to view watchlist. Quick View: Move mouse or cursor over "Daily" to quickly view daily technical stock chart and over "Weekly" to view weekly technical stock chart. | |||||

 | NATH Nathan s Famous, Inc. |
| Sector: Services & Goods | |
| SubSector: Restaurants | |
| MarketCap: 211.77 Millions | |
| Recent Price: 66.83 Smart Investing & Trading Score: 49 | |
| Day Percent Change: 0.32% Day Change: 0.21 | |
| Week Change: 0.21% Year-to-date Change: -14.3% | |
| NATH Links: Profile News Message Board | |
| Charts:- Daily , Weekly | |
| Add NATH to Watchlist: View: Get Complete NATH Trend Analysis ➞ | |
 | NOG Northern Oil and Gas, Inc. |
| Sector: Energy | |
| SubSector: Oil & Gas Drilling & Exploration | |
| MarketCap: 301.939 Millions | |
| Recent Price: 40.72 Smart Investing & Trading Score: 68 | |
| Day Percent Change: 0.32% Day Change: 0.13 | |
| Week Change: 1.17% Year-to-date Change: 9.9% | |
| NOG Links: Profile News Message Board | |
| Charts:- Daily , Weekly | |
| Add NOG to Watchlist: View: Get Complete NOG Trend Analysis ➞ | |
 | ESRT Empire State Realty Trust, Inc. |
| Sector: Financials | |
| SubSector: REIT - Diversified | |
| MarketCap: 1632.13 Millions | |
| Recent Price: 9.41 Smart Investing & Trading Score: 57 | |
| Day Percent Change: 0.32% Day Change: 0.03 | |
| Week Change: 1.18% Year-to-date Change: -2.9% | |
| ESRT Links: Profile News Message Board | |
| Charts:- Daily , Weekly | |
| Add ESRT to Watchlist: View: Get Complete ESRT Trend Analysis ➞ | |
 | NUVB Nuvation Bio Inc. |
| Sector: Health Care | |
| SubSector: Biotechnology | |
| MarketCap: 381 Millions | |
| Recent Price: 3.19 Smart Investing & Trading Score: 61 | |
| Day Percent Change: 0.31% Day Change: 0.01 | |
| Week Change: -0.78% Year-to-date Change: 110.6% | |
| NUVB Links: Profile News Message Board | |
| Charts:- Daily , Weekly | |
| Add NUVB to Watchlist: View: Get Complete NUVB Trend Analysis ➞ | |
 | ABR Arbor Realty Trust, Inc. |
| Sector: Financials | |
| SubSector: Mortgage Investment | |
| MarketCap: 648.939 Millions | |
| Recent Price: 13.46 Smart Investing & Trading Score: 87 | |
| Day Percent Change: 0.30% Day Change: 0.04 | |
| Week Change: 4.42% Year-to-date Change: -11.3% | |
| ABR Links: Profile News Message Board | |
| Charts:- Daily , Weekly | |
| Add ABR to Watchlist: View: Get Complete ABR Trend Analysis ➞ | |
 | SYNA Synaptics Incorporated |
| Sector: Technology | |
| SubSector: Application Software | |
| MarketCap: 1822.82 Millions | |
| Recent Price: 91.47 Smart Investing & Trading Score: 59 | |
| Day Percent Change: 0.30% Day Change: 0.27 | |
| Week Change: 1.28% Year-to-date Change: -19.8% | |
| SYNA Links: Profile News Message Board | |
| Charts:- Daily , Weekly | |
| Add SYNA to Watchlist: View: Get Complete SYNA Trend Analysis ➞ | |
 | MBWM Mercantile Bank Corporation |
| Sector: Financials | |
| SubSector: Regional - Midwest Banks | |
| MarketCap: 372.77 Millions | |
| Recent Price: 39.50 Smart Investing & Trading Score: 100 | |
| Day Percent Change: 0.30% Day Change: 0.12 | |
| Week Change: 2.68% Year-to-date Change: -2.2% | |
| MBWM Links: Profile News Message Board | |
| Charts:- Daily , Weekly | |
| Add MBWM to Watchlist: View: Get Complete MBWM Trend Analysis ➞ | |
 | SHOO Steven Madden, Ltd. |
| Sector: Consumer Staples | |
| SubSector: Textile - Apparel Footwear & Accessories | |
| MarketCap: 1756.3 Millions | |
| Recent Price: 40.61 Smart Investing & Trading Score: 57 | |
| Day Percent Change: 0.30% Day Change: 0.12 | |
| Week Change: 2.58% Year-to-date Change: -3.3% | |
| SHOO Links: Profile News Message Board | |
| Charts:- Daily , Weekly | |
| Add SHOO to Watchlist: View: Get Complete SHOO Trend Analysis ➞ | |
 | YORW The York Water Company |
| Sector: Utilities | |
| SubSector: Water Utilities | |
| MarketCap: 539.502 Millions | |
| Recent Price: 36.87 Smart Investing & Trading Score: 88 | |
| Day Percent Change: 0.30% Day Change: 0.11 | |
| Week Change: -0.08% Year-to-date Change: -4.5% | |
| YORW Links: Profile News Message Board | |
| Charts:- Daily , Weekly | |
| Add YORW to Watchlist: View: Get Complete YORW Trend Analysis ➞ | |
 | III Information Services Group, Inc. |
| Sector: Technology | |
| SubSector: Information Technology Services | |
| MarketCap: 166.968 Millions | |
| Recent Price: 3.37 Smart Investing & Trading Score: 42 | |
| Day Percent Change: 0.30% Day Change: 0.01 | |
| Week Change: 0.9% Year-to-date Change: -28.5% | |
| III Links: Profile News Message Board | |
| Charts:- Daily , Weekly | |
| Add III to Watchlist: View: Get Complete III Trend Analysis ➞ | |
 | MATX Matson, Inc. |
| Sector: Transports | |
| SubSector: Shipping | |
| MarketCap: 1509.94 Millions | |
| Recent Price: 112.03 Smart Investing & Trading Score: 90 | |
| Day Percent Change: 0.30% Day Change: 0.34 | |
| Week Change: -1.17% Year-to-date Change: 2.2% | |
| MATX Links: Profile News Message Board | |
| Charts:- Daily , Weekly | |
| Add MATX to Watchlist: View: Get Complete MATX Trend Analysis ➞ | |
 | TSVT 2seventy bio, Inc. |
| Sector: Health Care | |
| SubSector: Biotechnology | |
| MarketCap: 504 Millions | |
| Recent Price: 4.96 Smart Investing & Trading Score: 69 | |
| Day Percent Change: 0.30% Day Change: 0.01 | |
| Week Change: 3.77% Year-to-date Change: 14.7% | |
| TSVT Links: Profile News Message Board | |
| Charts:- Daily , Weekly | |
| Add TSVT to Watchlist: View: Get Complete TSVT Trend Analysis ➞ | |
 | PRGS Progress Software Corporation |
| Sector: Technology | |
| SubSector: Application Software | |
| MarketCap: 1407.22 Millions | |
| Recent Price: 51.34 Smart Investing & Trading Score: 74 | |
| Day Percent Change: 0.29% Day Change: 0.15 | |
| Week Change: 1.64% Year-to-date Change: -5.5% | |
| PRGS Links: Profile News Message Board | |
| Charts:- Daily , Weekly | |
| Add PRGS to Watchlist: View: Get Complete PRGS Trend Analysis ➞ | |
 | USNA USANA Health Sciences, Inc. |
| Sector: Health Care | |
| SubSector: Drug Related Products | |
| MarketCap: 1185.13 Millions | |
| Recent Price: 44.74 Smart Investing & Trading Score: 42 | |
| Day Percent Change: 0.29% Day Change: 0.13 | |
| Week Change: -1.78% Year-to-date Change: -16.5% | |
| USNA Links: Profile News Message Board | |
| Charts:- Daily , Weekly | |
| Add USNA to Watchlist: View: Get Complete USNA Trend Analysis ➞ | |
 | POR Portland General Electric Company |
| Sector: Utilities | |
| SubSector: Electric Utilities | |
| MarketCap: 4291.84 Millions | |
| Recent Price: 44.43 Smart Investing & Trading Score: 95 | |
| Day Percent Change: 0.29% Day Change: 0.13 | |
| Week Change: 1.51% Year-to-date Change: 2.5% | |
| POR Links: Profile News Message Board | |
| Charts:- Daily , Weekly | |
| Add POR to Watchlist: View: Get Complete POR Trend Analysis ➞ | |
 | HTH Hilltop Holdings Inc. |
| Sector: Financials | |
| SubSector: Mortgage Investment | |
| MarketCap: 1317.89 Millions | |
| Recent Price: 31.23 Smart Investing & Trading Score: 95 | |
| Day Percent Change: 0.29% Day Change: 0.09 | |
| Week Change: -0.29% Year-to-date Change: -11.3% | |
| HTH Links: Profile News Message Board | |
| Charts:- Daily , Weekly | |
| Add HTH to Watchlist: View: Get Complete HTH Trend Analysis ➞ | |
 | PRLB Proto Labs, Inc. |
| Sector: Industrials | |
| SubSector: Machine Tools & Accessories | |
| MarketCap: 1944.78 Millions | |
| Recent Price: 31.47 Smart Investing & Trading Score: 42 | |
| Day Percent Change: 0.29% Day Change: 0.09 | |
| Week Change: 1.22% Year-to-date Change: -19.2% | |
| PRLB Links: Profile News Message Board | |
| Charts:- Daily , Weekly | |
| Add PRLB to Watchlist: View: Get Complete PRLB Trend Analysis ➞ | |
 | KURA Kura Oncology, Inc. |
| Sector: Health Care | |
| SubSector: Biotechnology | |
| MarketCap: 401.885 Millions | |
| Recent Price: 21.07 Smart Investing & Trading Score: 77 | |
| Day Percent Change: 0.29% Day Change: 0.06 | |
| Week Change: 2.13% Year-to-date Change: 46.5% | |
| KURA Links: Profile News Message Board | |
| Charts:- Daily , Weekly | |
| Add KURA to Watchlist: View: Get Complete KURA Trend Analysis ➞ | |
 | RPHM Reneo Pharmaceuticals, Inc. |
| Sector: Health Care | |
| SubSector: Biotechnology | |
| MarketCap: 233 Millions | |
| Recent Price: 1.74 Smart Investing & Trading Score: 88 | |
| Day Percent Change: 0.29% Day Change: 0.00 | |
| Week Change: 0.58% Year-to-date Change: 7.4% | |
| RPHM Links: Profile News Message Board | |
| Charts:- Daily , Weekly | |
| Add RPHM to Watchlist: View: Get Complete RPHM Trend Analysis ➞ | |
 | PAYO Payoneer Global Inc. |
| Sector: Technology | |
| SubSector: Software - Infrastructure | |
| MarketCap: 1710 Millions | |
| Recent Price: 5.22 Smart Investing & Trading Score: 100 | |
| Day Percent Change: 0.29% Day Change: 0.01 | |
| Week Change: 3.06% Year-to-date Change: -1.3% | |
| PAYO Links: Profile News Message Board | |
| Charts:- Daily , Weekly | |
| Add PAYO to Watchlist: View: Get Complete PAYO Trend Analysis ➞ | |
 | LVWR LiveWire Group, Inc. |
| Sector: Services & Goods | |
| SubSector: Auto Manufacturers | |
| MarketCap: 2400 Millions | |
| Recent Price: 6.84 Smart Investing & Trading Score: 49 | |
| Day Percent Change: 0.29% Day Change: 0.02 | |
| Week Change: -1.58% Year-to-date Change: -41.2% | |
| LVWR Links: Profile News Message Board | |
| Charts:- Daily , Weekly | |
| Add LVWR to Watchlist: View: Get Complete LVWR Trend Analysis ➞ | |
 | CALM Cal-Maine Foods, Inc. |
| Sector: Consumer Staples | |
| SubSector: Food - Major Diversified | |
| MarketCap: 2177.13 Millions | |
| Recent Price: 57.08 Smart Investing & Trading Score: 43 | |
| Day Percent Change: 0.28% Day Change: 0.16 | |
| Week Change: 0.49% Year-to-date Change: -0.5% | |
| CALM Links: Profile News Message Board | |
| Charts:- Daily , Weekly | |
| Add CALM to Watchlist: View: Get Complete CALM Trend Analysis ➞ | |
 | GEF Greif, Inc. |
| Sector: Consumer Staples | |
| SubSector: Packaging & Containers | |
| MarketCap: 1563.03 Millions | |
| Recent Price: 63.46 Smart Investing & Trading Score: 74 | |
| Day Percent Change: 0.28% Day Change: 0.18 | |
| Week Change: 0.89% Year-to-date Change: -3.3% | |
| GEF Links: Profile News Message Board | |
| Charts:- Daily , Weekly | |
| Add GEF to Watchlist: View: Get Complete GEF Trend Analysis ➞ | |
 | CARA Cara Therapeutics, Inc. |
| Sector: Health Care | |
| SubSector: Biotechnology | |
| MarketCap: 597.985 Millions | |
| Recent Price: 0.79 Smart Investing & Trading Score: 57 | |
| Day Percent Change: 0.28% Day Change: 0.00 | |
| Week Change: 1.8% Year-to-date Change: 6.6% | |
| CARA Links: Profile News Message Board | |
| Charts:- Daily , Weekly | |
| Add CARA to Watchlist: View: Get Complete CARA Trend Analysis ➞ | |
 | ITCI Intra-Cellular Therapies, Inc. |
| Sector: Health Care | |
| SubSector: Biotechnology | |
| MarketCap: 991.885 Millions | |
| Recent Price: 71.21 Smart Investing & Trading Score: 68 | |
| Day Percent Change: 0.28% Day Change: 0.20 | |
| Week Change: 3.5% Year-to-date Change: -0.6% | |
| ITCI Links: Profile News Message Board | |
| Charts:- Daily , Weekly | |
| Add ITCI to Watchlist: View: Get Complete ITCI Trend Analysis ➞ | |
| Too many stocks? View smallcap stocks filtered by marketcap & sector |
| Marketcap: All SmallCap Stocks (default-no microcap), Large, Mid-Range, Small & MicroCap |
| Sector: Tech, Finance, Energy, Staples, Retail, Industrial, Materials, Utilities & Medical |
|
Best Stocks Today 12Stocks.com |
© 2024 12Stocks.com Terms & Conditions Privacy Contact Us
All Information Provided Only For Education And Not To Be Used For Investing or Trading. See Terms & Conditions


One More Thing ... Get Best Stocks Delivered Daily!
Never Ever Miss A Move With Our Top Ten Stocks Lists
Find Best Stocks In Any Market - Bull or Bear Market
Take A Peek At Our Top Ten Stocks Lists: Daily, Weekly, Year-to-Date & Top Trends
Find Best Stocks In Any Market - Bull or Bear Market
Take A Peek At Our Top Ten Stocks Lists: Daily, Weekly, Year-to-Date & Top Trends
Smallcap Stocks With Best Up Trends [0-bearish to 100-bullish]: Design [100], Ambac Financial[100], Summit [100], EverQuote [100], Zeta Global[100], Coca-Cola Consolidated[100], J & J Snack Foods[100], Sterling Construction[100], Vanda [100], CPI Card[100], Semrush [100]
Best Smallcap Stocks Year-to-Date:
CareMax [570.1%], Janux [472.36%], Viking [327.78%], Longboard [260.8%], Alpine Immune[239.34%], Bakkt [226.91%], Vera [190.7%], Super Micro[188.22%], Cullinan Oncology[187.89%], Avidity Biosciences[180.86%], Y-mAbs [152.49%] Best Smallcap Stocks This Week:
Perficient [52.32%], Thoughtworks Holding[34.22%], Trupanion [28.72%], DASAN Zhone[26.29%], Great Lakes[25.72%], Workhorse Group[24.5%], Design [23.42%], Ambac Financial[22.97%], P3 Health[22.36%], Outset Medical[21.09%], Summit [20.96%] Best Smallcap Stocks Daily:
Design [28.85%], Great Lakes[24.29%], Thoughtworks Holding[19.84%], Ambac Financial[19.31%], Summit [18.79%], EverQuote [18.40%], Origin Materials[18.38%], Zeta Global[18.35%], FibroGen [18.10%], Coca-Cola Consolidated[17.65%], Children s[16.44%]