
 Login Sign Up


| |||||
 |  | ||||

| 12Stocks.com Market Intelligence |
Best SmallCap Stocks
|
| In a hurry? Small Cap Stock Lists: Performance Trends Table, Stock Charts
Sort Small Cap stocks: Daily, Weekly, Year-to-Date, Market Cap & Trends. Filter Small Cap stocks list by sector: Show all, Tech, Finance, Energy, Staples, Retail, Industrial, Materials, Utilities and HealthCare Filter Small Cap stocks list by size: All Large Medium Small and MicroCap |
| 12Stocks.com Small Cap Stocks Performances & Trends Daily | |||||||||
|
|  The overall Smart Investing & Trading Score is 70 (0-bearish to 100-bullish) which puts Small Cap index in short term neutral to bullish trend. The Smart Investing & Trading Score from previous trading session is 87 and hence a deterioration of trend.
| ||||||||
Here are the Smart Investing & Trading Scores of the most requested small cap stocks at 12Stocks.com (click stock name for detailed review):
|


| 12Stocks.com: Investing in Smallcap Index with Stocks | |
|
The following table helps investors and traders sort through current performance and trends (as measured by Smart Investing & Trading Score) of various
stocks in the Smallcap Index. Quick View: Move mouse or cursor over stock symbol (ticker) to view short-term technical chart and over stock name to view long term chart. Click on  to add stock symbol to your watchlist and to add stock symbol to your watchlist and  to view watchlist. Click on any ticker or stock name for detailed market intelligence report for that stock. to view watchlist. Click on any ticker or stock name for detailed market intelligence report for that stock. |
12Stocks.com Performance of Stocks in Smallcap Index
| Ticker | Stock Name | Watchlist | Category | Recent Price | Smart Investing & Trading Score | Change % | YTD Change% |
| ALX | Alexander s |   | Financials | 227.00 | 100 | 0.18 | 6.29% |
| TARO | Taro Pharmaceutical | | Health Care | 42.49 | 58 | 0.17 | 1.70% |
| FELE | Franklin Electric | | Industrials | 100.95 | 32 | 0.17 | 4.45% |
| ARCH | Arch Coal | | Materials | 160.39 | 25 | 0.17 | -3.34% |
| SCS | Steelcase | | Consumer Staples | 12.72 | 52 | 0.16 | -5.92% |
| ROCK | Gibraltar Industries | | Materials | 73.23 | 57 | 0.16 | -7.27% |
| JOUT | Johnson Outdoors | | Consumer Staples | 37.90 | 0 | 0.16 | -29.05% |
| JACK | Jack in | | Services & Goods | 55.01 | 28 | 0.16 | -32.61% |
| AFCG | AFC Gamma | | Financials | 12.37 | 88 | 0.16 | 2.66% |
| UCBI | United Community | | Financials | 26.32 | 76 | 0.15 | -10.05% |
| CALM | Cal-Maine Foods | | Consumer Staples | 57.16 | 43 | 0.15 | -0.39% |
| CBZ | CBIZ | | Services & Goods | 75.71 | 90 | 0.15 | 20.96% |
| TPC | Tutor Perini | | Industrials | 18.38 | 78 | 0.14 | 101.92% |
| BXMT | Blackstone Mortgage | | Financials | 17.93 | 10 | 0.14 | -15.68% |
| LBRT | Liberty Oilfield | | Energy | 22.10 | 51 | 0.14 | 21.83% |
| VEL | Velocity Financial | | Financials | 17.73 | 76 | 0.14 | 6.71% |
| CNO | CNO Financial | | Financials | 27.65 | 78 | 0.13 | -0.91% |
| TRMK | Trustmark | | Financials | 30.50 | 68 | 0.13 | 9.40% |
| SLAB | Silicon | | Technology | 126.29 | 74 | 0.13 | -4.52% |
| ASGN | ASGN | | Services & Goods | 98.94 | 68 | 0.13 | 2.88% |
| NHC | National HealthCare | | Health Care | 93.86 | 59 | 0.13 | 1.56% |
| NVEE | NV5 Global | | Services & Goods | 93.93 | 50 | 0.13 | -15.47% |
| CAKE | Cheesecake Factory | | Services & Goods | 34.06 | 43 | 0.12 | -2.71% |
| CTS | CTS | | Technology | 50.38 | 95 | 0.12 | 15.18% |
| ABCB | Ameris Bancorp | | Financials | 49.56 | 63 | 0.12 | -6.58% |


| Too many stocks? View smallcap stocks filtered by marketcap & sector |
| Marketcap: All SmallCap Stocks (default-no microcap), Large, Mid-Range, Small |
| Smallcap Sector: Tech, Finance, Energy, Staples, Retail, Industrial, Materials, & Medical |
|
Get the most comprehensive stock market coverage daily at 12Stocks.com ➞ Best Stocks Today ➞ Best Stocks Weekly ➞ Best Stocks Year-to-Date ➞ Best Stocks Trends ➞  Best Stocks Today 12Stocks.com Best Nasdaq Stocks ➞ Best S&P 500 Stocks ➞ Best Tech Stocks ➞ Best Biotech Stocks ➞ |
| Detailed Overview of SmallCap Stocks |
| SmallCap Technical Overview, Leaders & Laggards, Top SmallCap ETF Funds & Detailed SmallCap Stocks List, Charts, Trends & More |
| Smallcap: Technical Analysis, Trends & YTD Performance | |
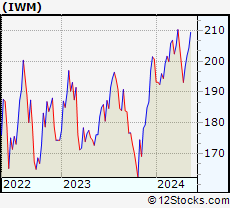
| SmallCap segment as represented by
IWM, an exchange-traded fund [ETF], holds basket of thousands of smallcap stocks from across all major sectors of the US stock market. The smallcap index (contains stocks like Riverbed & Sotheby's) is up by 1.45% and is currently underperforming the overall market by -6.57% year-to-date. Below is a quick view of technical charts and trends: | |
 IWM Weekly Chart |
|
| Long Term Trend: Deteriorating | |
| Medium Term Trend: Very Good | |
 IWM Daily Chart |
|
| Short Term Trend: Good | |
| Overall Trend Score: 70 | |
| YTD Performance: 1.45% | |
| **Trend Scores & Views Are Only For Educational Purposes And Not For Investing | |
| 12Stocks.com: Top Performing Small Cap Index Stocks | ||||||||||||||||||||||||||||||||||||||||||||||||
 The top performing Small Cap Index stocks year to date are
Now, more recently, over last week, the top performing Small Cap Index stocks on the move are


|
||||||||||||||||||||||||||||||||||||||||||||||||
| 12Stocks.com: Investing in Smallcap Index using Exchange Traded Funds | |
|
The following table shows list of key exchange traded funds (ETF) that
help investors track Smallcap index. The following list also includes leveraged ETF funds that track twice or thrice the daily returns of Smallcap indices. Short or inverse ETF funds move in the opposite direction to the index they track and are useful during market pullbacks or during bear markets. Quick View: Move mouse or cursor over ETF symbol (ticker) to view short-term technical chart and over ETF name to view long term chart. Click on ticker or stock name for detailed view. Click on to add stock symbol to your watchlist and to view watchlist. |
12Stocks.com List of ETFs that track Smallcap Index
| Ticker | ETF Name | Watchlist | Recent Price | Smart Investing & Trading Score | Change % | Week % | Year-to-date % |
| IWM | iShares Russell 2000 | | 203.62 | 70 | -0.66 | 0.85 | 1.45% |
| IJR | iShares Core S&P Small-Cap | | 108.15 | 58 | -0.44 | 0.95 | -0.1% |
| IWN | iShares Russell 2000 Value | | 155.08 | 76 | -0.35 | 0.56 | -0.16% |
| VTWO | Vanguard Russell 2000 ETF | | 82.27 | 57 | -0.69 | 0.81 | 1.44% |
| IWO | iShares Russell 2000 Growth | | 259.82 | 57 | -0.95 | 1.15 | 3.01% |
| IJS | iShares S&P Small-Cap 600 Value | | 99.06 | 40 | -0.62 | 0.34 | -3.89% |
| IJT | iShares S&P Small-Cap 600 Growth | | 128.54 | 71 | -1.00 | 0.61 | 2.72% |
| XSLV | PowerShares S&P SmallCap Low Volatil ETF | | 43.77 | 95 | -0.52 | 1.27 | -0.86% |
| SDD | ProShares UltraShort SmallCap600 | | 18.66 | 40 | 2.43 | -0.98 | 1.27% |
| SMLV | SPDR SSGA US Small Cap Low Volatil ETF | | 109.87 | 63 | -0.55 | 0.17 | -2.36% |
| SBB | ProShares Short SmallCap600 | | 16.11 | 25 | 0.91 | -0.28 | 1.16% |
| SAA | ProShares Ultra SmallCap600 | | 24.21 | 70 | -0.75 | 2.62 | -2.98% |
| 12Stocks.com: Charts, Trends, Fundamental Data and Performances of SmallCap Stocks | |
|
We now take in-depth look at all SmallCap stocks including charts, multi-period performances and overall trends (as measured by Smart Investing & Trading Score). One can sort SmallCap stocks (click link to choose) by Daily, Weekly and by Year-to-Date performances. Also, one can sort by size of the company or by market capitalization. |
| Select Your Default Chart Type: | |||||
| |||||
| Click on stock symbol or name for detailed view. Click on to add stock symbol to your watchlist and to view watchlist. Quick View: Move mouse or cursor over "Daily" to quickly view daily technical stock chart and over "Weekly" to view weekly technical stock chart. | |||||

 | ALX Alexander s, Inc. |
| Sector: Financials | |
| SubSector: REIT - Retail | |
| MarketCap: 1251.54 Millions | |
| Recent Price: 227.00 Smart Investing & Trading Score: 100 | |
| Day Percent Change: 0.18% Day Change: 0.40 | |
| Week Change: 6.17% Year-to-date Change: 6.3% | |
| ALX Links: Profile News Message Board | |
| Charts:- Daily , Weekly | |
| Add ALX to Watchlist: View: Get Complete ALX Trend Analysis ➞ | |
 | TARO Taro Pharmaceutical Industries Ltd. |
| Sector: Health Care | |
| SubSector: Drug Manufacturers - Other | |
| MarketCap: 2379.33 Millions | |
| Recent Price: 42.49 Smart Investing & Trading Score: 58 | |
| Day Percent Change: 0.17% Day Change: 0.07 | |
| Week Change: 0.09% Year-to-date Change: 1.7% | |
| TARO Links: Profile News Message Board | |
| Charts:- Daily , Weekly | |
| Add TARO to Watchlist: View: Get Complete TARO Trend Analysis ➞ | |
 | FELE Franklin Electric Co., Inc. |
| Sector: Industrials | |
| SubSector: Industrial Electrical Equipment | |
| MarketCap: 2397.89 Millions | |
| Recent Price: 100.95 Smart Investing & Trading Score: 32 | |
| Day Percent Change: 0.17% Day Change: 0.17 | |
| Week Change: 2.07% Year-to-date Change: 4.5% | |
| FELE Links: Profile News Message Board | |
| Charts:- Daily , Weekly | |
| Add FELE to Watchlist: View: Get Complete FELE Trend Analysis ➞ | |
 | ARCH Arch Coal, Inc. |
| Sector: Materials | |
| SubSector: Industrial Metals & Minerals | |
| MarketCap: 547.21 Millions | |
| Recent Price: 160.39 Smart Investing & Trading Score: 25 | |
| Day Percent Change: 0.17% Day Change: 0.27 | |
| Week Change: -0.64% Year-to-date Change: -3.3% | |
| ARCH Links: Profile News Message Board | |
| Charts:- Daily , Weekly | |
| Add ARCH to Watchlist: View: Get Complete ARCH Trend Analysis ➞ | |
 | SCS Steelcase Inc. |
| Sector: Consumer Staples | |
| SubSector: Business Equipment | |
| MarketCap: 1310.77 Millions | |
| Recent Price: 12.72 Smart Investing & Trading Score: 52 | |
| Day Percent Change: 0.16% Day Change: 0.02 | |
| Week Change: 1.84% Year-to-date Change: -5.9% | |
| SCS Links: Profile News Message Board | |
| Charts:- Daily , Weekly | |
| Add SCS to Watchlist: View: Get Complete SCS Trend Analysis ➞ | |
 | ROCK Gibraltar Industries, Inc. |
| Sector: Materials | |
| SubSector: Steel & Iron | |
| MarketCap: 1341.08 Millions | |
| Recent Price: 73.23 Smart Investing & Trading Score: 57 | |
| Day Percent Change: 0.16% Day Change: 0.11 | |
| Week Change: 2.16% Year-to-date Change: -7.3% | |
| ROCK Links: Profile News Message Board | |
| Charts:- Daily , Weekly | |
| Add ROCK to Watchlist: View: Get Complete ROCK Trend Analysis ➞ | |
 | JOUT Johnson Outdoors Inc. |
| Sector: Consumer Staples | |
| SubSector: Sporting Goods | |
| MarketCap: 572.844 Millions | |
| Recent Price: 37.90 Smart Investing & Trading Score: 0 | |
| Day Percent Change: 0.16% Day Change: 0.06 | |
| Week Change: 0.19% Year-to-date Change: -29.1% | |
| JOUT Links: Profile News Message Board | |
| Charts:- Daily , Weekly | |
| Add JOUT to Watchlist: View: Get Complete JOUT Trend Analysis ➞ | |
 | JACK Jack in the Box Inc. |
| Sector: Services & Goods | |
| SubSector: Restaurants | |
| MarketCap: 633.87 Millions | |
| Recent Price: 55.01 Smart Investing & Trading Score: 28 | |
| Day Percent Change: 0.16% Day Change: 0.09 | |
| Week Change: -0.4% Year-to-date Change: -32.6% | |
| JACK Links: Profile News Message Board | |
| Charts:- Daily , Weekly | |
| Add JACK to Watchlist: View: Get Complete JACK Trend Analysis ➞ | |
 | AFCG AFC Gamma, Inc. |
| Sector: Financials | |
| SubSector: REIT - Specialty | |
| MarketCap: 269 Millions | |
| Recent Price: 12.37 Smart Investing & Trading Score: 88 | |
| Day Percent Change: 0.16% Day Change: 0.02 | |
| Week Change: 2.4% Year-to-date Change: 2.7% | |
| AFCG Links: Profile News Message Board | |
| Charts:- Daily , Weekly | |
| Add AFCG to Watchlist: View: Get Complete AFCG Trend Analysis ➞ | |
 | UCBI United Community Banks, Inc. |
| Sector: Financials | |
| SubSector: Regional - Mid-Atlantic Banks | |
| MarketCap: 1593.99 Millions | |
| Recent Price: 26.32 Smart Investing & Trading Score: 76 | |
| Day Percent Change: 0.15% Day Change: 0.04 | |
| Week Change: 0% Year-to-date Change: -10.1% | |
| UCBI Links: Profile News Message Board | |
| Charts:- Daily , Weekly | |
| Add UCBI to Watchlist: View: Get Complete UCBI Trend Analysis ➞ | |
 | CALM Cal-Maine Foods, Inc. |
| Sector: Consumer Staples | |
| SubSector: Food - Major Diversified | |
| MarketCap: 2177.13 Millions | |
| Recent Price: 57.16 Smart Investing & Trading Score: 43 | |
| Day Percent Change: 0.15% Day Change: 0.09 | |
| Week Change: 0.64% Year-to-date Change: -0.4% | |
| CALM Links: Profile News Message Board | |
| Charts:- Daily , Weekly | |
| Add CALM to Watchlist: View: Get Complete CALM Trend Analysis ➞ | |
 | CBZ CBIZ, Inc. |
| Sector: Services & Goods | |
| SubSector: Business Services | |
| MarketCap: 1121.32 Millions | |
| Recent Price: 75.71 Smart Investing & Trading Score: 90 | |
| Day Percent Change: 0.15% Day Change: 0.11 | |
| Week Change: 3.57% Year-to-date Change: 21.0% | |
| CBZ Links: Profile News Message Board | |
| Charts:- Daily , Weekly | |
| Add CBZ to Watchlist: View: Get Complete CBZ Trend Analysis ➞ | |
 | TPC Tutor Perini Corporation |
| Sector: Industrials | |
| SubSector: Heavy Construction | |
| MarketCap: 382.595 Millions | |
| Recent Price: 18.38 Smart Investing & Trading Score: 78 | |
| Day Percent Change: 0.14% Day Change: 0.02 | |
| Week Change: 2.14% Year-to-date Change: 101.9% | |
| TPC Links: Profile News Message Board | |
| Charts:- Daily , Weekly | |
| Add TPC to Watchlist: View: Get Complete TPC Trend Analysis ➞ | |
 | BXMT Blackstone Mortgage Trust, Inc. |
| Sector: Financials | |
| SubSector: Mortgage Investment | |
| MarketCap: 2820.69 Millions | |
| Recent Price: 17.93 Smart Investing & Trading Score: 10 | |
| Day Percent Change: 0.14% Day Change: 0.02 | |
| Week Change: -0.31% Year-to-date Change: -15.7% | |
| BXMT Links: Profile News Message Board | |
| Charts:- Daily , Weekly | |
| Add BXMT to Watchlist: View: Get Complete BXMT Trend Analysis ➞ | |
 | LBRT Liberty Oilfield Services Inc. |
| Sector: Energy | |
| SubSector: Oil & Gas Equipment & Services | |
| MarketCap: 308.261 Millions | |
| Recent Price: 22.10 Smart Investing & Trading Score: 51 | |
| Day Percent Change: 0.14% Day Change: 0.03 | |
| Week Change: 2.13% Year-to-date Change: 21.8% | |
| LBRT Links: Profile News Message Board | |
| Charts:- Daily , Weekly | |
| Add LBRT to Watchlist: View: Get Complete LBRT Trend Analysis ➞ | |
 | VEL Velocity Financial, Inc. |
| Sector: Financials | |
| SubSector: Mortgage Finance | |
| MarketCap: 12157 Millions | |
| Recent Price: 17.73 Smart Investing & Trading Score: 76 | |
| Day Percent Change: 0.14% Day Change: 0.02 | |
| Week Change: 2.34% Year-to-date Change: 6.7% | |
| VEL Links: Profile News Message Board | |
| Charts:- Daily , Weekly | |
| Add VEL to Watchlist: View: Get Complete VEL Trend Analysis ➞ | |
 | CNO CNO Financial Group, Inc. |
| Sector: Financials | |
| SubSector: Accident & Health Insurance | |
| MarketCap: 1746.9 Millions | |
| Recent Price: 27.65 Smart Investing & Trading Score: 78 | |
| Day Percent Change: 0.13% Day Change: 0.04 | |
| Week Change: 1.97% Year-to-date Change: -0.9% | |
| CNO Links: Profile News Message Board | |
| Charts:- Daily , Weekly | |
| Add CNO to Watchlist: View: Get Complete CNO Trend Analysis ➞ | |
 | TRMK Trustmark Corporation |
| Sector: Financials | |
| SubSector: Regional - Southeast Banks | |
| MarketCap: 1630.15 Millions | |
| Recent Price: 30.50 Smart Investing & Trading Score: 68 | |
| Day Percent Change: 0.13% Day Change: 0.04 | |
| Week Change: -1.17% Year-to-date Change: 9.4% | |
| TRMK Links: Profile News Message Board | |
| Charts:- Daily , Weekly | |
| Add TRMK to Watchlist: View: Get Complete TRMK Trend Analysis ➞ | |
 | SLAB Silicon Laboratories Inc. |
| Sector: Technology | |
| SubSector: Semiconductor - Integrated Circuits | |
| MarketCap: 3710.2 Millions | |
| Recent Price: 126.29 Smart Investing & Trading Score: 74 | |
| Day Percent Change: 0.13% Day Change: 0.17 | |
| Week Change: 3.2% Year-to-date Change: -4.5% | |
| SLAB Links: Profile News Message Board | |
| Charts:- Daily , Weekly | |
| Add SLAB to Watchlist: View: Get Complete SLAB Trend Analysis ➞ | |
 | ASGN ASGN Incorporated |
| Sector: Services & Goods | |
| SubSector: Staffing & Outsourcing Services | |
| MarketCap: 2035.88 Millions | |
| Recent Price: 98.94 Smart Investing & Trading Score: 68 | |
| Day Percent Change: 0.13% Day Change: 0.13 | |
| Week Change: 2.9% Year-to-date Change: 2.9% | |
| ASGN Links: Profile News Message Board | |
| Charts:- Daily , Weekly | |
| Add ASGN to Watchlist: View: Get Complete ASGN Trend Analysis ➞ | |
 | NHC National HealthCare Corporation |
| Sector: Health Care | |
| SubSector: Long-Term Care Facilities | |
| MarketCap: 1164.86 Millions | |
| Recent Price: 93.86 Smart Investing & Trading Score: 59 | |
| Day Percent Change: 0.13% Day Change: 0.12 | |
| Week Change: 2.61% Year-to-date Change: 1.6% | |
| NHC Links: Profile News Message Board | |
| Charts:- Daily , Weekly | |
| Add NHC to Watchlist: View: Get Complete NHC Trend Analysis ➞ | |
 | NVEE NV5 Global, Inc. |
| Sector: Services & Goods | |
| SubSector: Technical Services | |
| MarketCap: 484.91 Millions | |
| Recent Price: 93.93 Smart Investing & Trading Score: 50 | |
| Day Percent Change: 0.13% Day Change: 0.12 | |
| Week Change: 0.15% Year-to-date Change: -15.5% | |
| NVEE Links: Profile News Message Board | |
| Charts:- Daily , Weekly | |
| Add NVEE to Watchlist: View: Get Complete NVEE Trend Analysis ➞ | |
 | CAKE The Cheesecake Factory Incorporated |
| Sector: Services & Goods | |
| SubSector: Restaurants | |
| MarketCap: 829 Millions | |
| Recent Price: 34.06 Smart Investing & Trading Score: 43 | |
| Day Percent Change: 0.12% Day Change: 0.04 | |
| Week Change: 1.16% Year-to-date Change: -2.7% | |
| CAKE Links: Profile News Message Board | |
| Charts:- Daily , Weekly | |
| Add CAKE to Watchlist: View: Get Complete CAKE Trend Analysis ➞ | |
 | CTS CTS Corporation |
| Sector: Technology | |
| SubSector: Diversified Electronics | |
| MarketCap: 645.896 Millions | |
| Recent Price: 50.38 Smart Investing & Trading Score: 95 | |
| Day Percent Change: 0.12% Day Change: 0.06 | |
| Week Change: 1.59% Year-to-date Change: 15.2% | |
| CTS Links: Profile News Message Board | |
| Charts:- Daily , Weekly | |
| Add CTS to Watchlist: View: Get Complete CTS Trend Analysis ➞ | |
 | ABCB Ameris Bancorp |
| Sector: Financials | |
| SubSector: Regional - Mid-Atlantic Banks | |
| MarketCap: 1537.79 Millions | |
| Recent Price: 49.56 Smart Investing & Trading Score: 63 | |
| Day Percent Change: 0.12% Day Change: 0.06 | |
| Week Change: -0.52% Year-to-date Change: -6.6% | |
| ABCB Links: Profile News Message Board | |
| Charts:- Daily , Weekly | |
| Add ABCB to Watchlist: View: Get Complete ABCB Trend Analysis ➞ | |
| Too many stocks? View smallcap stocks filtered by marketcap & sector |
| Marketcap: All SmallCap Stocks (default-no microcap), Large, Mid-Range, Small & MicroCap |
| Sector: Tech, Finance, Energy, Staples, Retail, Industrial, Materials, Utilities & Medical |
|
Best Stocks Today 12Stocks.com |
© 2024 12Stocks.com Terms & Conditions Privacy Contact Us
All Information Provided Only For Education And Not To Be Used For Investing or Trading. See Terms & Conditions


One More Thing ... Get Best Stocks Delivered Daily!
Never Ever Miss A Move With Our Top Ten Stocks Lists
Find Best Stocks In Any Market - Bull or Bear Market
Take A Peek At Our Top Ten Stocks Lists: Daily, Weekly, Year-to-Date & Top Trends
Find Best Stocks In Any Market - Bull or Bear Market
Take A Peek At Our Top Ten Stocks Lists: Daily, Weekly, Year-to-Date & Top Trends
Smallcap Stocks With Best Up Trends [0-bearish to 100-bullish]: Cricut [100], DASAN Zhone[100], Hyster-Yale Materials[100], Latham Group[100], Alpha and[100], Vigil Neuroscience[100], Myriad Genetics[100], Hannon Armstrong[100], Ardmore Shipping[100], Pacira BioSciences[100], Wolverine World[100]
Best Smallcap Stocks Year-to-Date:
CareMax [568.04%], Janux [398.37%], Viking [325.04%], Bakkt [273.09%], Longboard [253.85%], Alpine Immune[239.73%], Super Micro[190.86%], Avidity Biosciences[186.17%], Vera [183.88%], Cullinan Oncology[174.2%], Arcutis Bio[146.28%] Best Smallcap Stocks This Week:
DASAN Zhone[64.32%], Perficient [52.7%], Innodata [49.03%], Vigil Neuroscience[37.87%], Latham Group[37.73%], Cricut [37.35%], Thoughtworks Holding[34.67%], Children s[31.88%], Great Lakes[31.03%], Outset Medical[30.19%], Hyster-Yale Materials[26.56%] Best Smallcap Stocks Daily:
Innodata [48.59%], Cricut [42.31%], DASAN Zhone[30.11%], Hyster-Yale Materials[26.08%], Latham Group[25.75%], Ameresco [21.54%], Alpha and[20.06%], iRobot [19.18%], Vigil Neuroscience[17.55%], Myriad Genetics[17.09%], PowerSchool [16.53%]