
 Login Sign Up


| |||||
 |  | ||||

| 12Stocks.com Market Intelligence |
Best SmallCap Stocks
|
| In a hurry? Small Cap Stock Lists: Performance Trends Table, Stock Charts
Sort Small Cap stocks: Daily, Weekly, Year-to-Date, Market Cap & Trends. Filter Small Cap stocks list by sector: Show all, Tech, Finance, Energy, Staples, Retail, Industrial, Materials, Utilities and HealthCare Filter Small Cap stocks list by size: All Large Medium Small and MicroCap |
| 12Stocks.com Small Cap Stocks Performances & Trends Daily | |||||||||
|
|  The overall Smart Investing & Trading Score is 70 (0-bearish to 100-bullish) which puts Small Cap index in short term neutral to bullish trend. The Smart Investing & Trading Score from previous trading session is 87 and hence a deterioration of trend.
| ||||||||
Here are the Smart Investing & Trading Scores of the most requested small cap stocks at 12Stocks.com (click stock name for detailed review):
|


| 12Stocks.com: Investing in Smallcap Index with Stocks | |
|
The following table helps investors and traders sort through current performance and trends (as measured by Smart Investing & Trading Score) of various
stocks in the Smallcap Index. Quick View: Move mouse or cursor over stock symbol (ticker) to view short-term technical chart and over stock name to view long term chart. Click on  to add stock symbol to your watchlist and to add stock symbol to your watchlist and  to view watchlist. Click on any ticker or stock name for detailed market intelligence report for that stock. to view watchlist. Click on any ticker or stock name for detailed market intelligence report for that stock. |
12Stocks.com Performance of Stocks in Smallcap Index
| Ticker | Stock Name | Watchlist | Category | Recent Price | Smart Investing & Trading Score | Change % | YTD Change% |
| CUBI | Customers Bancorp |   | Financials | 47.88 | 35 | 0.72 | -16.90% |
| ONB | Old National | | Financials | 17.38 | 88 | 0.70 | 2.90% |
| SLAB | Silicon | | Technology | 127.00 | 74 | 0.70 | -3.98% |
| RNST | Renasant | | Financials | 30.36 | 67 | 0.70 | -9.86% |
| NTGR | NETGEAR | | Technology | 11.57 | 18 | 0.70 | -20.64% |
| PRLB | Proto Labs | | Industrials | 31.69 | 35 | 0.70 | -18.66% |
| HFWA | Heritage Financial | | Financials | 18.85 | 81 | 0.69 | -11.87% |
| ICFI | ICF | | Services & Goods | 151.64 | 59 | 0.69 | 13.09% |
| BIPC | Brookfield Infrastructure | | Utilities | 34.16 | 95 | 0.69 | -3.16% |
| UFCS | United Fire | | Financials | 23.55 | 93 | 0.68 | 17.05% |
| BBAI | BigBear.ai | | Technology | 1.49 | 15 | 0.68 | -30.05% |
| SXT | Sensient | | Materials | 76.13 | 95 | 0.67 | 15.35% |
| HELE | Helen of Troy | | Consumer Staples | 98.71 | 42 | 0.67 | -18.29% |
| HI | Hillenbrand | | Industrials | 45.31 | 32 | 0.67 | -5.31% |
| TRMK | Trustmark | | Financials | 30.66 | 76 | 0.66 | 9.97% |
| ORA | Ormat | | Utilities | 68.49 | 88 | 0.66 | -9.63% |
| NBHC | National Bank | | Financials | 35.00 | 79 | 0.66 | -5.89% |
| ATI | Allegheny | | Industrials | 60.20 | 95 | 0.65 | 32.39% |
| FIBK | First Interstate | | Financials | 27.83 | 76 | 0.65 | -9.50% |
| RYI | Ryerson Holding | | Industrials | 9.45 | 10 | 0.64 | -35.15% |
| GABC | German American | | Financials | 32.34 | 54 | 0.64 | -0.23% |
| RBBN | Ribbon | | Technology | 3.13 | 58 | 0.64 | 8.10% |
| USNA | USANA Health | | Health Care | 45.02 | 47 | 0.63 | -16.01% |
| WAFD | Washington Federal | | Financials | 28.94 | 93 | 0.63 | -12.20% |
| LASR | nLIGHT | | Technology | 12.86 | 69 | 0.63 | -4.74% |


| Too many stocks? View smallcap stocks filtered by marketcap & sector |
| Marketcap: All SmallCap Stocks (default-no microcap), Large, Mid-Range, Small |
| Smallcap Sector: Tech, Finance, Energy, Staples, Retail, Industrial, Materials, & Medical |
|
Get the most comprehensive stock market coverage daily at 12Stocks.com ➞ Best Stocks Today ➞ Best Stocks Weekly ➞ Best Stocks Year-to-Date ➞ Best Stocks Trends ➞  Best Stocks Today 12Stocks.com Best Nasdaq Stocks ➞ Best S&P 500 Stocks ➞ Best Tech Stocks ➞ Best Biotech Stocks ➞ |
| Detailed Overview of SmallCap Stocks |
| SmallCap Technical Overview, Leaders & Laggards, Top SmallCap ETF Funds & Detailed SmallCap Stocks List, Charts, Trends & More |
| Smallcap: Technical Analysis, Trends & YTD Performance | |
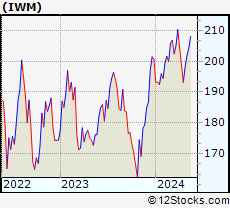
| SmallCap segment as represented by
IWM, an exchange-traded fund [ETF], holds basket of thousands of smallcap stocks from across all major sectors of the US stock market. The smallcap index (contains stocks like Riverbed & Sotheby's) is up by 1.53% and is currently underperforming the overall market by -6.51% year-to-date. Below is a quick view of technical charts and trends: | |
 IWM Weekly Chart |
|
| Long Term Trend: Very Good | |
| Medium Term Trend: Very Good | |
 IWM Daily Chart |
|
| Short Term Trend: Good | |
| Overall Trend Score: 70 | |
| YTD Performance: 1.53% | |
| **Trend Scores & Views Are Only For Educational Purposes And Not For Investing | |
| 12Stocks.com: Top Performing Small Cap Index Stocks | ||||||||||||||||||||||||||||||||||||||||||||||||
 The top performing Small Cap Index stocks year to date are
Now, more recently, over last week, the top performing Small Cap Index stocks on the move are


|
||||||||||||||||||||||||||||||||||||||||||||||||
| 12Stocks.com: Investing in Smallcap Index using Exchange Traded Funds | |
|
The following table shows list of key exchange traded funds (ETF) that
help investors track Smallcap index. The following list also includes leveraged ETF funds that track twice or thrice the daily returns of Smallcap indices. Short or inverse ETF funds move in the opposite direction to the index they track and are useful during market pullbacks or during bear markets. Quick View: Move mouse or cursor over ETF symbol (ticker) to view short-term technical chart and over ETF name to view long term chart. Click on ticker or stock name for detailed view. Click on to add stock symbol to your watchlist and to view watchlist. |
12Stocks.com List of ETFs that track Smallcap Index
| Ticker | ETF Name | Watchlist | Recent Price | Smart Investing & Trading Score | Change % | Week % | Year-to-date % |
| IWM | iShares Russell 2000 | | 203.78 | 70 | -0.58 | 0.93 | 1.53% |
| IJR | iShares Core S&P Small-Cap | | 108.26 | 88 | -0.33 | 1.05 | 0.01% |
| IWN | iShares Russell 2000 Value | | 155.37 | 88 | -0.17 | 0.75 | 0.03% |
| VTWO | Vanguard Russell 2000 ETF | | 82.40 | 57 | -0.53 | 0.97 | 1.6% |
| IWO | iShares Russell 2000 Growth | | 260.10 | 57 | -0.84 | 1.26 | 3.12% |
| IJS | iShares S&P Small-Cap 600 Value | | 99.80 | 70 | 0.12 | 1.09 | -3.17% |
| IJT | iShares S&P Small-Cap 600 Growth | | 129.03 | 83 | -0.62 | 0.99 | 3.11% |
| XSLV | PowerShares S&P SmallCap Low Volatil ETF | | 43.94 | 100 | -0.14 | 1.67 | -0.48% |
| SMLV | SPDR SSGA US Small Cap Low Volatil ETF | | 110.32 | 68 | -0.15 | 0.57 | -1.96% |
| SDD | ProShares UltraShort SmallCap600 | | 18.66 | 40 | 2.43 | -0.98 | 1.27% |
| SBB | ProShares Short SmallCap600 | | 16.08 | 38 | 0.69 | -0.5 | 0.94% |
| SAA | ProShares Ultra SmallCap600 | | 24.21 | 70 | -0.75 | 2.62 | -2.98% |
| 12Stocks.com: Charts, Trends, Fundamental Data and Performances of SmallCap Stocks | |
|
We now take in-depth look at all SmallCap stocks including charts, multi-period performances and overall trends (as measured by Smart Investing & Trading Score). One can sort SmallCap stocks (click link to choose) by Daily, Weekly and by Year-to-Date performances. Also, one can sort by size of the company or by market capitalization. |
| Select Your Default Chart Type: | |||||
| |||||
| Click on stock symbol or name for detailed view. Click on to add stock symbol to your watchlist and to view watchlist. Quick View: Move mouse or cursor over "Daily" to quickly view daily technical stock chart and over "Weekly" to view weekly technical stock chart. | |||||

 | CUBI Customers Bancorp, Inc. |
| Sector: Financials | |
| SubSector: Regional - Northeast Banks | |
| MarketCap: 385.399 Millions | |
| Recent Price: 47.88 Smart Investing & Trading Score: 35 | |
| Day Percent Change: 0.72% Day Change: 0.34 | |
| Week Change: -0.77% Year-to-date Change: -16.9% | |
| CUBI Links: Profile News Message Board | |
| Charts:- Daily , Weekly | |
| Add CUBI to Watchlist: View: Get Complete CUBI Trend Analysis ➞ | |
 | ONB Old National Bancorp |
| Sector: Financials | |
| SubSector: Regional - Midwest Banks | |
| MarketCap: 2340.8 Millions | |
| Recent Price: 17.38 Smart Investing & Trading Score: 88 | |
| Day Percent Change: 0.70% Day Change: 0.12 | |
| Week Change: 1.11% Year-to-date Change: 2.9% | |
| ONB Links: Profile News Message Board | |
| Charts:- Daily , Weekly | |
| Add ONB to Watchlist: View: Get Complete ONB Trend Analysis ➞ | |
 | SLAB Silicon Laboratories Inc. |
| Sector: Technology | |
| SubSector: Semiconductor - Integrated Circuits | |
| MarketCap: 3710.2 Millions | |
| Recent Price: 127.00 Smart Investing & Trading Score: 74 | |
| Day Percent Change: 0.70% Day Change: 0.88 | |
| Week Change: 3.78% Year-to-date Change: -4.0% | |
| SLAB Links: Profile News Message Board | |
| Charts:- Daily , Weekly | |
| Add SLAB to Watchlist: View: Get Complete SLAB Trend Analysis ➞ | |
 | RNST Renasant Corporation |
| Sector: Financials | |
| SubSector: Money Center Banks | |
| MarketCap: 1279.39 Millions | |
| Recent Price: 30.36 Smart Investing & Trading Score: 67 | |
| Day Percent Change: 0.70% Day Change: 0.21 | |
| Week Change: 0.9% Year-to-date Change: -9.9% | |
| RNST Links: Profile News Message Board | |
| Charts:- Daily , Weekly | |
| Add RNST to Watchlist: View: Get Complete RNST Trend Analysis ➞ | |
 | NTGR NETGEAR, Inc. |
| Sector: Technology | |
| SubSector: Communication Equipment | |
| MarketCap: 558.839 Millions | |
| Recent Price: 11.57 Smart Investing & Trading Score: 18 | |
| Day Percent Change: 0.70% Day Change: 0.08 | |
| Week Change: -0.52% Year-to-date Change: -20.6% | |
| NTGR Links: Profile News Message Board | |
| Charts:- Daily , Weekly | |
| Add NTGR to Watchlist: View: Get Complete NTGR Trend Analysis ➞ | |
 | PRLB Proto Labs, Inc. |
| Sector: Industrials | |
| SubSector: Machine Tools & Accessories | |
| MarketCap: 1944.78 Millions | |
| Recent Price: 31.69 Smart Investing & Trading Score: 35 | |
| Day Percent Change: 0.70% Day Change: 0.22 | |
| Week Change: 1.93% Year-to-date Change: -18.7% | |
| PRLB Links: Profile News Message Board | |
| Charts:- Daily , Weekly | |
| Add PRLB to Watchlist: View: Get Complete PRLB Trend Analysis ➞ | |
 | HFWA Heritage Financial Corporation |
| Sector: Financials | |
| SubSector: Regional - Pacific Banks | |
| MarketCap: 752.829 Millions | |
| Recent Price: 18.85 Smart Investing & Trading Score: 81 | |
| Day Percent Change: 0.69% Day Change: 0.13 | |
| Week Change: -0.21% Year-to-date Change: -11.9% | |
| HFWA Links: Profile News Message Board | |
| Charts:- Daily , Weekly | |
| Add HFWA to Watchlist: View: Get Complete HFWA Trend Analysis ➞ | |
 | ICFI ICF International, Inc. |
| Sector: Services & Goods | |
| SubSector: Management Services | |
| MarketCap: 1218.75 Millions | |
| Recent Price: 151.64 Smart Investing & Trading Score: 59 | |
| Day Percent Change: 0.69% Day Change: 1.04 | |
| Week Change: 2.16% Year-to-date Change: 13.1% | |
| ICFI Links: Profile News Message Board | |
| Charts:- Daily , Weekly | |
| Add ICFI to Watchlist: View: Get Complete ICFI Trend Analysis ➞ | |
 | BIPC Brookfield Infrastructure Corporation |
| Sector: Utilities | |
| SubSector: Utilities Regulated Gas | |
| MarketCap: 31197 Millions | |
| Recent Price: 34.16 Smart Investing & Trading Score: 95 | |
| Day Percent Change: 0.69% Day Change: 0.23 | |
| Week Change: 2.41% Year-to-date Change: -3.2% | |
| BIPC Links: Profile News Message Board | |
| Charts:- Daily , Weekly | |
| Add BIPC to Watchlist: View: Get Complete BIPC Trend Analysis ➞ | |
 | UFCS United Fire Group, Inc. |
| Sector: Financials | |
| SubSector: Property & Casualty Insurance | |
| MarketCap: 862.812 Millions | |
| Recent Price: 23.55 Smart Investing & Trading Score: 93 | |
| Day Percent Change: 0.68% Day Change: 0.16 | |
| Week Change: 4.02% Year-to-date Change: 17.1% | |
| UFCS Links: Profile News Message Board | |
| Charts:- Daily , Weekly | |
| Add UFCS to Watchlist: View: Get Complete UFCS Trend Analysis ➞ | |
 | BBAI BigBear.ai Holdings, Inc. |
| Sector: Technology | |
| SubSector: Information Technology Services | |
| MarketCap: 339 Millions | |
| Recent Price: 1.49 Smart Investing & Trading Score: 15 | |
| Day Percent Change: 0.68% Day Change: 0.01 | |
| Week Change: -0.33% Year-to-date Change: -30.1% | |
| BBAI Links: Profile News Message Board | |
| Charts:- Daily , Weekly | |
| Add BBAI to Watchlist: View: Get Complete BBAI Trend Analysis ➞ | |
 | SXT Sensient Technologies Corporation |
| Sector: Materials | |
| SubSector: Specialty Chemicals | |
| MarketCap: 1961.37 Millions | |
| Recent Price: 76.13 Smart Investing & Trading Score: 95 | |
| Day Percent Change: 0.67% Day Change: 0.51 | |
| Week Change: 2.88% Year-to-date Change: 15.4% | |
| SXT Links: Profile News Message Board | |
| Charts:- Daily , Weekly | |
| Add SXT to Watchlist: View: Get Complete SXT Trend Analysis ➞ | |
 | HELE Helen of Troy Limited |
| Sector: Consumer Staples | |
| SubSector: Housewares & Accessories | |
| MarketCap: 3199.53 Millions | |
| Recent Price: 98.71 Smart Investing & Trading Score: 42 | |
| Day Percent Change: 0.67% Day Change: 0.66 | |
| Week Change: 2.25% Year-to-date Change: -18.3% | |
| HELE Links: Profile News Message Board | |
| Charts:- Daily , Weekly | |
| Add HELE to Watchlist: View: Get Complete HELE Trend Analysis ➞ | |
 | HI Hillenbrand, Inc. |
| Sector: Industrials | |
| SubSector: Diversified Machinery | |
| MarketCap: 1389.86 Millions | |
| Recent Price: 45.31 Smart Investing & Trading Score: 32 | |
| Day Percent Change: 0.67% Day Change: 0.30 | |
| Week Change: 6.76% Year-to-date Change: -5.3% | |
| HI Links: Profile News Message Board | |
| Charts:- Daily , Weekly | |
| Add HI to Watchlist: View: Get Complete HI Trend Analysis ➞ | |
 | TRMK Trustmark Corporation |
| Sector: Financials | |
| SubSector: Regional - Southeast Banks | |
| MarketCap: 1630.15 Millions | |
| Recent Price: 30.66 Smart Investing & Trading Score: 76 | |
| Day Percent Change: 0.66% Day Change: 0.20 | |
| Week Change: -0.65% Year-to-date Change: 10.0% | |
| TRMK Links: Profile News Message Board | |
| Charts:- Daily , Weekly | |
| Add TRMK to Watchlist: View: Get Complete TRMK Trend Analysis ➞ | |
 | ORA Ormat Technologies, Inc. |
| Sector: Utilities | |
| SubSector: Electric Utilities | |
| MarketCap: 3610.74 Millions | |
| Recent Price: 68.49 Smart Investing & Trading Score: 88 | |
| Day Percent Change: 0.66% Day Change: 0.45 | |
| Week Change: 1.47% Year-to-date Change: -9.6% | |
| ORA Links: Profile News Message Board | |
| Charts:- Daily , Weekly | |
| Add ORA to Watchlist: View: Get Complete ORA Trend Analysis ➞ | |
 | NBHC National Bank Holdings Corporation |
| Sector: Financials | |
| SubSector: Regional - Midwest Banks | |
| MarketCap: 766.87 Millions | |
| Recent Price: 35.00 Smart Investing & Trading Score: 79 | |
| Day Percent Change: 0.66% Day Change: 0.23 | |
| Week Change: 0.69% Year-to-date Change: -5.9% | |
| NBHC Links: Profile News Message Board | |
| Charts:- Daily , Weekly | |
| Add NBHC to Watchlist: View: Get Complete NBHC Trend Analysis ➞ | |
 | ATI Allegheny Technologies Incorporated |
| Sector: Industrials | |
| SubSector: Metal Fabrication | |
| MarketCap: 913.35 Millions | |
| Recent Price: 60.20 Smart Investing & Trading Score: 95 | |
| Day Percent Change: 0.65% Day Change: 0.39 | |
| Week Change: 3.51% Year-to-date Change: 32.4% | |
| ATI Links: Profile News Message Board | |
| Charts:- Daily , Weekly | |
| Add ATI to Watchlist: View: Get Complete ATI Trend Analysis ➞ | |
 | FIBK First Interstate BancSystem, Inc. |
| Sector: Financials | |
| SubSector: Regional - Pacific Banks | |
| MarketCap: 1797.69 Millions | |
| Recent Price: 27.83 Smart Investing & Trading Score: 76 | |
| Day Percent Change: 0.65% Day Change: 0.18 | |
| Week Change: 0.69% Year-to-date Change: -9.5% | |
| FIBK Links: Profile News Message Board | |
| Charts:- Daily , Weekly | |
| Add FIBK to Watchlist: View: Get Complete FIBK Trend Analysis ➞ | |
 | RYI Ryerson Holding Corporation |
| Sector: Industrials | |
| SubSector: Metal Fabrication | |
| MarketCap: 202.55 Millions | |
| Recent Price: 9.45 Smart Investing & Trading Score: 10 | |
| Day Percent Change: 0.64% Day Change: 0.06 | |
| Week Change: -1.53% Year-to-date Change: -35.2% | |
| RYI Links: Profile News Message Board | |
| Charts:- Daily , Weekly | |
| Add RYI to Watchlist: View: Get Complete RYI Trend Analysis ➞ | |
 | GABC German American Bancorp, Inc. |
| Sector: Financials | |
| SubSector: Regional - Midwest Banks | |
| MarketCap: 731.47 Millions | |
| Recent Price: 32.34 Smart Investing & Trading Score: 54 | |
| Day Percent Change: 0.64% Day Change: 0.20 | |
| Week Change: 0.58% Year-to-date Change: -0.2% | |
| GABC Links: Profile News Message Board | |
| Charts:- Daily , Weekly | |
| Add GABC to Watchlist: View: Get Complete GABC Trend Analysis ➞ | |
 | RBBN Ribbon Communications Inc. |
| Sector: Technology | |
| SubSector: Telecom Services - Domestic | |
| MarketCap: 284.577 Millions | |
| Recent Price: 3.13 Smart Investing & Trading Score: 58 | |
| Day Percent Change: 0.64% Day Change: 0.02 | |
| Week Change: -1.1% Year-to-date Change: 8.1% | |
| RBBN Links: Profile News Message Board | |
| Charts:- Daily , Weekly | |
| Add RBBN to Watchlist: View: Get Complete RBBN Trend Analysis ➞ | |
 | USNA USANA Health Sciences, Inc. |
| Sector: Health Care | |
| SubSector: Drug Related Products | |
| MarketCap: 1185.13 Millions | |
| Recent Price: 45.02 Smart Investing & Trading Score: 47 | |
| Day Percent Change: 0.63% Day Change: 0.28 | |
| Week Change: -1.16% Year-to-date Change: -16.0% | |
| USNA Links: Profile News Message Board | |
| Charts:- Daily , Weekly | |
| Add USNA to Watchlist: View: Get Complete USNA Trend Analysis ➞ | |
 | WAFD Washington Federal, Inc. |
| Sector: Financials | |
| SubSector: Savings & Loans | |
| MarketCap: 2219.2 Millions | |
| Recent Price: 28.94 Smart Investing & Trading Score: 93 | |
| Day Percent Change: 0.63% Day Change: 0.18 | |
| Week Change: 1.72% Year-to-date Change: -12.2% | |
| WAFD Links: Profile News Message Board | |
| Charts:- Daily , Weekly | |
| Add WAFD to Watchlist: View: Get Complete WAFD Trend Analysis ➞ | |
 | LASR nLIGHT, Inc. |
| Sector: Technology | |
| SubSector: Semiconductor - Broad Line | |
| MarketCap: 445.642 Millions | |
| Recent Price: 12.86 Smart Investing & Trading Score: 69 | |
| Day Percent Change: 0.63% Day Change: 0.08 | |
| Week Change: 5.93% Year-to-date Change: -4.7% | |
| LASR Links: Profile News Message Board | |
| Charts:- Daily , Weekly | |
| Add LASR to Watchlist: View: Get Complete LASR Trend Analysis ➞ | |
| Too many stocks? View smallcap stocks filtered by marketcap & sector |
| Marketcap: All SmallCap Stocks (default-no microcap), Large, Mid-Range, Small & MicroCap |
| Sector: Tech, Finance, Energy, Staples, Retail, Industrial, Materials, Utilities & Medical |
|
Best Stocks Today 12Stocks.com |
© 2024 12Stocks.com Terms & Conditions Privacy Contact Us
All Information Provided Only For Education And Not To Be Used For Investing or Trading. See Terms & Conditions


One More Thing ... Get Best Stocks Delivered Daily!
Never Ever Miss A Move With Our Top Ten Stocks Lists
Find Best Stocks In Any Market - Bull or Bear Market
Take A Peek At Our Top Ten Stocks Lists: Daily, Weekly, Year-to-Date & Top Trends
Find Best Stocks In Any Market - Bull or Bear Market
Take A Peek At Our Top Ten Stocks Lists: Daily, Weekly, Year-to-Date & Top Trends
Smallcap Stocks With Best Up Trends [0-bearish to 100-bullish]: Innodata [100], Cricut [100], DASAN Zhone[100], Latham Group[100], Hyster-Yale Materials[100], Myriad Genetics[100], Ameresco [100], Alpha and[100], Vigil Neuroscience[100], Hannon Armstrong[100], Ardmore Shipping[100]
Best Smallcap Stocks Year-to-Date:
CareMax [580.41%], Janux [415.82%], Viking [329.77%], Bakkt [295.29%], Longboard [255.4%], Alpine Immune[239.73%], Vera [190.25%], Super Micro[189.4%], Avidity Biosciences[188.27%], Cullinan Oncology[172%], Arcutis Bio[147.06%] Best Smallcap Stocks This Week:
DASAN Zhone[64.32%], Innodata [55.88%], Perficient [52.92%], Cricut [42.32%], Vigil Neuroscience[39.52%], Thoughtworks Holding[36.89%], Latham Group[35.9%], Great Lakes[32.18%], Bakkt [31.96%], Outset Medical[31.95%], P3 Health[27.95%] Best Smallcap Stocks Daily:
Innodata [55.42%], Cricut [47.47%], DASAN Zhone[30.11%], Latham Group[24.08%], Hyster-Yale Materials[23.55%], iRobot [21.40%], Myriad Genetics[21.13%], Ameresco [21.13%], Bakkt [20.92%], Alpha and[20.78%], Vigil Neuroscience[18.97%]