
 Login Sign Up


| |||||
 |  | ||||

| 12Stocks.com Market Intelligence |
Best SmallCap Stocks
|
| In a hurry? Small Cap Stock Lists: Performance Trends Table, Stock Charts
Sort Small Cap stocks: Daily, Weekly, Year-to-Date, Market Cap & Trends. Filter Small Cap stocks list by sector: Show all, Tech, Finance, Energy, Staples, Retail, Industrial, Materials, Utilities and HealthCare Filter Small Cap stocks list by size: All Large Medium Small and MicroCap |
| 12Stocks.com Small Cap Stocks Performances & Trends Daily | |||||||||
|
|  The overall Smart Investing & Trading Score is 87 (0-bearish to 100-bullish) which puts Small Cap index in short term bullish trend. The Smart Investing & Trading Score from previous trading session is 82 and hence an improvement of trend.
| ||||||||
Here are the Smart Investing & Trading Scores of the most requested small cap stocks at 12Stocks.com (click stock name for detailed review):
|


| 12Stocks.com: Investing in Smallcap Index with Stocks | |
|
The following table helps investors and traders sort through current performance and trends (as measured by Smart Investing & Trading Score) of various
stocks in the Smallcap Index. Quick View: Move mouse or cursor over stock symbol (ticker) to view short-term technical chart and over stock name to view long term chart. Click on  to add stock symbol to your watchlist and to add stock symbol to your watchlist and  to view watchlist. Click on any ticker or stock name for detailed market intelligence report for that stock. to view watchlist. Click on any ticker or stock name for detailed market intelligence report for that stock. |
12Stocks.com Performance of Stocks in Smallcap Index
| Ticker | Stock Name | Watchlist | Category | Recent Price | Smart Investing & Trading Score | Change % | YTD Change% |
| SR | Spire |   | Utilities | 61.81 | 88 | 1.05 | -0.85% |
| BV | BrightView | | Industrials | 12.52 | 88 | 1.05 | 48.69% |
| LE | Lands | | Services & Goods | 14.44 | 95 | 1.05 | 51.05% |
| REVG | REV Group | | Consumer Staples | 24.17 | 100 | 1.05 | 33.02% |
| LXP | Lexington Realty | | Financials | 8.77 | 93 | 1.04 | -11.59% |
| FFIN | First Financial | | Financials | 31.08 | 87 | 1.04 | 2.57% |
| ACIW | ACI Worldwide | | Technology | 35.88 | 100 | 1.04 | 17.25% |
| LOVE | Lovesac | | Consumer Staples | 24.27 | 100 | 1.04 | -5.01% |
| COUR | Coursera | | Consumer Staples | 9.68 | 28 | 1.04 | -50.78% |
| SCS | Steelcase | | Consumer Staples | 12.70 | 64 | 1.03 | -6.07% |
| UNF | UniFirst | | Consumer Staples | 163.04 | 64 | 1.03 | -10.86% |
| DVAX | Dynavax | | Health Care | 11.76 | 42 | 1.03 | -15.88% |
| KOD | Kodiak Sciences | | Health Care | 3.98 | 69 | 1.02 | 30.92% |
| PDCO | Patterson | | Services & Goods | 26.02 | 49 | 1.01 | -8.54% |
| CMPR | Cimpress | | Services & Goods | 84.24 | 25 | 1.01 | 5.23% |
| CPRX | Catalyst | | Health Care | 15.14 | 50 | 1.00 | -9.93% |
| BLUE | bluebird bio | | Health Care | 1.01 | 54 | 1.00 | -26.81% |
| VRA | Vera Bradley | | Consumer Staples | 7.09 | 64 | 1.00 | -7.92% |
| OUT | Outfront Media | | Services & Goods | 15.12 | 51 | 1.00 | 8.31% |
| TPIC | TPI Composites | | Industrials | 4.03 | 100 | 1.00 | -2.66% |
| PRVA | Privia Health | | Health Care | 19.25 | 74 | 1.00 | -18.54% |
| AVA | Avista | | Utilities | 37.75 | 95 | 0.99 | 5.62% |
| IPI | Intrepid Potash | | Materials | 21.33 | 100 | 0.99 | -10.72% |
| CAL | Caleres | | Consumer Staples | 38.10 | 64 | 0.98 | 23.98% |
| LANC | Lancaster Colony | | Consumer Staples | 193.79 | 54 | 0.98 | 16.47% |


| Too many stocks? View smallcap stocks filtered by marketcap & sector |
| Marketcap: All SmallCap Stocks (default-no microcap), Large, Mid-Range, Small |
| Smallcap Sector: Tech, Finance, Energy, Staples, Retail, Industrial, Materials, & Medical |
|
Get the most comprehensive stock market coverage daily at 12Stocks.com ➞ Best Stocks Today ➞ Best Stocks Weekly ➞ Best Stocks Year-to-Date ➞ Best Stocks Trends ➞  Best Stocks Today 12Stocks.com Best Nasdaq Stocks ➞ Best S&P 500 Stocks ➞ Best Tech Stocks ➞ Best Biotech Stocks ➞ |
| Detailed Overview of SmallCap Stocks |
| SmallCap Technical Overview, Leaders & Laggards, Top SmallCap ETF Funds & Detailed SmallCap Stocks List, Charts, Trends & More |
| Smallcap: Technical Analysis, Trends & YTD Performance | |
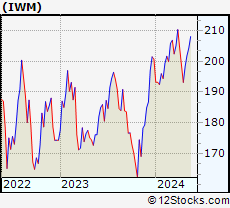
| SmallCap segment as represented by
IWM, an exchange-traded fund [ETF], holds basket of thousands of smallcap stocks from across all major sectors of the US stock market. The smallcap index (contains stocks like Riverbed & Sotheby's) is up by 2.12% and is currently underperforming the overall market by -6% year-to-date. Below is a quick view of technical charts and trends: | |
 IWM Weekly Chart |
|
| Long Term Trend: Very Good | |
| Medium Term Trend: Very Good | |
 IWM Daily Chart |
|
| Short Term Trend: Very Good | |
| Overall Trend Score: 87 | |
| YTD Performance: 2.12% | |
| **Trend Scores & Views Are Only For Educational Purposes And Not For Investing | |
| 12Stocks.com: Top Performing Small Cap Index Stocks | ||||||||||||||||||||||||||||||||||||||||||||||||
 The top performing Small Cap Index stocks year to date are
Now, more recently, over last week, the top performing Small Cap Index stocks on the move are


|
||||||||||||||||||||||||||||||||||||||||||||||||
| 12Stocks.com: Investing in Smallcap Index using Exchange Traded Funds | |
|
The following table shows list of key exchange traded funds (ETF) that
help investors track Smallcap index. The following list also includes leveraged ETF funds that track twice or thrice the daily returns of Smallcap indices. Short or inverse ETF funds move in the opposite direction to the index they track and are useful during market pullbacks or during bear markets. Quick View: Move mouse or cursor over ETF symbol (ticker) to view short-term technical chart and over ETF name to view long term chart. Click on ticker or stock name for detailed view. Click on to add stock symbol to your watchlist and to view watchlist. |
12Stocks.com List of ETFs that track Smallcap Index
| Ticker | ETF Name | Watchlist | Recent Price | Smart Investing & Trading Score | Change % | Week % | Year-to-date % |
| IWM | iShares Russell 2000 | | 204.97 | 87 | 0.22 | 1.52 | 2.12% |
| IJR | iShares Core S&P Small-Cap | | 108.62 | 100 | 0.33 | 1.39 | 0.34% |
| VTWO | Vanguard Russell 2000 ETF | | 82.84 | 82 | 0.22 | 1.51 | 2.15% |
| IWN | iShares Russell 2000 Value | | 155.63 | 100 | -0.01 | 0.92 | 0.19% |
| IWO | iShares Russell 2000 Growth | | 262.30 | 82 | 0.49 | 2.11 | 4% |
| IJS | iShares S&P Small-Cap 600 Value | | 99.68 | 69 | -0.07 | 0.97 | -3.29% |
| IJT | iShares S&P Small-Cap 600 Growth | | 129.84 | 95 | 0.56 | 1.63 | 3.76% |
| XSLV | PowerShares S&P SmallCap Low Volatil ETF | | 44.00 | 100 | 0.96 | 1.8 | -0.34% |
| SAA | ProShares Ultra SmallCap600 | | 24.39 | 95 | 1.16 | 3.39 | -2.24% |
| SMLV | SPDR SSGA US Small Cap Low Volatil ETF | | 110.48 | 100 | -0.10 | 0.72 | -1.81% |
| SBB | ProShares Short SmallCap600 | | 15.97 | 0 | -0.50 | -1.18 | 0.25% |
| SDD | ProShares UltraShort SmallCap600 | | 18.22 | 10 | -1.10 | -3.33 | -1.13% |
| 12Stocks.com: Charts, Trends, Fundamental Data and Performances of SmallCap Stocks | |
|
We now take in-depth look at all SmallCap stocks including charts, multi-period performances and overall trends (as measured by Smart Investing & Trading Score). One can sort SmallCap stocks (click link to choose) by Daily, Weekly and by Year-to-Date performances. Also, one can sort by size of the company or by market capitalization. |
| Select Your Default Chart Type: | |||||
| |||||
| Click on stock symbol or name for detailed view. Click on to add stock symbol to your watchlist and to view watchlist. Quick View: Move mouse or cursor over "Daily" to quickly view daily technical stock chart and over "Weekly" to view weekly technical stock chart. | |||||

 | SR Spire Inc. |
| Sector: Utilities | |
| SubSector: Gas Utilities | |
| MarketCap: 3745.87 Millions | |
| Recent Price: 61.81 Smart Investing & Trading Score: 88 | |
| Day Percent Change: 1.05% Day Change: 0.64 | |
| Week Change: 0.82% Year-to-date Change: -0.9% | |
| SR Links: Profile News Message Board | |
| Charts:- Daily , Weekly | |
| Add SR to Watchlist: View: Get Complete SR Trend Analysis ➞ | |
 | BV BrightView Holdings, Inc. |
| Sector: Industrials | |
| SubSector: General Contractors | |
| MarketCap: 973.763 Millions | |
| Recent Price: 12.52 Smart Investing & Trading Score: 88 | |
| Day Percent Change: 1.05% Day Change: 0.13 | |
| Week Change: -1.11% Year-to-date Change: 48.7% | |
| BV Links: Profile News Message Board | |
| Charts:- Daily , Weekly | |
| Add BV to Watchlist: View: Get Complete BV Trend Analysis ➞ | |
 | LE Lands End, Inc. |
| Sector: Services & Goods | |
| SubSector: Catalog & Mail Order Houses | |
| MarketCap: 268.692 Millions | |
| Recent Price: 14.44 Smart Investing & Trading Score: 95 | |
| Day Percent Change: 1.05% Day Change: 0.15 | |
| Week Change: 1.76% Year-to-date Change: 51.1% | |
| LE Links: Profile News Message Board | |
| Charts:- Daily , Weekly | |
| Add LE to Watchlist: View: Get Complete LE Trend Analysis ➞ | |
 | REVG REV Group, Inc. |
| Sector: Consumer Staples | |
| SubSector: Trucks & Other Vehicles | |
| MarketCap: 398.597 Millions | |
| Recent Price: 24.17 Smart Investing & Trading Score: 100 | |
| Day Percent Change: 1.05% Day Change: 0.25 | |
| Week Change: 3.96% Year-to-date Change: 33.0% | |
| REVG Links: Profile News Message Board | |
| Charts:- Daily , Weekly | |
| Add REVG to Watchlist: View: Get Complete REVG Trend Analysis ➞ | |
 | LXP Lexington Realty Trust |
| Sector: Financials | |
| SubSector: REIT - Diversified | |
| MarketCap: 2483.43 Millions | |
| Recent Price: 8.77 Smart Investing & Trading Score: 93 | |
| Day Percent Change: 1.04% Day Change: 0.09 | |
| Week Change: 0.57% Year-to-date Change: -11.6% | |
| LXP Links: Profile News Message Board | |
| Charts:- Daily , Weekly | |
| Add LXP to Watchlist: View: Get Complete LXP Trend Analysis ➞ | |
 | FFIN First Financial Bankshares, Inc. |
| Sector: Financials | |
| SubSector: Regional - Southwest Banks | |
| MarketCap: 3503.75 Millions | |
| Recent Price: 31.08 Smart Investing & Trading Score: 87 | |
| Day Percent Change: 1.04% Day Change: 0.32 | |
| Week Change: 1.04% Year-to-date Change: 2.6% | |
| FFIN Links: Profile News Message Board | |
| Charts:- Daily , Weekly | |
| Add FFIN to Watchlist: View: Get Complete FFIN Trend Analysis ➞ | |
 | ACIW ACI Worldwide, Inc. |
| Sector: Technology | |
| SubSector: Technical & System Software | |
| MarketCap: 2645.7 Millions | |
| Recent Price: 35.88 Smart Investing & Trading Score: 100 | |
| Day Percent Change: 1.04% Day Change: 0.37 | |
| Week Change: 2.16% Year-to-date Change: 17.3% | |
| ACIW Links: Profile News Message Board | |
| Charts:- Daily , Weekly | |
| Add ACIW to Watchlist: View: Get Complete ACIW Trend Analysis ➞ | |
 | LOVE The Lovesac Company |
| Sector: Consumer Staples | |
| SubSector: Home Furnishings & Fixtures | |
| MarketCap: 112.835 Millions | |
| Recent Price: 24.27 Smart Investing & Trading Score: 100 | |
| Day Percent Change: 1.04% Day Change: 0.25 | |
| Week Change: 3.81% Year-to-date Change: -5.0% | |
| LOVE Links: Profile News Message Board | |
| Charts:- Daily , Weekly | |
| Add LOVE to Watchlist: View: Get Complete LOVE Trend Analysis ➞ | |
 | COUR Coursera, Inc. |
| Sector: Consumer Staples | |
| SubSector: Education & Training Services | |
| MarketCap: 1990 Millions | |
| Recent Price: 9.68 Smart Investing & Trading Score: 28 | |
| Day Percent Change: 1.04% Day Change: 0.10 | |
| Week Change: 0.1% Year-to-date Change: -50.8% | |
| COUR Links: Profile News Message Board | |
| Charts:- Daily , Weekly | |
| Add COUR to Watchlist: View: Get Complete COUR Trend Analysis ➞ | |
 | SCS Steelcase Inc. |
| Sector: Consumer Staples | |
| SubSector: Business Equipment | |
| MarketCap: 1310.77 Millions | |
| Recent Price: 12.70 Smart Investing & Trading Score: 64 | |
| Day Percent Change: 1.03% Day Change: 0.13 | |
| Week Change: 1.68% Year-to-date Change: -6.1% | |
| SCS Links: Profile News Message Board | |
| Charts:- Daily , Weekly | |
| Add SCS to Watchlist: View: Get Complete SCS Trend Analysis ➞ | |
 | UNF UniFirst Corporation |
| Sector: Consumer Staples | |
| SubSector: Textile - Apparel Clothing | |
| MarketCap: 2605.65 Millions | |
| Recent Price: 163.04 Smart Investing & Trading Score: 64 | |
| Day Percent Change: 1.03% Day Change: 1.66 | |
| Week Change: 2.16% Year-to-date Change: -10.9% | |
| UNF Links: Profile News Message Board | |
| Charts:- Daily , Weekly | |
| Add UNF to Watchlist: View: Get Complete UNF Trend Analysis ➞ | |
 | DVAX Dynavax Technologies Corporation |
| Sector: Health Care | |
| SubSector: Biotechnology | |
| MarketCap: 276.885 Millions | |
| Recent Price: 11.76 Smart Investing & Trading Score: 42 | |
| Day Percent Change: 1.03% Day Change: 0.12 | |
| Week Change: 0.17% Year-to-date Change: -15.9% | |
| DVAX Links: Profile News Message Board | |
| Charts:- Daily , Weekly | |
| Add DVAX to Watchlist: View: Get Complete DVAX Trend Analysis ➞ | |
 | KOD Kodiak Sciences Inc. |
| Sector: Health Care | |
| SubSector: Biotechnology | |
| MarketCap: 2132.15 Millions | |
| Recent Price: 3.98 Smart Investing & Trading Score: 69 | |
| Day Percent Change: 1.02% Day Change: 0.04 | |
| Week Change: 5.57% Year-to-date Change: 30.9% | |
| KOD Links: Profile News Message Board | |
| Charts:- Daily , Weekly | |
| Add KOD to Watchlist: View: Get Complete KOD Trend Analysis ➞ | |
 | PDCO Patterson Companies, Inc. |
| Sector: Services & Goods | |
| SubSector: Medical Equipment Wholesale | |
| MarketCap: 1672.2 Millions | |
| Recent Price: 26.02 Smart Investing & Trading Score: 49 | |
| Day Percent Change: 1.01% Day Change: 0.26 | |
| Week Change: 1.4% Year-to-date Change: -8.5% | |
| PDCO Links: Profile News Message Board | |
| Charts:- Daily , Weekly | |
| Add PDCO to Watchlist: View: Get Complete PDCO Trend Analysis ➞ | |
 | CMPR Cimpress plc |
| Sector: Services & Goods | |
| SubSector: Business Services | |
| MarketCap: 1675.02 Millions | |
| Recent Price: 84.24 Smart Investing & Trading Score: 25 | |
| Day Percent Change: 1.01% Day Change: 0.84 | |
| Week Change: 1.38% Year-to-date Change: 5.2% | |
| CMPR Links: Profile News Message Board | |
| Charts:- Daily , Weekly | |
| Add CMPR to Watchlist: View: Get Complete CMPR Trend Analysis ➞ | |
 | CPRX Catalyst Pharmaceuticals, Inc. |
| Sector: Health Care | |
| SubSector: Biotechnology | |
| MarketCap: 365.185 Millions | |
| Recent Price: 15.14 Smart Investing & Trading Score: 50 | |
| Day Percent Change: 1.00% Day Change: 0.15 | |
| Week Change: 2.85% Year-to-date Change: -9.9% | |
| CPRX Links: Profile News Message Board | |
| Charts:- Daily , Weekly | |
| Add CPRX to Watchlist: View: Get Complete CPRX Trend Analysis ➞ | |
 | BLUE bluebird bio, Inc. |
| Sector: Health Care | |
| SubSector: Biotechnology | |
| MarketCap: 3365.05 Millions | |
| Recent Price: 1.01 Smart Investing & Trading Score: 54 | |
| Day Percent Change: 1.00% Day Change: 0.01 | |
| Week Change: 12.25% Year-to-date Change: -26.8% | |
| BLUE Links: Profile News Message Board | |
| Charts:- Daily , Weekly | |
| Add BLUE to Watchlist: View: Get Complete BLUE Trend Analysis ➞ | |
 | VRA Vera Bradley, Inc. |
| Sector: Consumer Staples | |
| SubSector: Textile - Apparel Footwear & Accessories | |
| MarketCap: 151.17 Millions | |
| Recent Price: 7.09 Smart Investing & Trading Score: 64 | |
| Day Percent Change: 1.00% Day Change: 0.07 | |
| Week Change: 3.65% Year-to-date Change: -7.9% | |
| VRA Links: Profile News Message Board | |
| Charts:- Daily , Weekly | |
| Add VRA to Watchlist: View: Get Complete VRA Trend Analysis ➞ | |
 | OUT Outfront Media Inc. |
| Sector: Services & Goods | |
| SubSector: Marketing Services | |
| MarketCap: 1388.15 Millions | |
| Recent Price: 15.12 Smart Investing & Trading Score: 51 | |
| Day Percent Change: 1.00% Day Change: 0.15 | |
| Week Change: 0.2% Year-to-date Change: 8.3% | |
| OUT Links: Profile News Message Board | |
| Charts:- Daily , Weekly | |
| Add OUT to Watchlist: View: Get Complete OUT Trend Analysis ➞ | |
 | TPIC TPI Composites, Inc. |
| Sector: Industrials | |
| SubSector: Diversified Machinery | |
| MarketCap: 451.016 Millions | |
| Recent Price: 4.03 Smart Investing & Trading Score: 100 | |
| Day Percent Change: 1.00% Day Change: 0.04 | |
| Week Change: 7.75% Year-to-date Change: -2.7% | |
| TPIC Links: Profile News Message Board | |
| Charts:- Daily , Weekly | |
| Add TPIC to Watchlist: View: Get Complete TPIC Trend Analysis ➞ | |
 | PRVA Privia Health Group, Inc. |
| Sector: Health Care | |
| SubSector: Health Information Services | |
| MarketCap: 3130 Millions | |
| Recent Price: 19.25 Smart Investing & Trading Score: 74 | |
| Day Percent Change: 1.00% Day Change: 0.19 | |
| Week Change: 4.28% Year-to-date Change: -18.5% | |
| PRVA Links: Profile News Message Board | |
| Charts:- Daily , Weekly | |
| Add PRVA to Watchlist: View: Get Complete PRVA Trend Analysis ➞ | |
 | AVA Avista Corporation |
| Sector: Utilities | |
| SubSector: Diversified Utilities | |
| MarketCap: 2755.7 Millions | |
| Recent Price: 37.75 Smart Investing & Trading Score: 95 | |
| Day Percent Change: 0.99% Day Change: 0.37 | |
| Week Change: 1.21% Year-to-date Change: 5.6% | |
| AVA Links: Profile News Message Board | |
| Charts:- Daily , Weekly | |
| Add AVA to Watchlist: View: Get Complete AVA Trend Analysis ➞ | |
 | IPI Intrepid Potash, Inc. |
| Sector: Materials | |
| SubSector: Agricultural Chemicals | |
| MarketCap: 160.329 Millions | |
| Recent Price: 21.33 Smart Investing & Trading Score: 100 | |
| Day Percent Change: 0.99% Day Change: 0.21 | |
| Week Change: 2.65% Year-to-date Change: -10.7% | |
| IPI Links: Profile News Message Board | |
| Charts:- Daily , Weekly | |
| Add IPI to Watchlist: View: Get Complete IPI Trend Analysis ➞ | |
 | CAL Caleres, Inc. |
| Sector: Consumer Staples | |
| SubSector: Textile - Apparel Footwear & Accessories | |
| MarketCap: 224.07 Millions | |
| Recent Price: 38.10 Smart Investing & Trading Score: 64 | |
| Day Percent Change: 0.98% Day Change: 0.37 | |
| Week Change: 3.06% Year-to-date Change: 24.0% | |
| CAL Links: Profile News Message Board | |
| Charts:- Daily , Weekly | |
| Add CAL to Watchlist: View: Get Complete CAL Trend Analysis ➞ | |
 | LANC Lancaster Colony Corporation |
| Sector: Consumer Staples | |
| SubSector: Food - Major Diversified | |
| MarketCap: 4060.83 Millions | |
| Recent Price: 193.79 Smart Investing & Trading Score: 54 | |
| Day Percent Change: 0.98% Day Change: 1.88 | |
| Week Change: 1.2% Year-to-date Change: 16.5% | |
| LANC Links: Profile News Message Board | |
| Charts:- Daily , Weekly | |
| Add LANC to Watchlist: View: Get Complete LANC Trend Analysis ➞ | |
| Too many stocks? View smallcap stocks filtered by marketcap & sector |
| Marketcap: All SmallCap Stocks (default-no microcap), Large, Mid-Range, Small & MicroCap |
| Sector: Tech, Finance, Energy, Staples, Retail, Industrial, Materials, Utilities & Medical |
|
Best Stocks Today 12Stocks.com |
© 2024 12Stocks.com Terms & Conditions Privacy Contact Us
All Information Provided Only For Education And Not To Be Used For Investing or Trading. See Terms & Conditions


One More Thing ... Get Best Stocks Delivered Daily!
Never Ever Miss A Move With Our Top Ten Stocks Lists
Find Best Stocks In Any Market - Bull or Bear Market
Take A Peek At Our Top Ten Stocks Lists: Daily, Weekly, Year-to-Date & Top Trends
Find Best Stocks In Any Market - Bull or Bear Market
Take A Peek At Our Top Ten Stocks Lists: Daily, Weekly, Year-to-Date & Top Trends
Smallcap Stocks With Best Up Trends [0-bearish to 100-bullish]: Design [100], Ambac Financial[100], Summit [100], EverQuote [100], Zeta Global[100], Coca-Cola Consolidated[100], J & J Snack Foods[100], Sterling Construction[100], Vanda [100], CPI Card[100], Semrush [100]
Best Smallcap Stocks Year-to-Date:
CareMax [570.1%], Janux [472.36%], Viking [327.78%], Longboard [260.8%], Alpine Immune[239.34%], Bakkt [226.91%], Vera [190.7%], Super Micro[188.22%], Cullinan Oncology[187.89%], Avidity Biosciences[180.86%], Y-mAbs [152.49%] Best Smallcap Stocks This Week:
Perficient [52.32%], Thoughtworks Holding[34.22%], Trupanion [28.72%], DASAN Zhone[26.29%], Great Lakes[25.72%], Workhorse Group[24.5%], Design [23.42%], Ambac Financial[22.97%], P3 Health[22.36%], Outset Medical[21.09%], Summit [20.96%] Best Smallcap Stocks Daily:
Design [28.85%], Great Lakes[24.29%], Thoughtworks Holding[19.84%], Ambac Financial[19.31%], Summit [18.79%], EverQuote [18.40%], Origin Materials[18.38%], Zeta Global[18.35%], FibroGen [18.10%], Coca-Cola Consolidated[17.65%], Children s[16.44%]