
 Login Sign Up


| |||||
 |  | ||||

| 12Stocks.com Market Intelligence |
Best SmallCap Stocks
|
| In a hurry? Small Cap Stock Lists: Performance Trends Table, Stock Charts
Sort Small Cap stocks: Daily, Weekly, Year-to-Date, Market Cap & Trends. Filter Small Cap stocks list by sector: Show all, Tech, Finance, Energy, Staples, Retail, Industrial, Materials, Utilities and HealthCare Filter Small Cap stocks list by size: All Large Medium Small and MicroCap |
| 12Stocks.com Small Cap Stocks Performances & Trends Daily | |||||||||
|
|  The overall Smart Investing & Trading Score is 70 (0-bearish to 100-bullish) which puts Small Cap index in short term neutral to bullish trend. The Smart Investing & Trading Score from previous trading session is 87 and hence a deterioration of trend.
| ||||||||
Here are the Smart Investing & Trading Scores of the most requested small cap stocks at 12Stocks.com (click stock name for detailed review):
|


| 12Stocks.com: Investing in Smallcap Index with Stocks | |
|
The following table helps investors and traders sort through current performance and trends (as measured by Smart Investing & Trading Score) of various
stocks in the Smallcap Index. Quick View: Move mouse or cursor over stock symbol (ticker) to view short-term technical chart and over stock name to view long term chart. Click on  to add stock symbol to your watchlist and to add stock symbol to your watchlist and  to view watchlist. Click on any ticker or stock name for detailed market intelligence report for that stock. to view watchlist. Click on any ticker or stock name for detailed market intelligence report for that stock. |
12Stocks.com Performance of Stocks in Smallcap Index
| Ticker | Stock Name | Watchlist | Category | Recent Price | Smart Investing & Trading Score | Change % | YTD Change% |
| IMMR | Immersion |   | Technology | 7.51 | 100 | 1.90 | 6.37% |
| CNXN | PC Connection | | Technology | 63.75 | 57 | 1.90 | -5.15% |
| CEVA | CEVA | | Technology | 21.17 | 67 | 1.88 | -6.78% |
| AVD | American Vanguard | | Materials | 12.46 | 100 | 1.88 | 13.58% |
| HBCP | Home Bancorp | | Financials | 37.60 | 100 | 1.87 | -10.50% |
| PRM | Perimeter Solutions | | Materials | 7.67 | 88 | 1.86 | 66.92% |
| ONEW | OneWater Marine | | Services & Goods | 23.33 | 52 | 1.86 | -30.96% |
| BGS | B&G Foods | | Consumer Staples | 11.55 | 69 | 1.85 | 10.00% |
| TIPT | Tiptree | | Financials | 16.53 | 37 | 1.85 | -12.82% |
| KFY | Korn Ferry | | Services & Goods | 64.08 | 75 | 1.80 | 7.97% |
| GLT | P. H. | | Consumer Staples | 1.70 | 74 | 1.80 | -12.37% |
| HONE | HarborOne Bancorp | | Financials | 10.77 | 90 | 1.80 | -10.10% |
| SKIN | Beauty Health | | Consumer Staples | 3.43 | 83 | 1.78 | 8.37% |
| WGO | Winnebago Industries | | Consumer Staples | 62.80 | 42 | 1.77 | -13.83% |
| ATLO | Ames National | | Financials | 20.69 | 100 | 1.77 | -3.05% |
| MGPI | MGP Ingredients | | Consumer Staples | 82.22 | 74 | 1.76 | -16.54% |
| PKBK | Parke Bancorp | | Financials | 16.84 | 67 | 1.75 | -16.84% |
| RYAM | Rayonier Advanced | | Materials | 4.07 | 68 | 1.75 | 0.49% |
| SAVA | Cassava Sciences | | Health Care | 21.50 | 42 | 1.75 | -4.49% |
| IONQ | IonQ | | Technology | 8.78 | 32 | 1.74 | -29.56% |
| CPF | Central Pacific | | Financials | 21.13 | 88 | 1.73 | 7.37% |
| MC | Moelis & | | Financials | 52.93 | 57 | 1.73 | -5.70% |
| FFIC | Flushing Financial | | Financials | 12.41 | 67 | 1.72 | -24.70% |
| NE | Noble | | Energy | 46.42 | 59 | 1.71 | -3.61% |
| MOFG | MidWestOne Financial | | Financials | 21.44 | 55 | 1.71 | -20.33% |


| Too many stocks? View smallcap stocks filtered by marketcap & sector |
| Marketcap: All SmallCap Stocks (default-no microcap), Large, Mid-Range, Small |
| Smallcap Sector: Tech, Finance, Energy, Staples, Retail, Industrial, Materials, & Medical |
|
Get the most comprehensive stock market coverage daily at 12Stocks.com ➞ Best Stocks Today ➞ Best Stocks Weekly ➞ Best Stocks Year-to-Date ➞ Best Stocks Trends ➞  Best Stocks Today 12Stocks.com Best Nasdaq Stocks ➞ Best S&P 500 Stocks ➞ Best Tech Stocks ➞ Best Biotech Stocks ➞ |
| Detailed Overview of SmallCap Stocks |
| SmallCap Technical Overview, Leaders & Laggards, Top SmallCap ETF Funds & Detailed SmallCap Stocks List, Charts, Trends & More |
| Smallcap: Technical Analysis, Trends & YTD Performance | |
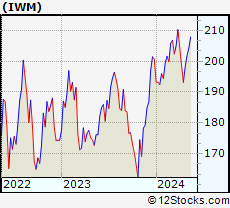
| SmallCap segment as represented by
IWM, an exchange-traded fund [ETF], holds basket of thousands of smallcap stocks from across all major sectors of the US stock market. The smallcap index (contains stocks like Riverbed & Sotheby's) is up by 1.53% and is currently underperforming the overall market by -6.51% year-to-date. Below is a quick view of technical charts and trends: | |
 IWM Weekly Chart |
|
| Long Term Trend: Very Good | |
| Medium Term Trend: Very Good | |
 IWM Daily Chart |
|
| Short Term Trend: Good | |
| Overall Trend Score: 70 | |
| YTD Performance: 1.53% | |
| **Trend Scores & Views Are Only For Educational Purposes And Not For Investing | |
| 12Stocks.com: Top Performing Small Cap Index Stocks | ||||||||||||||||||||||||||||||||||||||||||||||||
 The top performing Small Cap Index stocks year to date are
Now, more recently, over last week, the top performing Small Cap Index stocks on the move are


|
||||||||||||||||||||||||||||||||||||||||||||||||
| 12Stocks.com: Investing in Smallcap Index using Exchange Traded Funds | |
|
The following table shows list of key exchange traded funds (ETF) that
help investors track Smallcap index. The following list also includes leveraged ETF funds that track twice or thrice the daily returns of Smallcap indices. Short or inverse ETF funds move in the opposite direction to the index they track and are useful during market pullbacks or during bear markets. Quick View: Move mouse or cursor over ETF symbol (ticker) to view short-term technical chart and over ETF name to view long term chart. Click on ticker or stock name for detailed view. Click on to add stock symbol to your watchlist and to view watchlist. |
12Stocks.com List of ETFs that track Smallcap Index
| Ticker | ETF Name | Watchlist | Recent Price | Smart Investing & Trading Score | Change % | Week % | Year-to-date % |
| IWM | iShares Russell 2000 | | 203.78 | 70 | -0.58 | 0.93 | 1.53% |
| IJR | iShares Core S&P Small-Cap | | 108.26 | 88 | -0.33 | 1.05 | 0.01% |
| IWN | iShares Russell 2000 Value | | 155.37 | 88 | -0.17 | 0.75 | 0.03% |
| VTWO | Vanguard Russell 2000 ETF | | 82.40 | 57 | -0.53 | 0.97 | 1.6% |
| IWO | iShares Russell 2000 Growth | | 260.10 | 57 | -0.84 | 1.26 | 3.12% |
| IJS | iShares S&P Small-Cap 600 Value | | 99.80 | 70 | 0.12 | 1.09 | -3.17% |
| IJT | iShares S&P Small-Cap 600 Growth | | 129.03 | 83 | -0.62 | 0.99 | 3.11% |
| XSLV | PowerShares S&P SmallCap Low Volatil ETF | | 43.94 | 100 | -0.14 | 1.67 | -0.48% |
| SMLV | SPDR SSGA US Small Cap Low Volatil ETF | | 110.32 | 68 | -0.15 | 0.57 | -1.96% |
| SDD | ProShares UltraShort SmallCap600 | | 18.66 | 40 | 2.43 | -0.98 | 1.27% |
| SBB | ProShares Short SmallCap600 | | 16.08 | 38 | 0.69 | -0.5 | 0.94% |
| SAA | ProShares Ultra SmallCap600 | | 24.21 | 70 | -0.75 | 2.62 | -2.98% |
| 12Stocks.com: Charts, Trends, Fundamental Data and Performances of SmallCap Stocks | |
|
We now take in-depth look at all SmallCap stocks including charts, multi-period performances and overall trends (as measured by Smart Investing & Trading Score). One can sort SmallCap stocks (click link to choose) by Daily, Weekly and by Year-to-Date performances. Also, one can sort by size of the company or by market capitalization. |
| Select Your Default Chart Type: | |||||
| |||||
| Click on stock symbol or name for detailed view. Click on to add stock symbol to your watchlist and to view watchlist. Quick View: Move mouse or cursor over "Daily" to quickly view daily technical stock chart and over "Weekly" to view weekly technical stock chart. | |||||

 | IMMR Immersion Corporation |
| Sector: Technology | |
| SubSector: Application Software | |
| MarketCap: 173.462 Millions | |
| Recent Price: 7.51 Smart Investing & Trading Score: 100 | |
| Day Percent Change: 1.90% Day Change: 0.14 | |
| Week Change: 4.02% Year-to-date Change: 6.4% | |
| IMMR Links: Profile News Message Board | |
| Charts:- Daily , Weekly | |
| Add IMMR to Watchlist: View: Get Complete IMMR Trend Analysis ➞ | |
 | CNXN PC Connection, Inc. |
| Sector: Technology | |
| SubSector: Computers Wholesale | |
| MarketCap: 1020.19 Millions | |
| Recent Price: 63.75 Smart Investing & Trading Score: 57 | |
| Day Percent Change: 1.90% Day Change: 1.19 | |
| Week Change: 4.22% Year-to-date Change: -5.2% | |
| CNXN Links: Profile News Message Board | |
| Charts:- Daily , Weekly | |
| Add CNXN to Watchlist: View: Get Complete CNXN Trend Analysis ➞ | |
 | CEVA CEVA, Inc. |
| Sector: Technology | |
| SubSector: Semiconductor - Specialized | |
| MarketCap: 587.06 Millions | |
| Recent Price: 21.17 Smart Investing & Trading Score: 67 | |
| Day Percent Change: 1.88% Day Change: 0.39 | |
| Week Change: 3.12% Year-to-date Change: -6.8% | |
| CEVA Links: Profile News Message Board | |
| Charts:- Daily , Weekly | |
| Add CEVA to Watchlist: View: Get Complete CEVA Trend Analysis ➞ | |
 | AVD American Vanguard Corporation |
| Sector: Materials | |
| SubSector: Agricultural Chemicals | |
| MarketCap: 419.329 Millions | |
| Recent Price: 12.46 Smart Investing & Trading Score: 100 | |
| Day Percent Change: 1.88% Day Change: 0.23 | |
| Week Change: 5.86% Year-to-date Change: 13.6% | |
| AVD Links: Profile News Message Board | |
| Charts:- Daily , Weekly | |
| Add AVD to Watchlist: View: Get Complete AVD Trend Analysis ➞ | |
 | HBCP Home Bancorp, Inc. |
| Sector: Financials | |
| SubSector: Savings & Loans | |
| MarketCap: 206.83 Millions | |
| Recent Price: 37.60 Smart Investing & Trading Score: 100 | |
| Day Percent Change: 1.87% Day Change: 0.69 | |
| Week Change: 1.76% Year-to-date Change: -10.5% | |
| HBCP Links: Profile News Message Board | |
| Charts:- Daily , Weekly | |
| Add HBCP to Watchlist: View: Get Complete HBCP Trend Analysis ➞ | |
 | PRM Perimeter Solutions, SA |
| Sector: Materials | |
| SubSector: Specialty Chemicals | |
| MarketCap: 930 Millions | |
| Recent Price: 7.67 Smart Investing & Trading Score: 88 | |
| Day Percent Change: 1.86% Day Change: 0.14 | |
| Week Change: 6.45% Year-to-date Change: 66.9% | |
| PRM Links: Profile News Message Board | |
| Charts:- Daily , Weekly | |
| Add PRM to Watchlist: View: Get Complete PRM Trend Analysis ➞ | |
 | ONEW OneWater Marine Inc. |
| Sector: Services & Goods | |
| SubSector: Recreational Vehicles | |
| MarketCap: 42027 Millions | |
| Recent Price: 23.33 Smart Investing & Trading Score: 52 | |
| Day Percent Change: 1.86% Day Change: 0.42 | |
| Week Change: 2.87% Year-to-date Change: -31.0% | |
| ONEW Links: Profile News Message Board | |
| Charts:- Daily , Weekly | |
| Add ONEW to Watchlist: View: Get Complete ONEW Trend Analysis ➞ | |
 | BGS B&G Foods, Inc. |
| Sector: Consumer Staples | |
| SubSector: Processed & Packaged Goods | |
| MarketCap: 1456.08 Millions | |
| Recent Price: 11.55 Smart Investing & Trading Score: 69 | |
| Day Percent Change: 1.85% Day Change: 0.21 | |
| Week Change: 1.4% Year-to-date Change: 10.0% | |
| BGS Links: Profile News Message Board | |
| Charts:- Daily , Weekly | |
| Add BGS to Watchlist: View: Get Complete BGS Trend Analysis ➞ | |
 | TIPT Tiptree Inc. |
| Sector: Financials | |
| SubSector: Life Insurance | |
| MarketCap: 183.486 Millions | |
| Recent Price: 16.53 Smart Investing & Trading Score: 37 | |
| Day Percent Change: 1.85% Day Change: 0.30 | |
| Week Change: -0.72% Year-to-date Change: -12.8% | |
| TIPT Links: Profile News Message Board | |
| Charts:- Daily , Weekly | |
| Add TIPT to Watchlist: View: Get Complete TIPT Trend Analysis ➞ | |
 | KFY Korn Ferry |
| Sector: Services & Goods | |
| SubSector: Staffing & Outsourcing Services | |
| MarketCap: 1534.28 Millions | |
| Recent Price: 64.08 Smart Investing & Trading Score: 75 | |
| Day Percent Change: 1.80% Day Change: 1.13 | |
| Week Change: 2.91% Year-to-date Change: 8.0% | |
| KFY Links: Profile News Message Board | |
| Charts:- Daily , Weekly | |
| Add KFY to Watchlist: View: Get Complete KFY Trend Analysis ➞ | |
 | GLT P. H. Glatfelter Company |
| Sector: Consumer Staples | |
| SubSector: Paper & Paper Products | |
| MarketCap: 525.003 Millions | |
| Recent Price: 1.70 Smart Investing & Trading Score: 74 | |
| Day Percent Change: 1.80% Day Change: 0.03 | |
| Week Change: 3.03% Year-to-date Change: -12.4% | |
| GLT Links: Profile News Message Board | |
| Charts:- Daily , Weekly | |
| Add GLT to Watchlist: View: Get Complete GLT Trend Analysis ➞ | |
 | HONE HarborOne Bancorp, Inc. |
| Sector: Financials | |
| SubSector: Savings & Loans | |
| MarketCap: 456.03 Millions | |
| Recent Price: 10.77 Smart Investing & Trading Score: 90 | |
| Day Percent Change: 1.80% Day Change: 0.19 | |
| Week Change: 1.6% Year-to-date Change: -10.1% | |
| HONE Links: Profile News Message Board | |
| Charts:- Daily , Weekly | |
| Add HONE to Watchlist: View: Get Complete HONE Trend Analysis ➞ | |
 | SKIN The Beauty Health Company |
| Sector: Consumer Staples | |
| SubSector: Household & Personal Products | |
| MarketCap: 1070 Millions | |
| Recent Price: 3.43 Smart Investing & Trading Score: 83 | |
| Day Percent Change: 1.78% Day Change: 0.06 | |
| Week Change: 4.89% Year-to-date Change: 8.4% | |
| SKIN Links: Profile News Message Board | |
| Charts:- Daily , Weekly | |
| Add SKIN to Watchlist: View: Get Complete SKIN Trend Analysis ➞ | |
 | WGO Winnebago Industries, Inc. |
| Sector: Consumer Staples | |
| SubSector: Recreational Vehicles | |
| MarketCap: 896.559 Millions | |
| Recent Price: 62.80 Smart Investing & Trading Score: 42 | |
| Day Percent Change: 1.77% Day Change: 1.09 | |
| Week Change: 0.08% Year-to-date Change: -13.8% | |
| WGO Links: Profile News Message Board | |
| Charts:- Daily , Weekly | |
| Add WGO to Watchlist: View: Get Complete WGO Trend Analysis ➞ | |
 | ATLO Ames National Corporation |
| Sector: Financials | |
| SubSector: Regional - Northeast Banks | |
| MarketCap: 195.999 Millions | |
| Recent Price: 20.69 Smart Investing & Trading Score: 100 | |
| Day Percent Change: 1.77% Day Change: 0.36 | |
| Week Change: 2.07% Year-to-date Change: -3.1% | |
| ATLO Links: Profile News Message Board | |
| Charts:- Daily , Weekly | |
| Add ATLO to Watchlist: View: Get Complete ATLO Trend Analysis ➞ | |
 | MGPI MGP Ingredients, Inc. |
| Sector: Consumer Staples | |
| SubSector: Beverages - Wineries & Distillers | |
| MarketCap: 502.635 Millions | |
| Recent Price: 82.22 Smart Investing & Trading Score: 74 | |
| Day Percent Change: 1.76% Day Change: 1.42 | |
| Week Change: 1.98% Year-to-date Change: -16.5% | |
| MGPI Links: Profile News Message Board | |
| Charts:- Daily , Weekly | |
| Add MGPI to Watchlist: View: Get Complete MGPI Trend Analysis ➞ | |
 | PKBK Parke Bancorp, Inc. |
| Sector: Financials | |
| SubSector: Regional - Northeast Banks | |
| MarketCap: 165.799 Millions | |
| Recent Price: 16.84 Smart Investing & Trading Score: 67 | |
| Day Percent Change: 1.75% Day Change: 0.29 | |
| Week Change: 0% Year-to-date Change: -16.8% | |
| PKBK Links: Profile News Message Board | |
| Charts:- Daily , Weekly | |
| Add PKBK to Watchlist: View: Get Complete PKBK Trend Analysis ➞ | |
 | RYAM Rayonier Advanced Materials Inc. |
| Sector: Materials | |
| SubSector: Chemicals - Major Diversified | |
| MarketCap: 116.736 Millions | |
| Recent Price: 4.07 Smart Investing & Trading Score: 68 | |
| Day Percent Change: 1.75% Day Change: 0.07 | |
| Week Change: 2.26% Year-to-date Change: 0.5% | |
| RYAM Links: Profile News Message Board | |
| Charts:- Daily , Weekly | |
| Add RYAM to Watchlist: View: Get Complete RYAM Trend Analysis ➞ | |
 | SAVA Cassava Sciences, Inc. |
| Sector: Health Care | |
| SubSector: Biotechnology | |
| MarketCap: 86.6785 Millions | |
| Recent Price: 21.50 Smart Investing & Trading Score: 42 | |
| Day Percent Change: 1.75% Day Change: 0.37 | |
| Week Change: -2.49% Year-to-date Change: -4.5% | |
| SAVA Links: Profile News Message Board | |
| Charts:- Daily , Weekly | |
| Add SAVA to Watchlist: View: Get Complete SAVA Trend Analysis ➞ | |
 | IONQ IonQ, Inc. |
| Sector: Technology | |
| SubSector: Computer Hardware | |
| MarketCap: 2680 Millions | |
| Recent Price: 8.78 Smart Investing & Trading Score: 32 | |
| Day Percent Change: 1.74% Day Change: 0.15 | |
| Week Change: -2.28% Year-to-date Change: -29.6% | |
| IONQ Links: Profile News Message Board | |
| Charts:- Daily , Weekly | |
| Add IONQ to Watchlist: View: Get Complete IONQ Trend Analysis ➞ | |
 | CPF Central Pacific Financial Corp. |
| Sector: Financials | |
| SubSector: Regional - Pacific Banks | |
| MarketCap: 407.429 Millions | |
| Recent Price: 21.13 Smart Investing & Trading Score: 88 | |
| Day Percent Change: 1.73% Day Change: 0.36 | |
| Week Change: 1.34% Year-to-date Change: 7.4% | |
| CPF Links: Profile News Message Board | |
| Charts:- Daily , Weekly | |
| Add CPF to Watchlist: View: Get Complete CPF Trend Analysis ➞ | |
 | MC Moelis & Company |
| Sector: Financials | |
| SubSector: Asset Management | |
| MarketCap: 1675.93 Millions | |
| Recent Price: 52.93 Smart Investing & Trading Score: 57 | |
| Day Percent Change: 1.73% Day Change: 0.90 | |
| Week Change: 2.62% Year-to-date Change: -5.7% | |
| MC Links: Profile News Message Board | |
| Charts:- Daily , Weekly | |
| Add MC to Watchlist: View: Get Complete MC Trend Analysis ➞ | |
 | FFIC Flushing Financial Corporation |
| Sector: Financials | |
| SubSector: Savings & Loans | |
| MarketCap: 336.43 Millions | |
| Recent Price: 12.41 Smart Investing & Trading Score: 67 | |
| Day Percent Change: 1.72% Day Change: 0.21 | |
| Week Change: 2.14% Year-to-date Change: -24.7% | |
| FFIC Links: Profile News Message Board | |
| Charts:- Daily , Weekly | |
| Add FFIC to Watchlist: View: Get Complete FFIC Trend Analysis ➞ | |
 | NE Noble Corporation Plc |
| Sector: Energy | |
| SubSector: Oil & Gas Drilling | |
| MarketCap: 5520 Millions | |
| Recent Price: 46.42 Smart Investing & Trading Score: 59 | |
| Day Percent Change: 1.71% Day Change: 0.78 | |
| Week Change: 2.5% Year-to-date Change: -3.6% | |
| NE Links: Profile News Message Board | |
| Charts:- Daily , Weekly | |
| Add NE to Watchlist: View: Get Complete NE Trend Analysis ➞ | |
 | MOFG MidWestOne Financial Group, Inc. |
| Sector: Financials | |
| SubSector: Regional - Southwest Banks | |
| MarketCap: 345.265 Millions | |
| Recent Price: 21.44 Smart Investing & Trading Score: 55 | |
| Day Percent Change: 1.71% Day Change: 0.36 | |
| Week Change: 0.42% Year-to-date Change: -20.3% | |
| MOFG Links: Profile News Message Board | |
| Charts:- Daily , Weekly | |
| Add MOFG to Watchlist: View: Get Complete MOFG Trend Analysis ➞ | |
| Too many stocks? View smallcap stocks filtered by marketcap & sector |
| Marketcap: All SmallCap Stocks (default-no microcap), Large, Mid-Range, Small & MicroCap |
| Sector: Tech, Finance, Energy, Staples, Retail, Industrial, Materials, Utilities & Medical |
|
Best Stocks Today 12Stocks.com |
© 2024 12Stocks.com Terms & Conditions Privacy Contact Us
All Information Provided Only For Education And Not To Be Used For Investing or Trading. See Terms & Conditions


One More Thing ... Get Best Stocks Delivered Daily!
Never Ever Miss A Move With Our Top Ten Stocks Lists
Find Best Stocks In Any Market - Bull or Bear Market
Take A Peek At Our Top Ten Stocks Lists: Daily, Weekly, Year-to-Date & Top Trends
Find Best Stocks In Any Market - Bull or Bear Market
Take A Peek At Our Top Ten Stocks Lists: Daily, Weekly, Year-to-Date & Top Trends
Smallcap Stocks With Best Up Trends [0-bearish to 100-bullish]: Innodata [100], Cricut [100], DASAN Zhone[100], Latham Group[100], Hyster-Yale Materials[100], Ameresco [100], Myriad Genetics[100], Alpha and[100], Vigil Neuroscience[100], Hannon Armstrong[100], Ardmore Shipping[100]
Best Smallcap Stocks Year-to-Date:
CareMax [584.54%], Janux [415.31%], Viking [329.39%], Bakkt [294.17%], Longboard [255.16%], Alpine Immune[239.81%], Vera [190.31%], Super Micro[189.4%], Avidity Biosciences[188.27%], Cullinan Oncology[171.9%], Arcutis Bio[147.06%] Best Smallcap Stocks This Week:
DASAN Zhone[64.32%], Innodata [55.8%], Perficient [52.88%], Cricut [42.06%], Vigil Neuroscience[38.97%], Thoughtworks Holding[36.44%], Latham Group[35.53%], Great Lakes[32.04%], Outset Medical[31.95%], Bakkt [31.59%], P3 Health[27.95%] Best Smallcap Stocks Daily:
Innodata [55.34%], Cricut [47.20%], DASAN Zhone[30.11%], Latham Group[23.75%], Hyster-Yale Materials[23.55%], Ameresco [21.13%], Myriad Genetics[21.08%], iRobot [21.06%], Alpha and[20.87%], Bakkt [20.58%], Vigil Neuroscience[18.50%]